Revealing insights into people’s online and offline shopping behavior
Statistics
- Client
- Awards
- FWA of the day
- Awwwards site of the day
- European Design Award
- Dutch Design Award
- W3 Awards site of the day
- Deliverables
- Interactive data visualizations
- Public website
The challenge
With online and offline shopping experiences becoming increasingly intertwined, marketing professionals are faced with new challenges. Google’s Consumer Barometer is a global research project that Google established to give insights into how consumers use online and offline media in their purchase process and decisions.
Google approached CLEVER°FRANKE to redesign the platform so that it would provide a new interactive experience and devise a repository that would not only appeal to ‘power users’, but also attract new and first-time marketing professionals. With this project, we set a new benchmark for making complex research easy to comprehend and provided a solution for Google to further position itself as a thought leader in the field of online channel research.
Value delivered
Converting complex research data into easily understandable data insights and enabling market-specific research. Ensuring online and offline consumer behavior is accessible for everyone.
Background
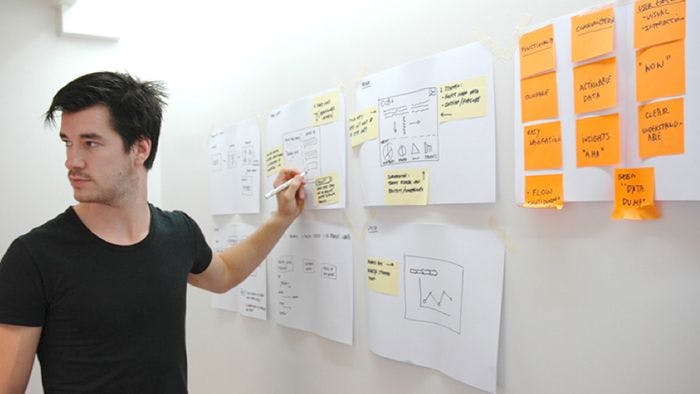
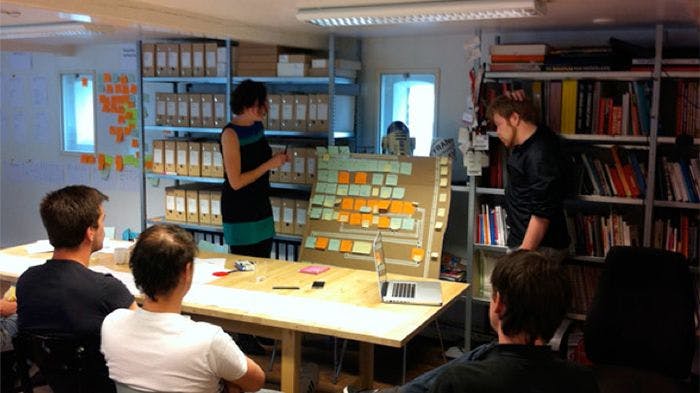
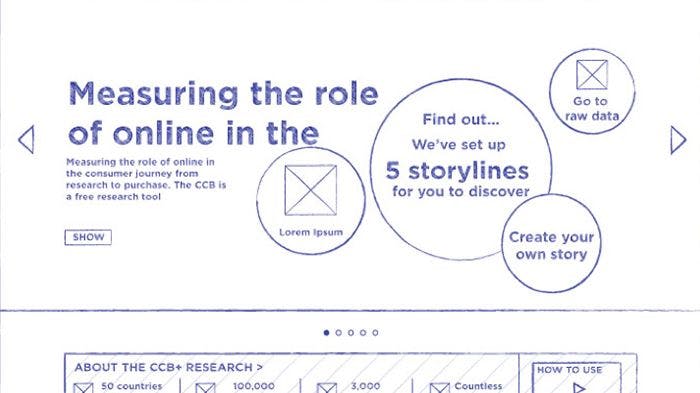
By looking into the data collected from the questionnaires in 43 countries, we discerned four major themes in the research. We developed four narratives around these themes that guide the visitor.
While building this tool, we focused on how users gather insights based on their interests, by selecting countries, product groups and audiences. With an explorative interface and graphing tool we aim to help them quickly dive into and explore specific data sets.
Phases and toolkit items used
Solution
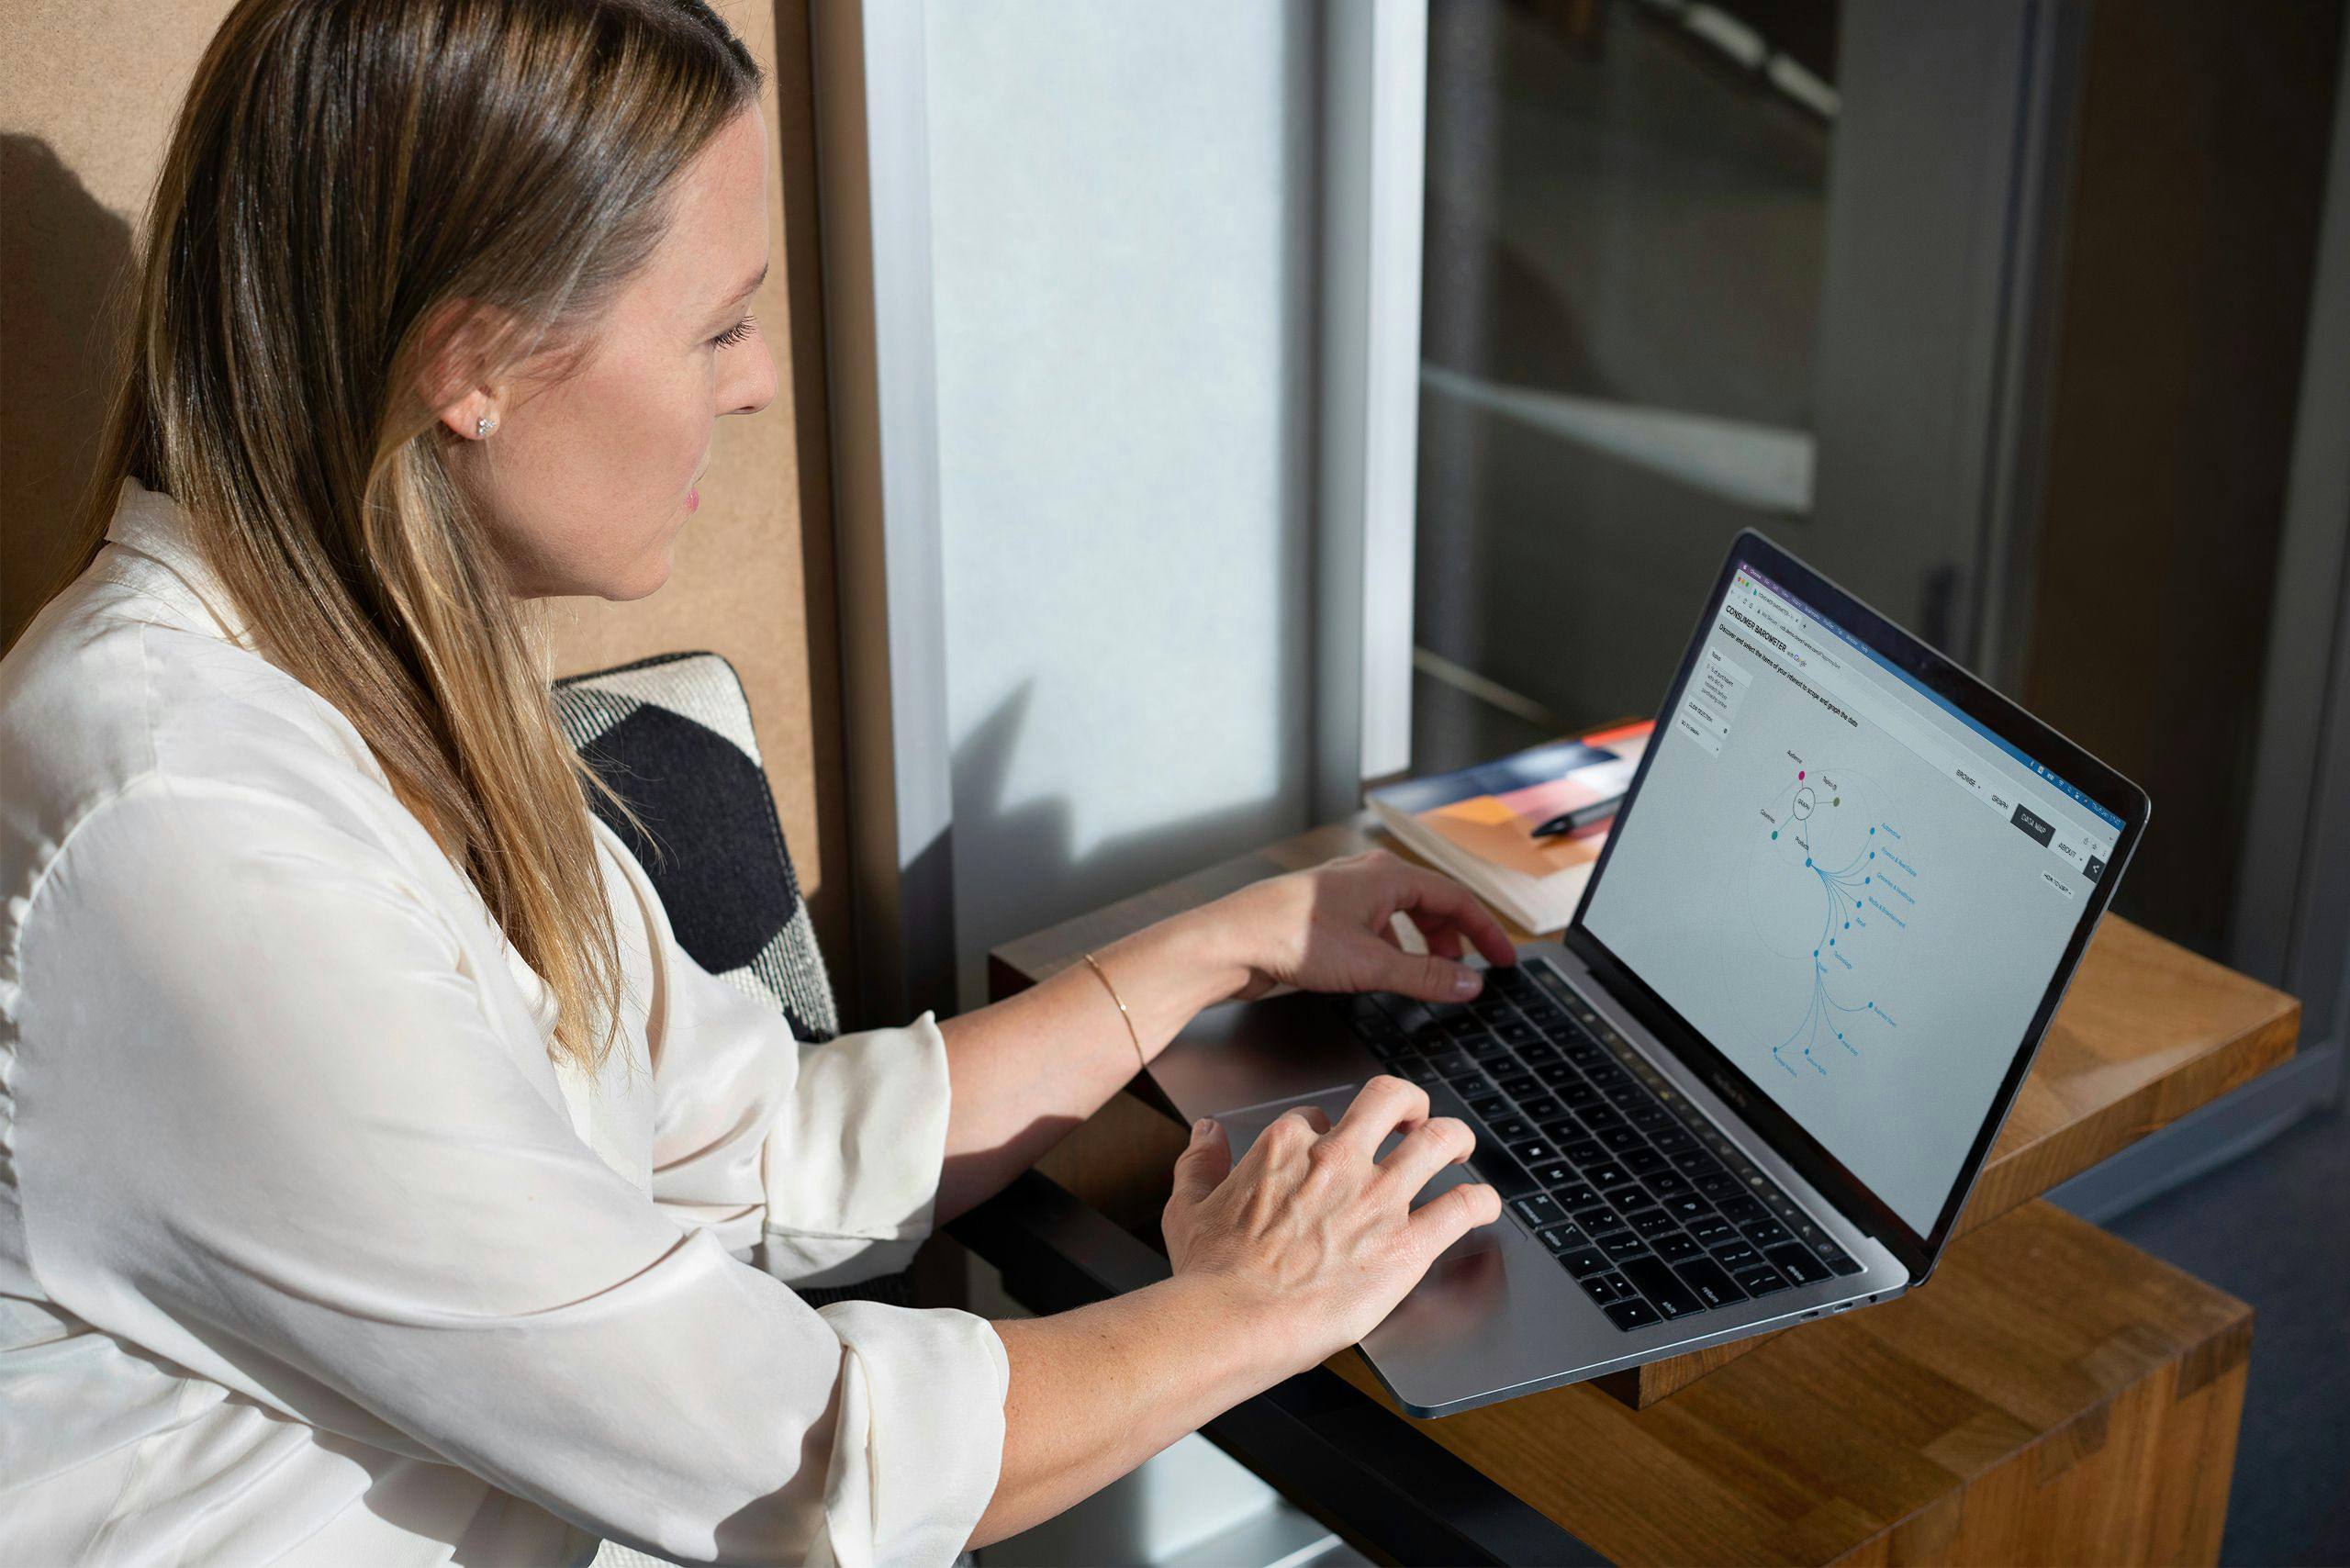
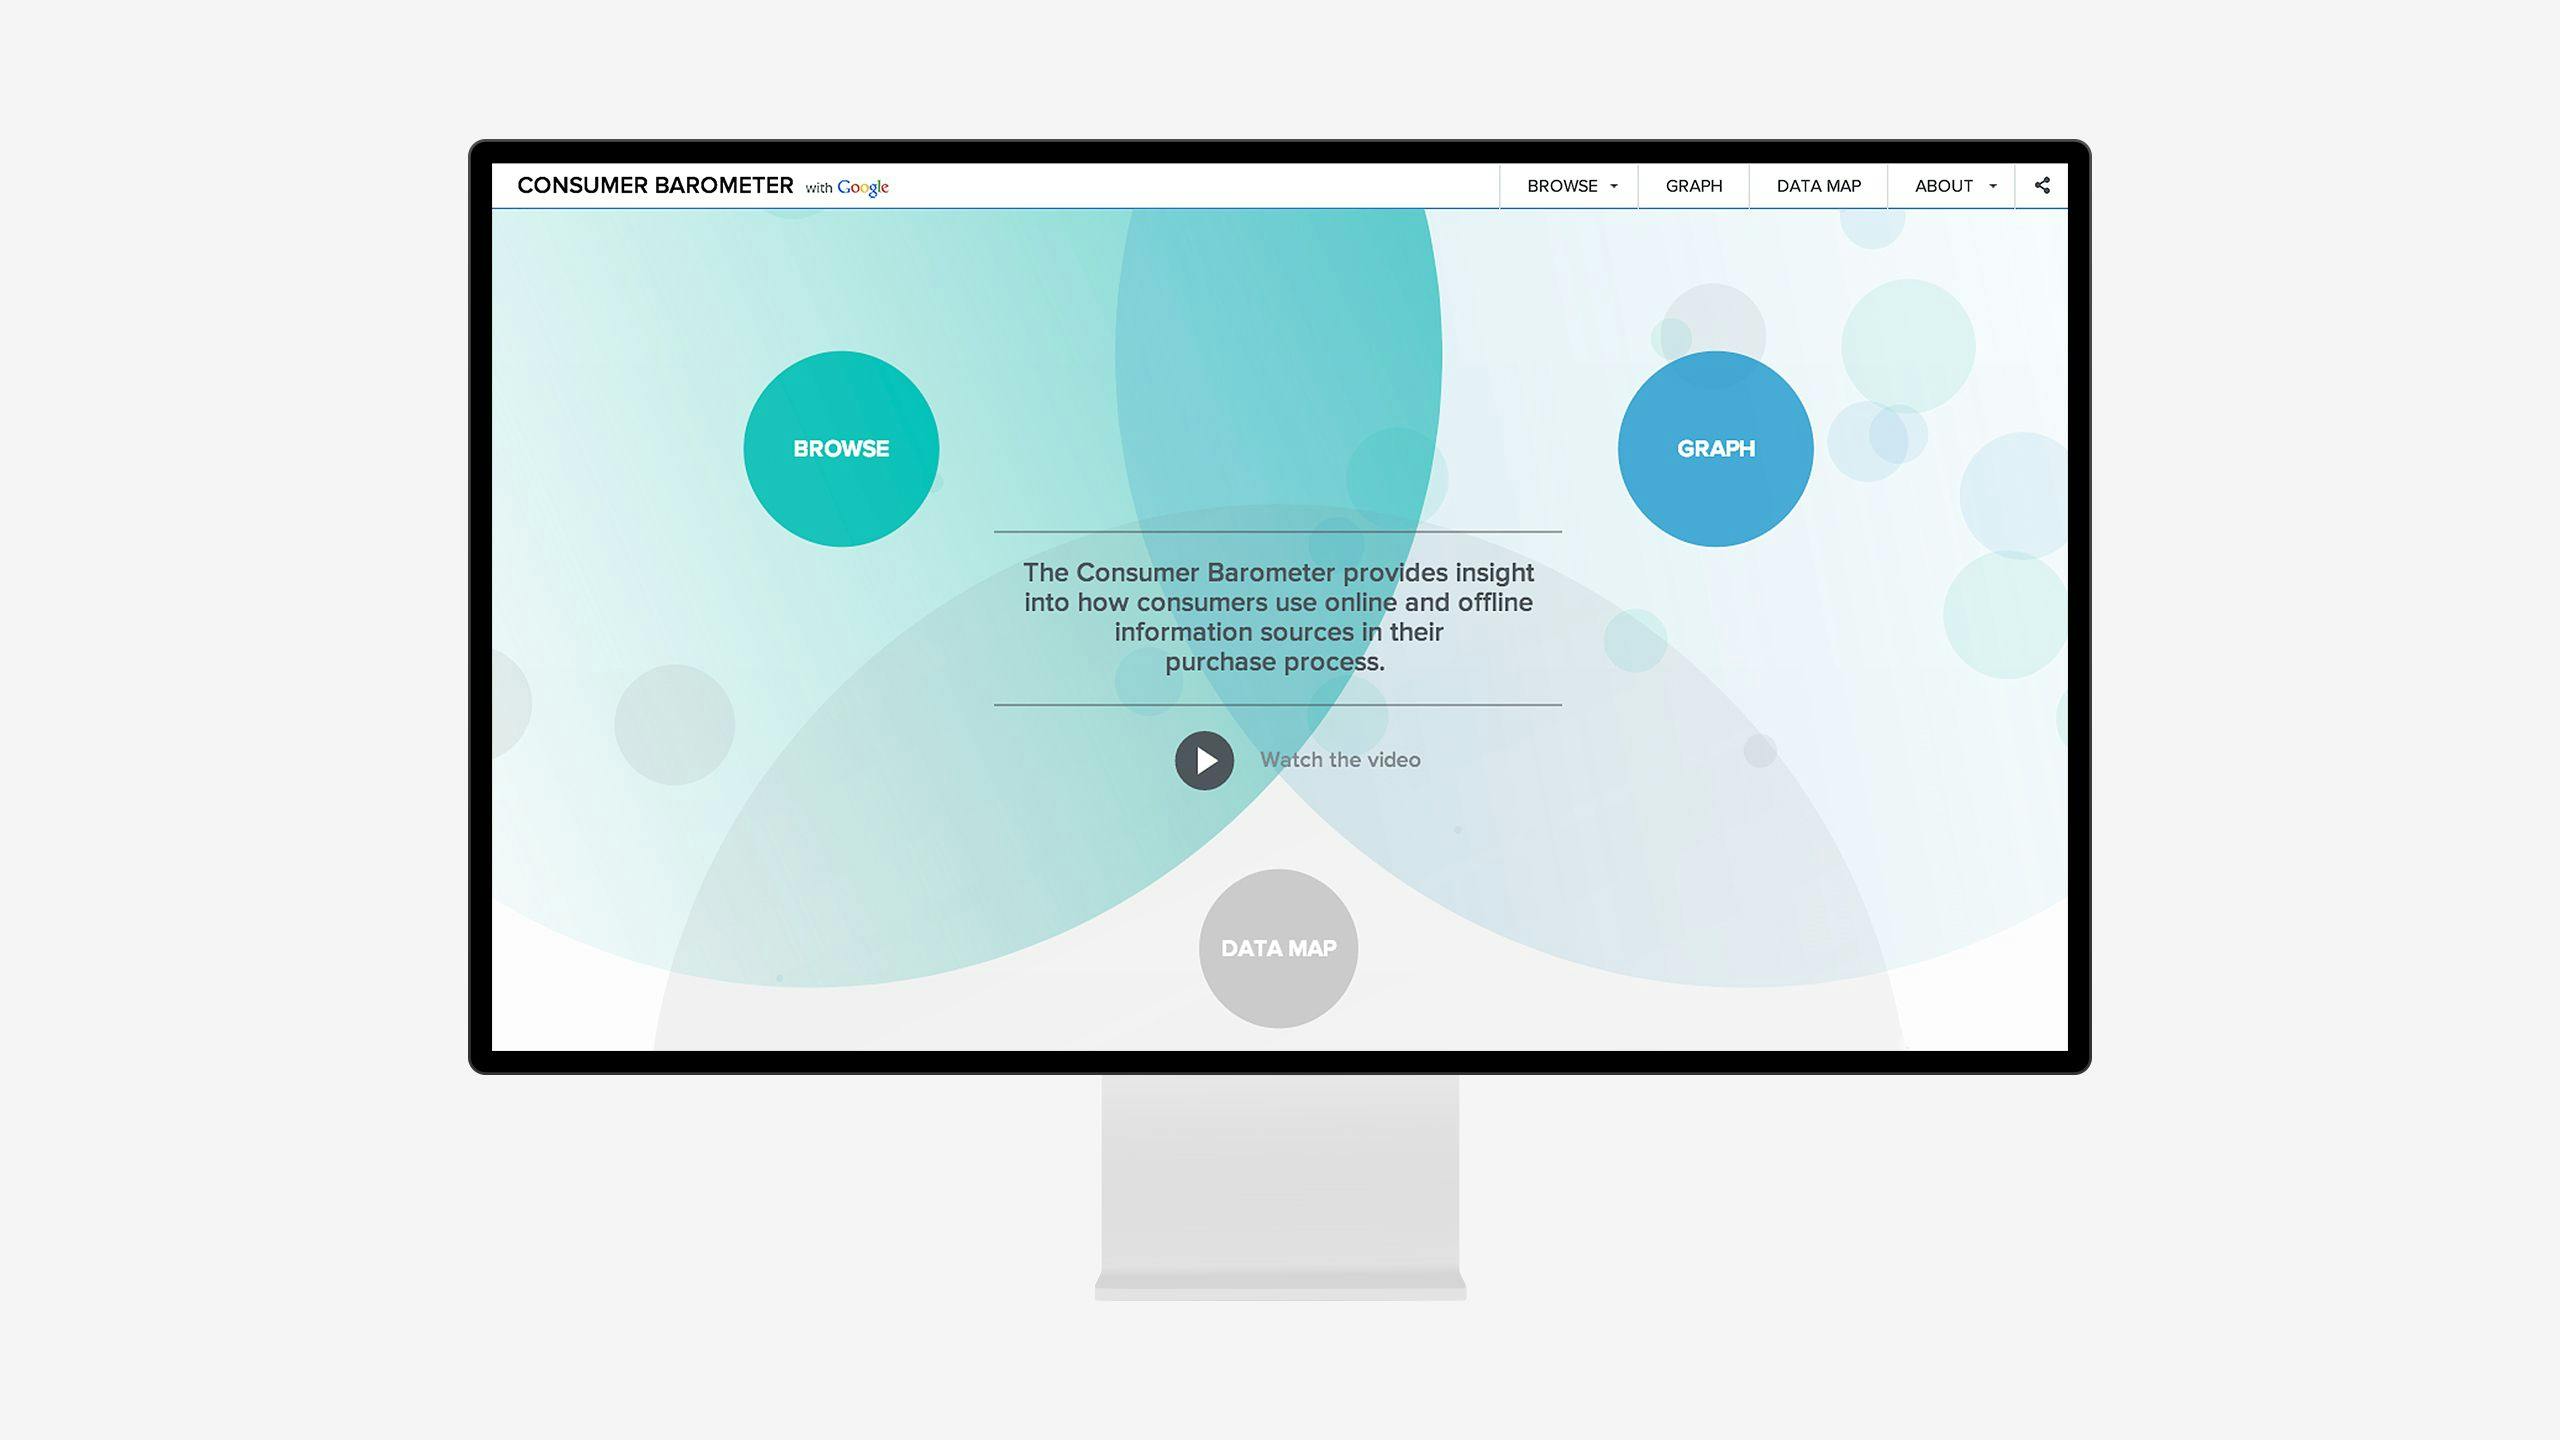
Our main goal was to offer an experience that entices the user to dive into the Consumer Barometer and discover insight in the data. We achieved this by assigning meaningful context to the data and providing several ways to create custom insights.
To further help the user understand the presented data, we did not just show plain numbers but also created dynamic sentences to automatically annotate graphs and factsheets. So users can digest their customized insights in numbers, texts, and visuals (graphs).

Contextualizingdata
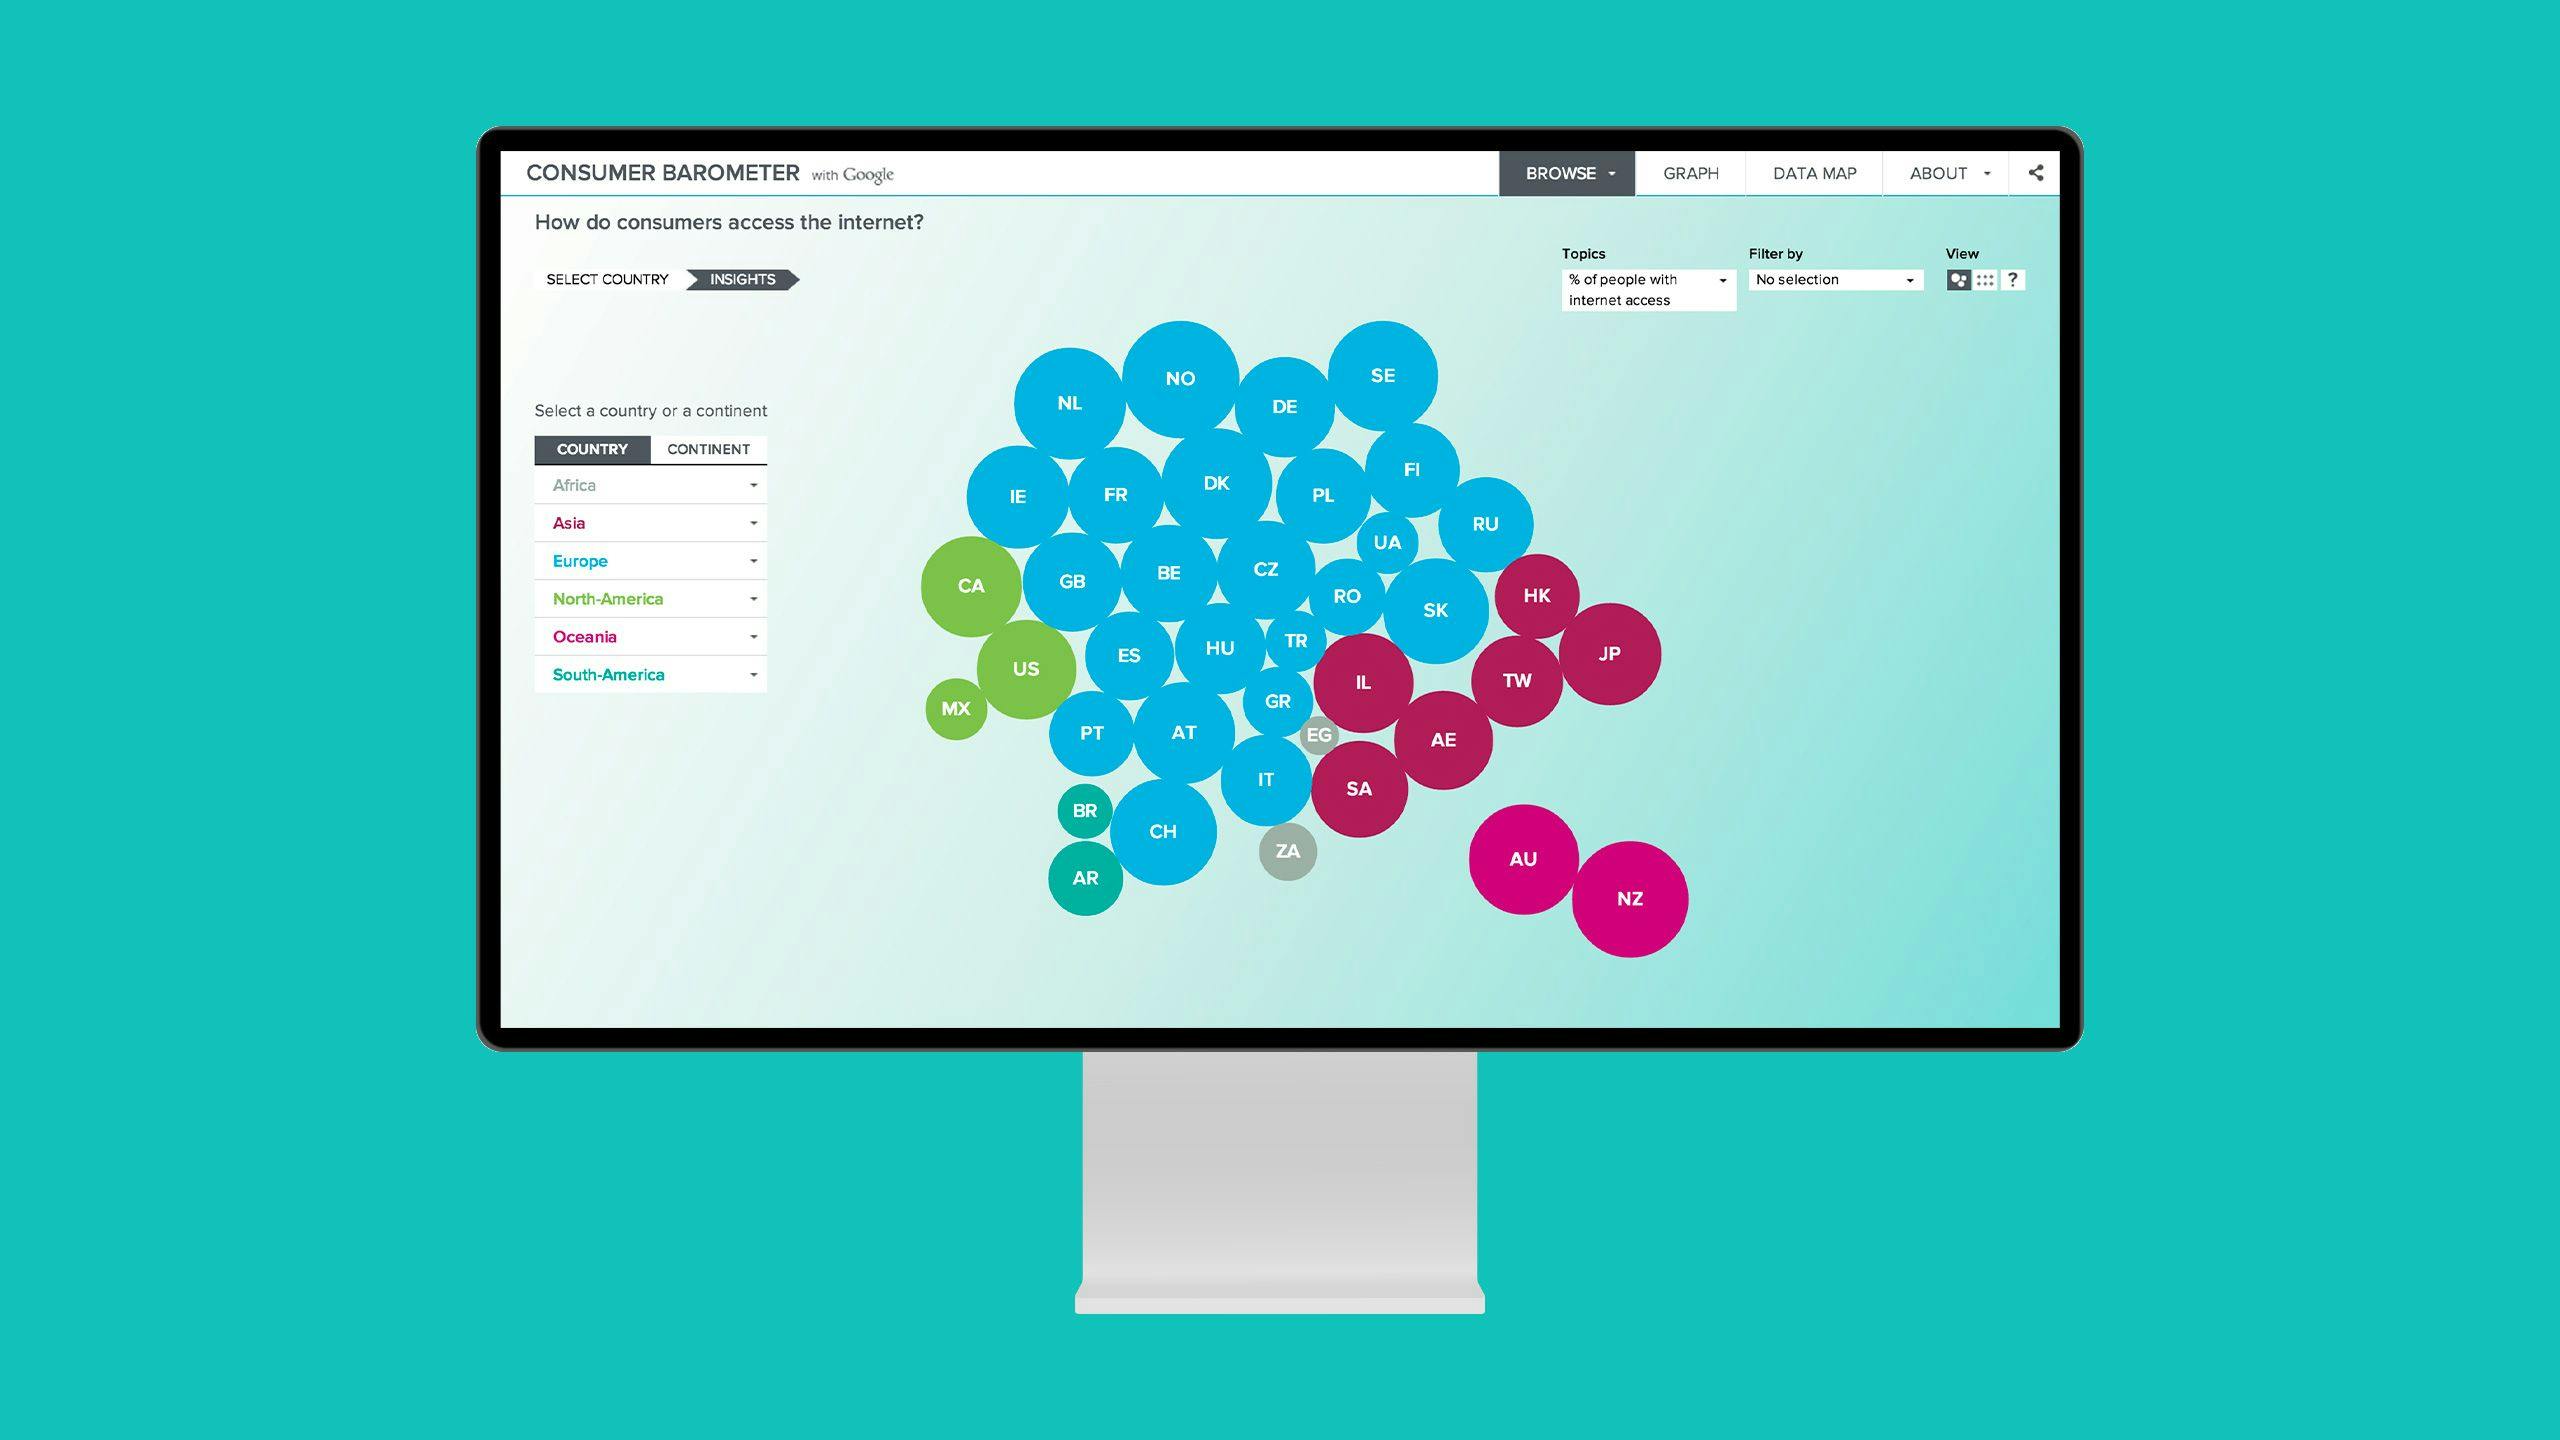
Within the platform, the data responds directly to the user’s interaction with it. The addition of category definitions not only allows the user to see the results, but to read the outcome in the context of the topic. For example: People who are [age range] with [income] purchase [online only].
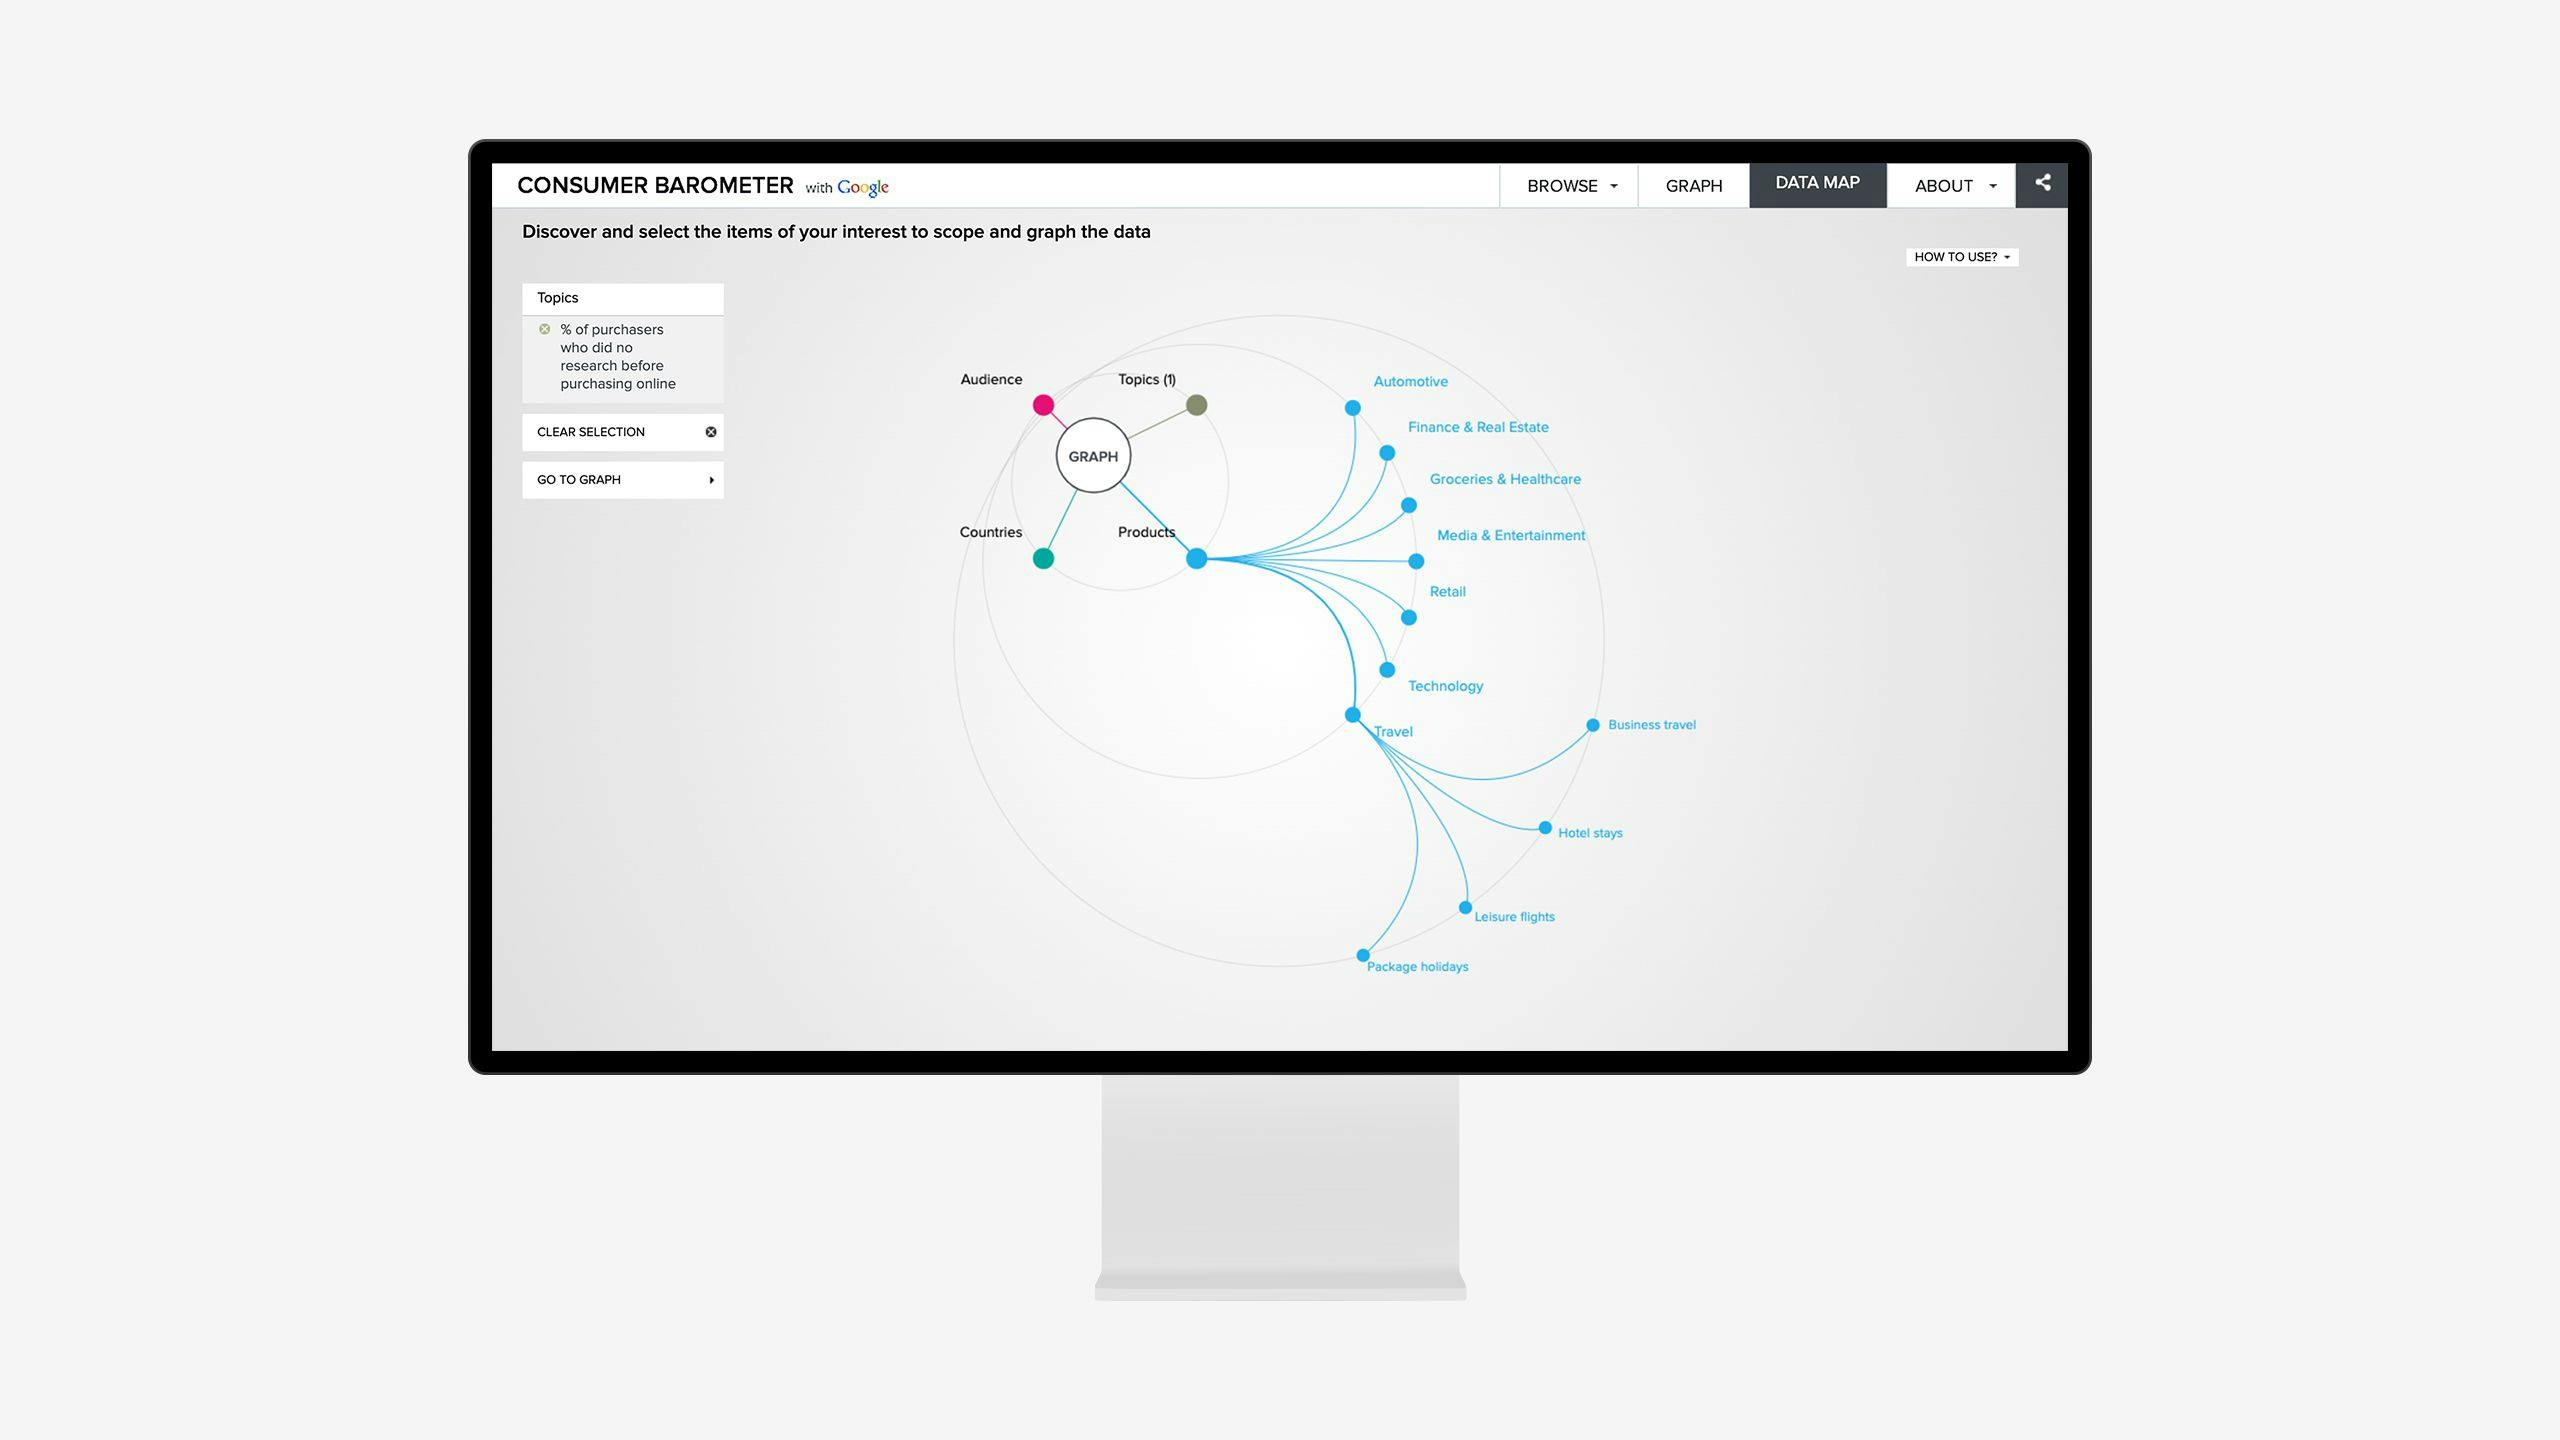
Navigatingthroughdatavisualizations
There are three main ways to explore and dive into data using the website. ‘Browse’ function guides through results in a series of data-driven stories, ‘graph’ allows selective comparison of various metrics based on the user’s needs and interests, and ‘data map’ organizes these metrics and shows the data structure in a map.
Technology
The consumer barometer runs on the App Engine platform which provides a setup that automatically scales horizontally, allocating more compute nodes to the project when more processing power is needed, and freeing them up again when it's not. This results in very stable performance under wildly varying traffic.
Using the C++ Qt platform, we were able to aggregate the enormous amount of respondent-level data about the research and purchase behavior of 43 countries. The Qt framework allowed us to squeeze the maximum performance out of commodity hardware and divide the load over the small pool of devices. It took four separate computing machines a combined 72 hours to produce the final data set.
The data map is rendered in Canvas and uses a custom written positioning engine to compute the best place for labels. All transitions and rendering for this project are done by a custom graphics library.
Results
The Consumer Barometer reached its two-year goal within the first six months. The website gained thousands of online mentions and received numerous design awards. To this day, the Consumer Barometer remains an important reference tool for marketing professionals.