read15 min
Engineering a living visual language
How ADC’s new branding learns from context
To navigate the world’s complexity, we pursue innovative solutions through diverse research. We analyze our processes, ask questions, explore new fields, refine skills, and embrace creativity to enhance methodologies and techniques.
Engineering a living visual language
How ADC’s new branding learns from context
Telling the story of our studio using weather data
A large-scale data visualization and commemorative installation using historical weather data
Creating a tool to support dynamic design
How can we build a generative system that translates weather data into a visually rich installation?
AI scoring beyond technical performance
What if AI models came with a label?
A design approach towards participatory machine learning
Designing over thirty thousand unique bouquets
How can we design a creative engine for mass-generated personalized compositions?
Trustworthy interactions with large language models
How can we integrate large language models in design effectively while addressing their limitations and ensuring trust?
600 years of deforestation in the style of Hieronymus Bosch
How can generative AI be leveraged to create visual stories for social and environmental issues?
Challenging design briefs
How we leverage problem-solving to deliver exceptional results?
Network activity visualizations
Visualizing cybersecurity data on a global scale
ESG needs data design [Part 1]
At CLEVER°FRANKE, we’re curious about how ESG Scores are presented and communicated.
ESG needs data design [Part 2]
At CLEVER°FRANKE, we’re curious about how ESG Scores are presented and communicated.
Foursquare visualization on city activities
Virtual activity of cities
Our colored view of the world
Exploring how we experience color and media
Geographical scrollytelling
A creative approach to workshops on AI-powered design
Grand tour cycling visualization
Meetup recap: designing with data and AI
Seeing data through multiple visualization techniques
Seeing data through multiple visualization techniques
Meetup recap: building trustworthy AI
Eurovision interactive poster
Giving insight into the design process
Technology is creating a complex future; Design is the key to unlocking technology from its black box
The evolution and future of interactive data visualization
Data visualization: a subjective lens on reality
Visualizing migration in the media
How AI integrates into our data design process
Corona Barometer
Lessons learned: usability testing of the Dutch COVID-19 dashboard
Lessons learned: usability testing of the Dutch COVID-19 dashboard
Smart city sensor visualization
Real-time visualization of the Smart City sensors
Particle wind font
A font based on wind animation
Discovering ‘Moments that Matter’ for truly meaningful data design
Part of the C°F Data Design Toolkit
The power of data design systems
How to get to better data-driven products at scale faster
Transparent AI
AI and bias: the importance of critically questioning machine learning technologies
Visualizing the feel of a smart home
Smart home visualization
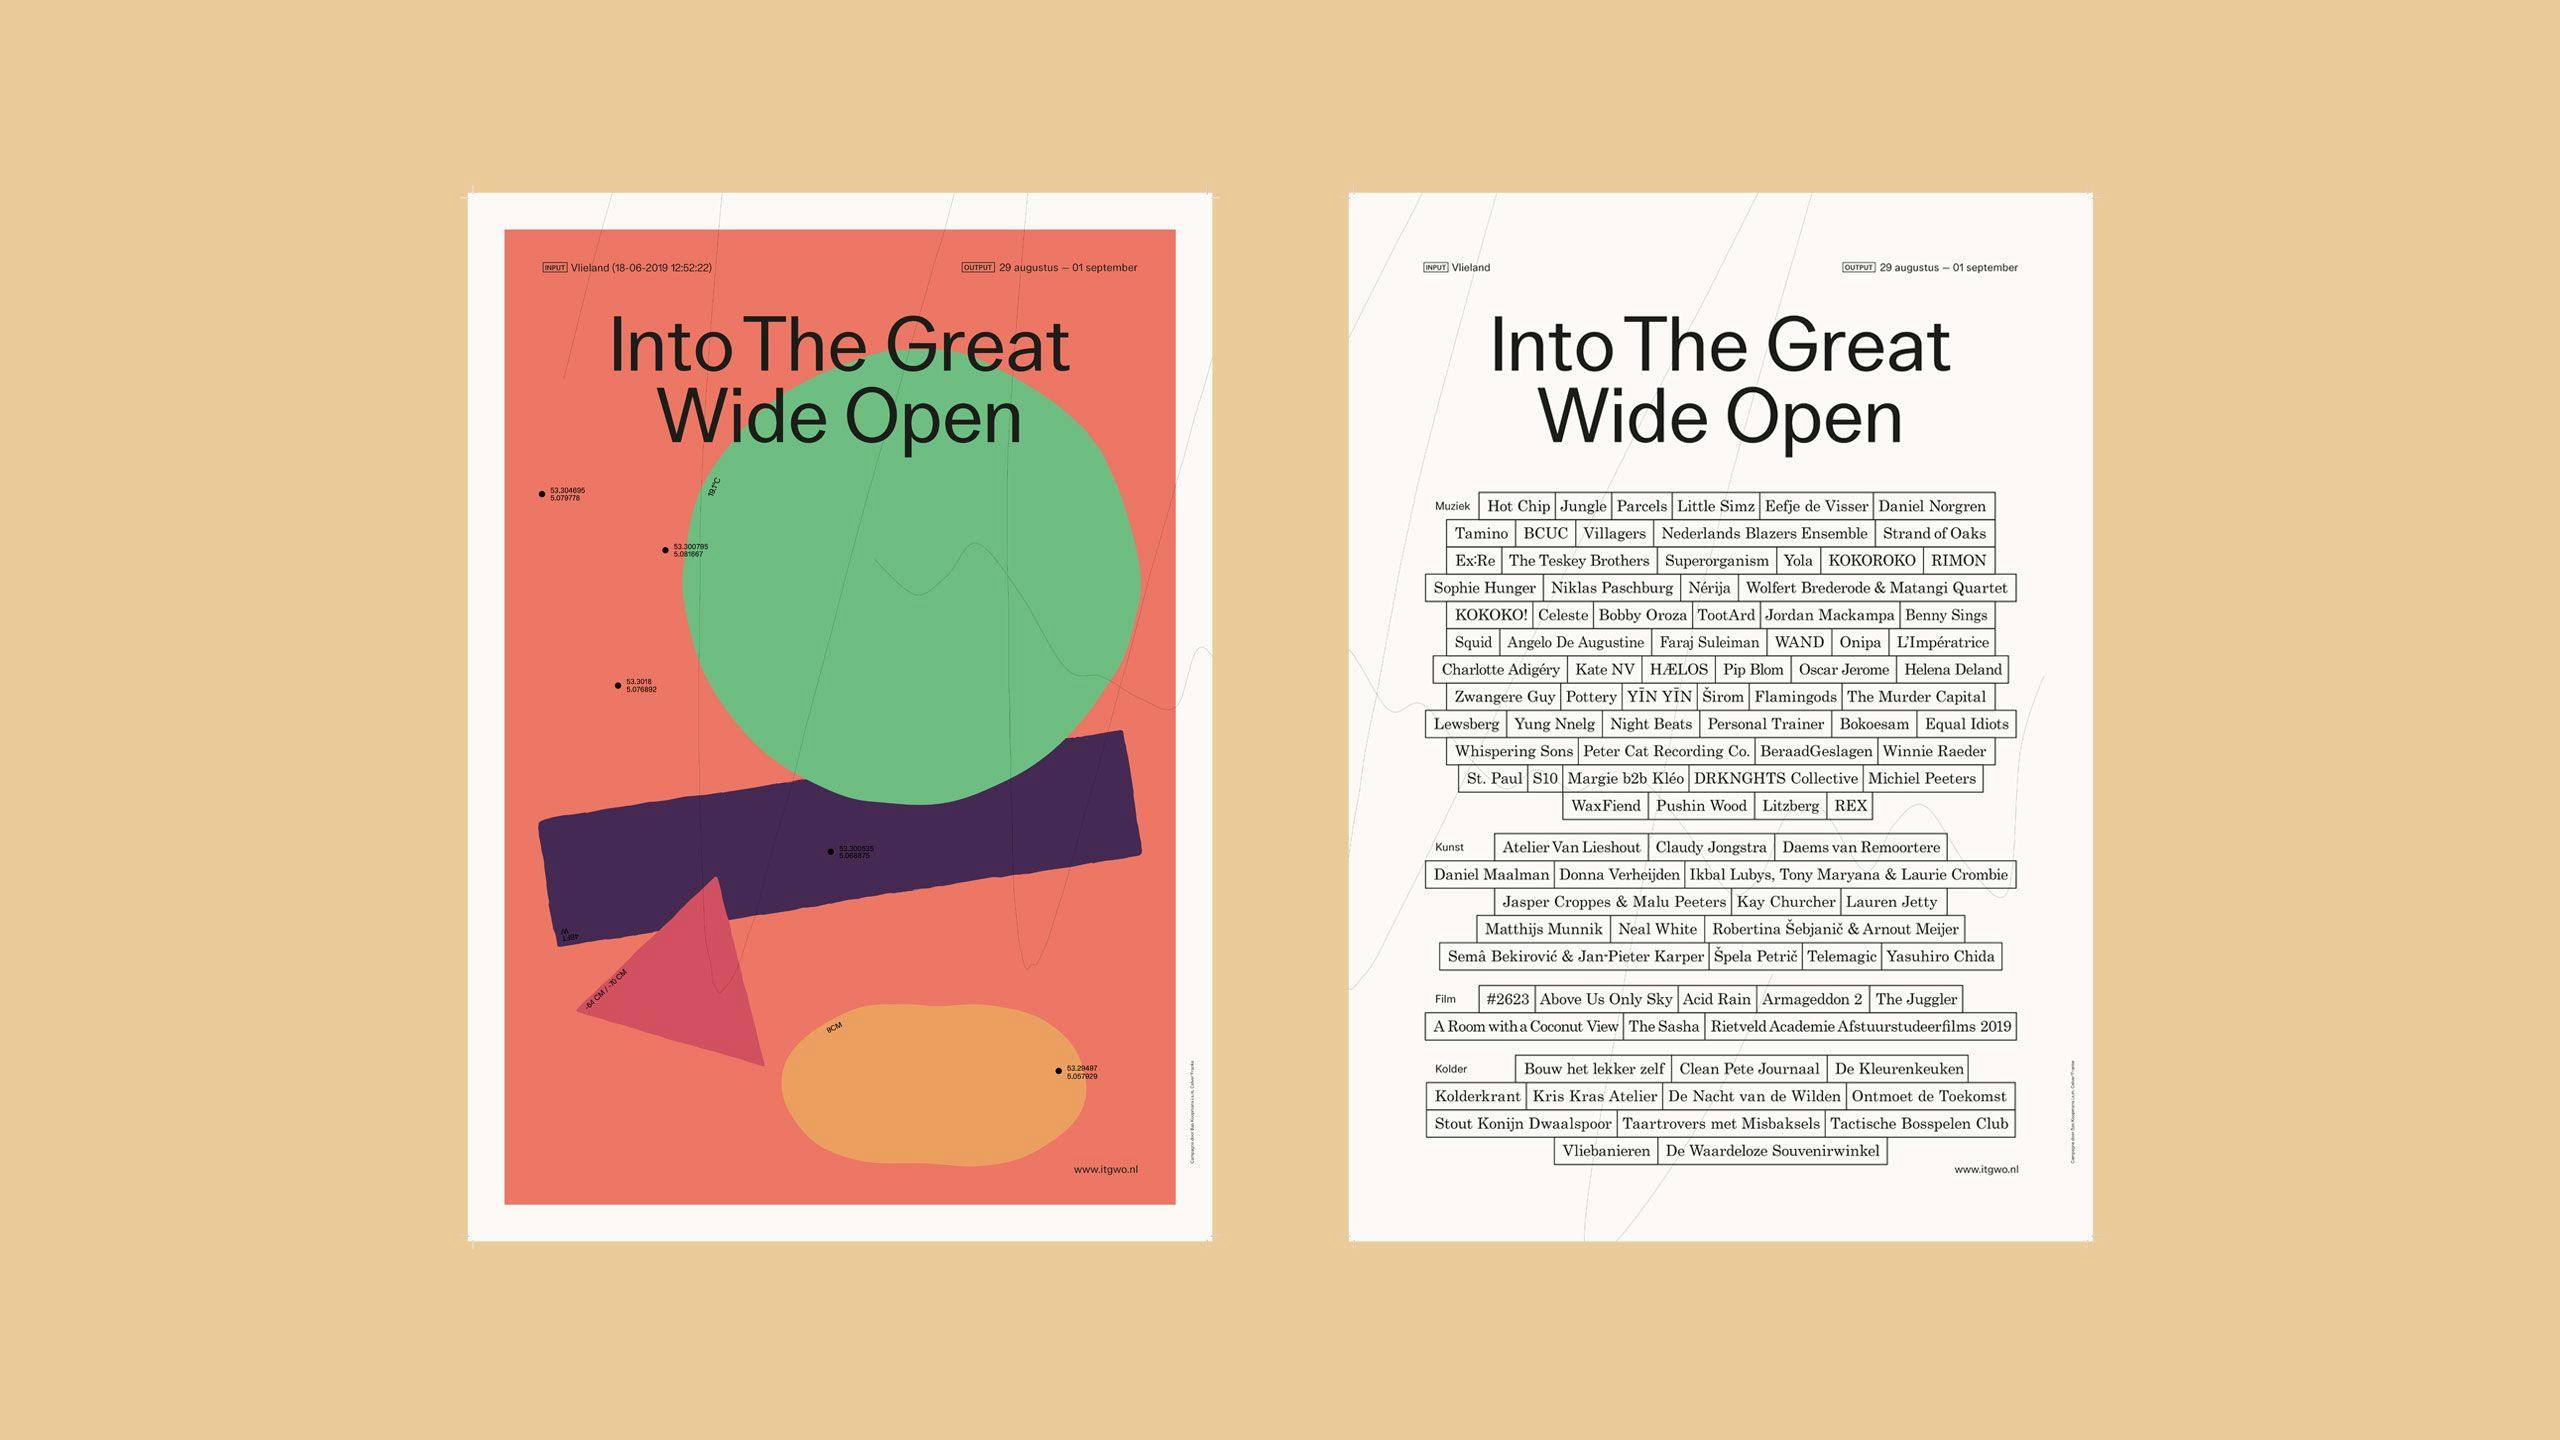
Into The Great Wide Open poster generator
Poster generator
Increase your App’s performance with React hooks and the React Dev tools
Increase your App’s performance with React hooks and the React Dev Tools
Personalized data embroideries
Recapturing the Atlas Mountain Race through stories embedded in data
Visualizing migration in England and Wales
Exploring public understanding of migration data
5 approaches to sustainability data design
Different ways to apply Data Design to inform about our changing world and drive action.
How to improve the accessibility of your web apps
Simple ways to enhance your projects
How turning data into a product can shape the brand identity of a business
A different approach to branding
BMX ride signature visualization
Revealing the unique style of each cyclist
Leveraging Agile Scrum in Design Sprints
A practical guide based on a real-life client case
Reshaping our urban mobility through data and design
Five drivers that are transforming the mobility sector now and how data and design can be applied to create a better future.
Virtual LED window for Sensor Lab
Virtual LED window
Understanding environments through atmospheric sensors
Smart watch visualization
Dynamic color research visualizations
Visualizing the color data of our projects with motion
C°F Experiments: Learning and Growing Through Experimentation
CLEVER°FRANKE’s self-initiated projects and the value of experimentation
Combining Lifelines data with creativity to create compelling insights
How design opened the door for scientific data at the Stedelijk Museum Amsterdam
Quieting the digital noise
How design can create a calmer world
Create a react SlideToggle component with hooks and react-spring
Combining React Spring and Hooks to create a reusable SlideToggle component.
Design in the data-driven future of healthcare
How thoughtful design can help make good on the promise of data in healthcare.
Visualizing the usage of The Things Network
Making complex, technical data from The Things Network accessible and engaging
Energy consumption and data usage of household devices
Exploring AR and machine learning for smart home innovations
Global weather stations average temperature
We visualized weather stations around the world in a 3D environment.
Our colored view of the world
How online news articles paint our worldview
How we test client web projects with minimum effort for high value
Testing web applications can be difficult and tedious. We’ll show you how to reduce the burden of testing and make it a more pleasurable experience.
Creating Calm Business Strategies
Calm UX in Practice
AI Driven musical experience for Google
What are the possibilities of AI for creating interactive engagements with music?
Flight of the Night Re-imagined
What role can artistic and generative design play in reshaping data visualization?
Client Relations Matter; Moving Closer to Get Better
How opening a U.S. office is helping us solidify our client relationships.
Recapturing a cycle race through data embroideries
Data embroidery
Applying for a job as a digital designer (Visual / UX)
Useful tips for any applicant regardless of their seniority
Design and technology: pioneering amongst constraints
How can constraints in design projects be reframed as opportunities for innovation?
Indianapolis precipitation flooding simulation
Precipitation simulation
Smart office atmosphere visualization
How can generative visuals turn sensor data into an expressive, room-specific ecosystem?
Visualizing climate mobility in Africa
How different user goals shaped our technical approach
Managing complexity
How to manage projects with no predefined outcome?
On applying for a job as a developer
Some practical advice in showing your value and getting noticed by hiring managers.