
Background
‘Seeing Data’ is a collaborative research project led by the University of Sheffield and the Migration Observatory Oxford. The project investigates how people make sense of big data visualizations using migration data as the topic and basis for the visualizations of the experiment. This visualization focusses on quantitative data taken from the 2011 census.
What did we learn?
This visualization posed a technical challenge for is because we wanted to use a force directed chart rather then a conventional map. This required some research, experimenting and prototyping with different Javascript libraries. Eventually, we found a way to combine D3s projection and force-directed functionality.
Ambitions
The project creates new perspectives on conducting additional research into how the general pubic perceives big data.
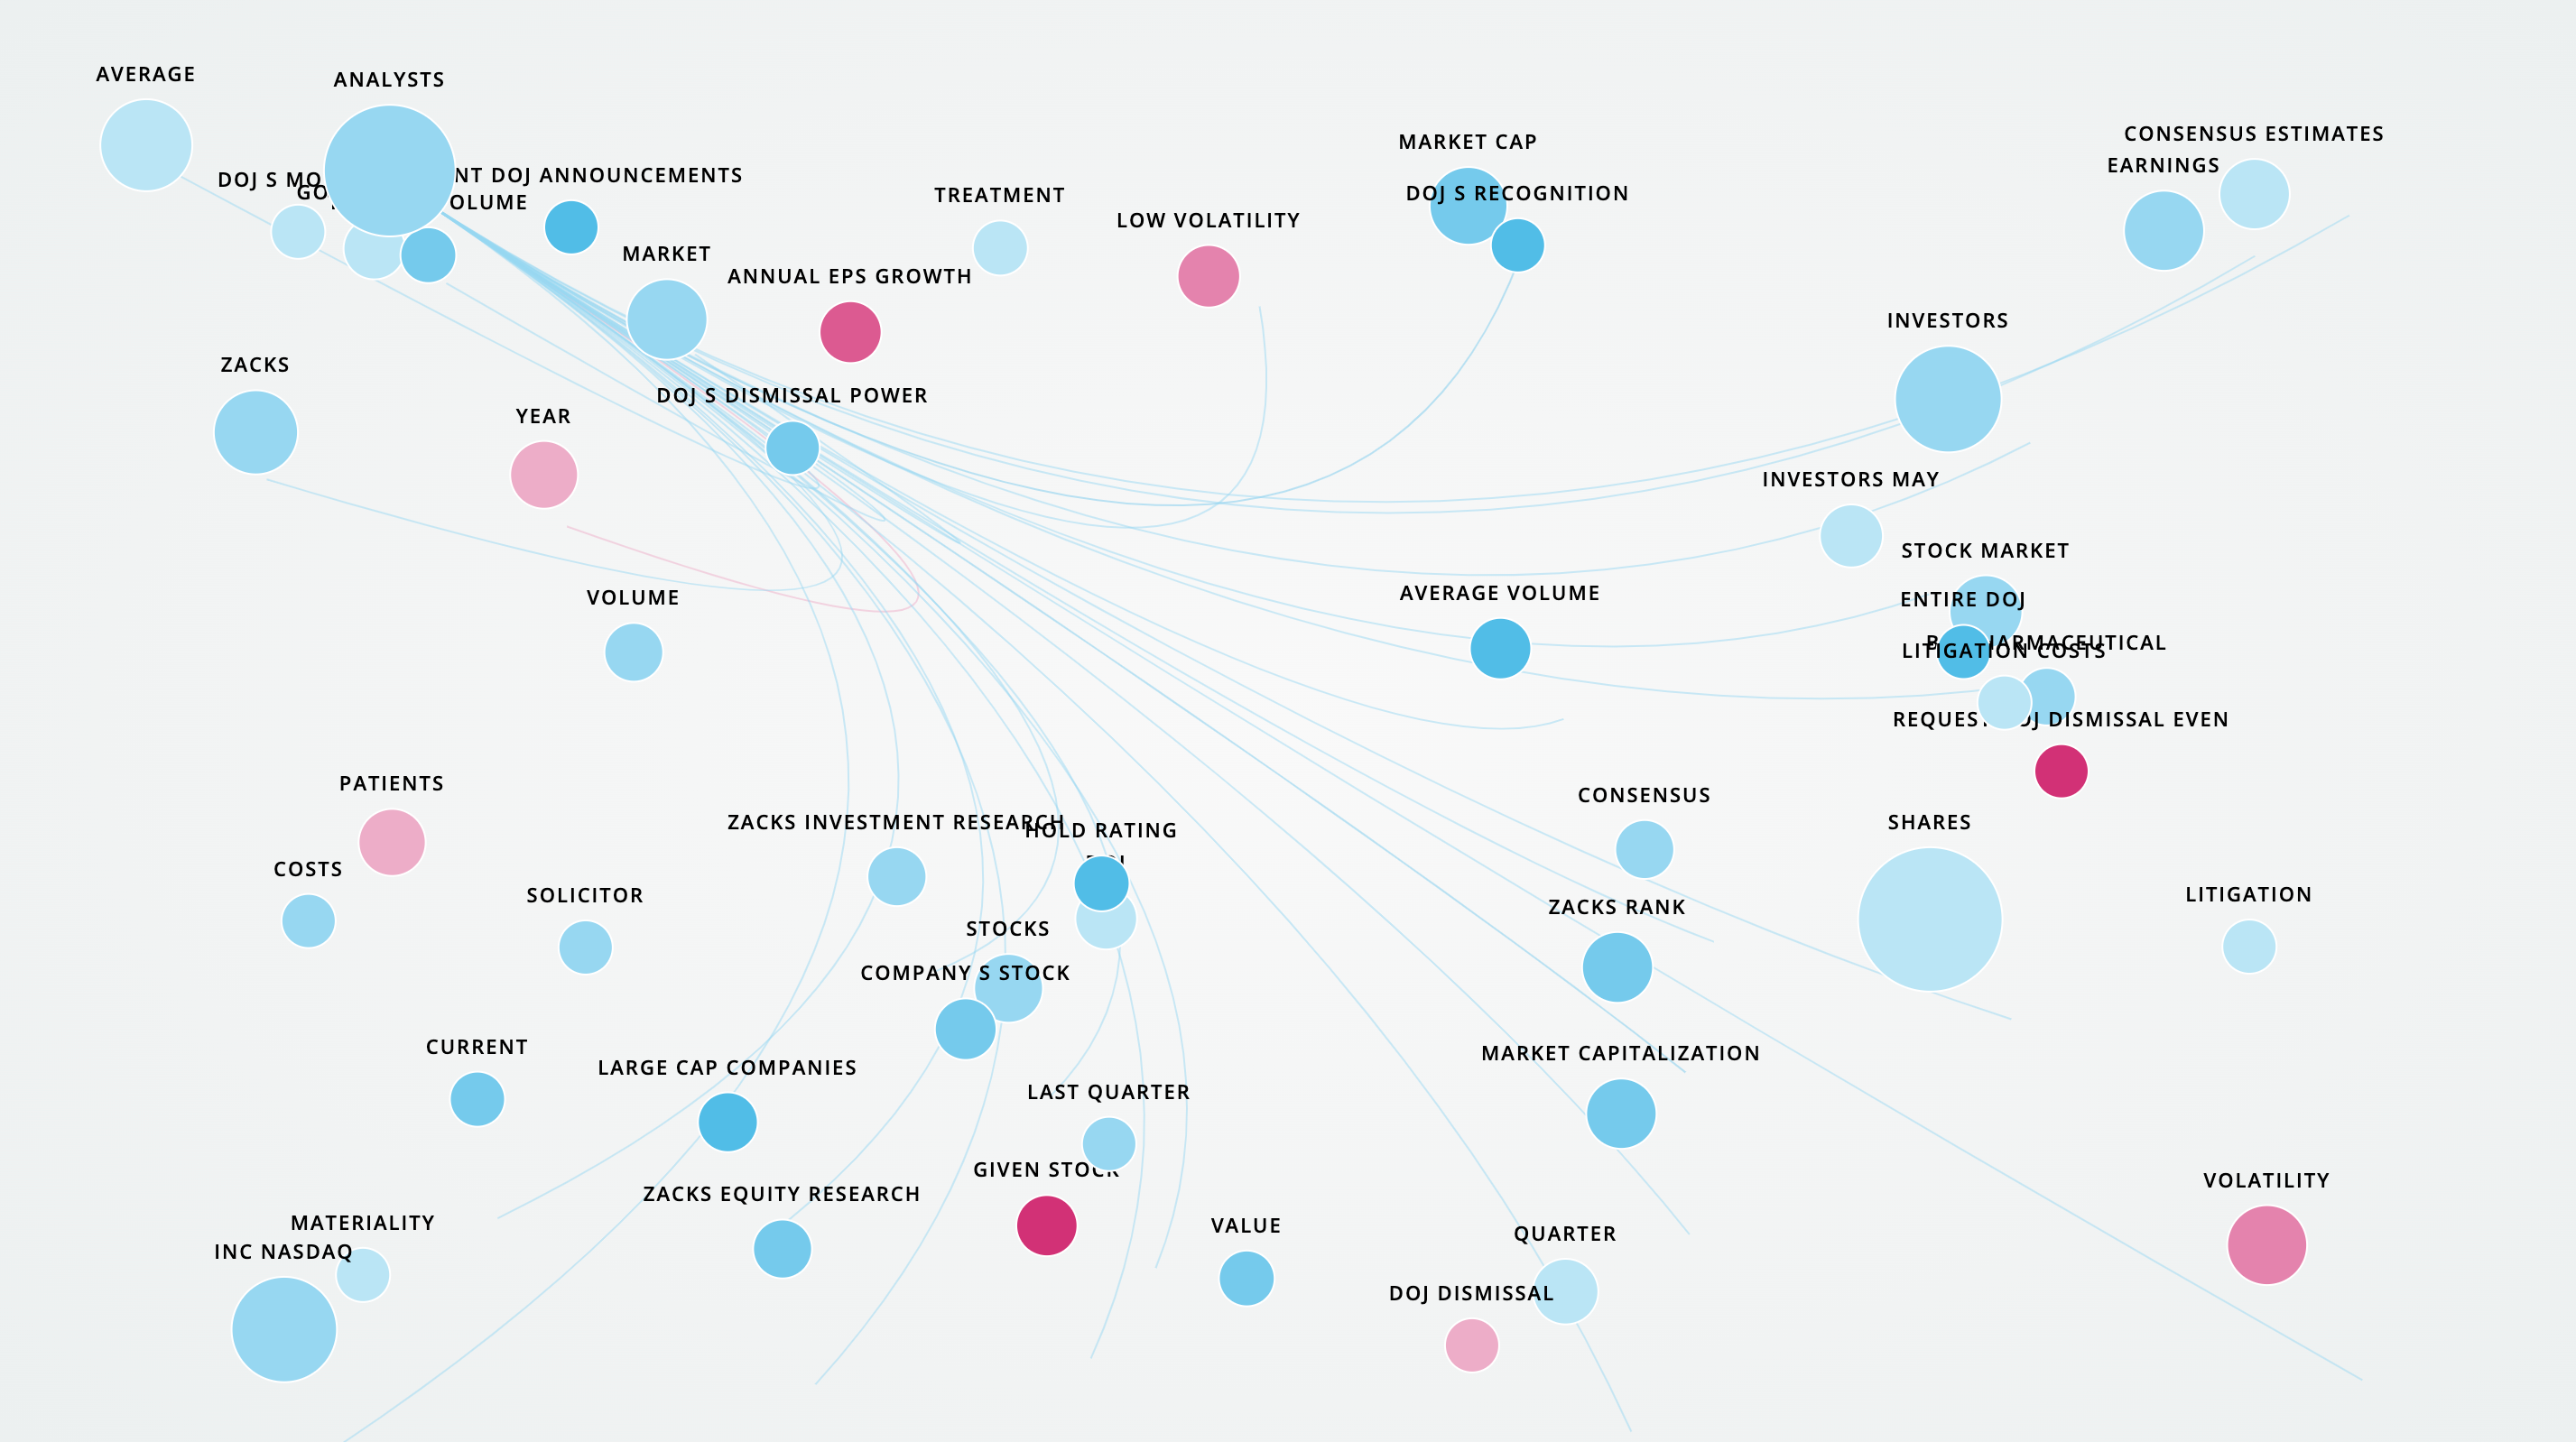
Seeing data through multiple visualization techniques
Seeing data through multiple visualization techniques

Foursquare visualization on city activities
Virtual activity of cities
Create a react SlideToggle component with hooks and react-spring
Combining React Spring and Hooks to create a reusable SlideToggle component.