Showcasing connectivity speeds at the Mobile World Congress
Statistics
- Client
- Ookla
- Awards
- Red Dot Design Award
- Deliverables
- Generative 3D visualization tool
- Data-driven videos
The challenge
Ookla is a global leader in both fixed and mobile network testing and analysis. They have a variety of products that provide customers with more insights into the quality of their connections and services.
CLEVER°FRANKE was asked to showcase the quality and coverage of several Ookla products on a large display at their booth during the Mobile World Congress 2022. With our visualizations, we help Ookla visualize the power and unique value of their data.
The visualizations had to impress and engage visitors, and trigger a follow-up conversation with the Ookla’s staff at the booth.
Value delivered
Showcasing the quality and amount of data available within Ookla’s products to further ignite Ookla as the industry leader in network intelligence and experience. By enabling people to explore Ookla's data layer in a 3D environment, we make it tangible, help people discover where they can improve the network, and also open future possibilities for further technical applications (AR, VR, or metaverse).
Background
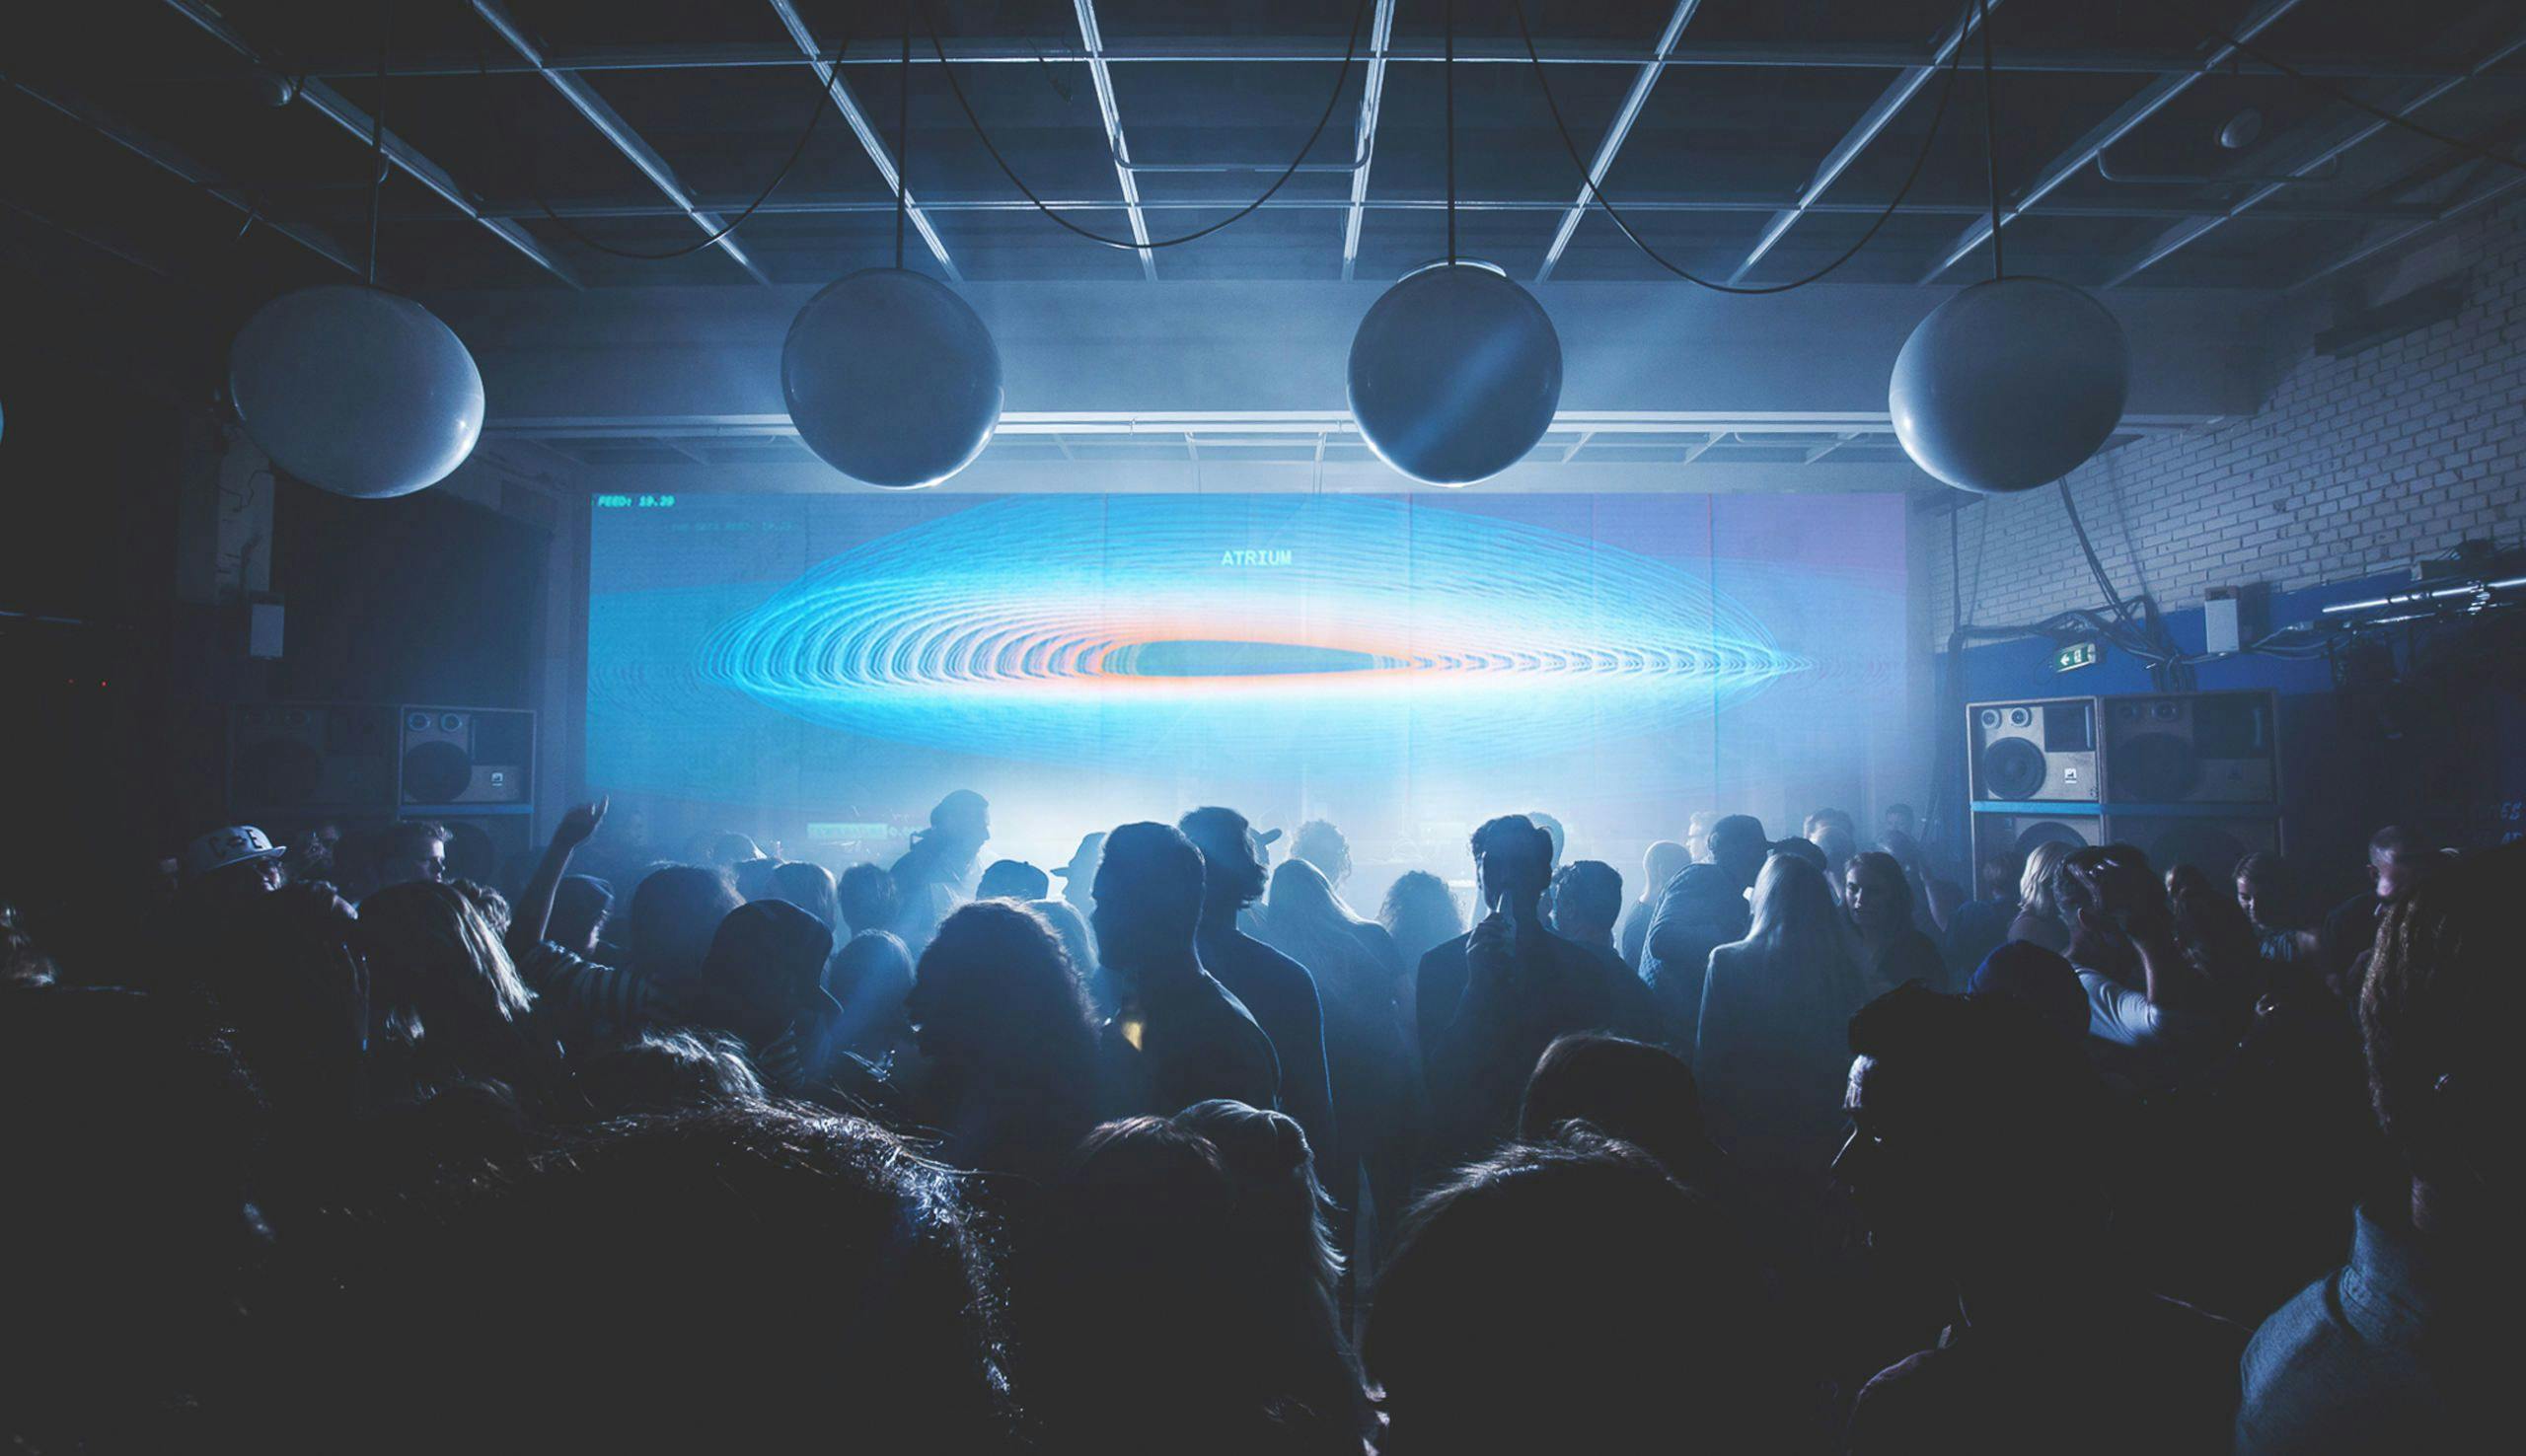
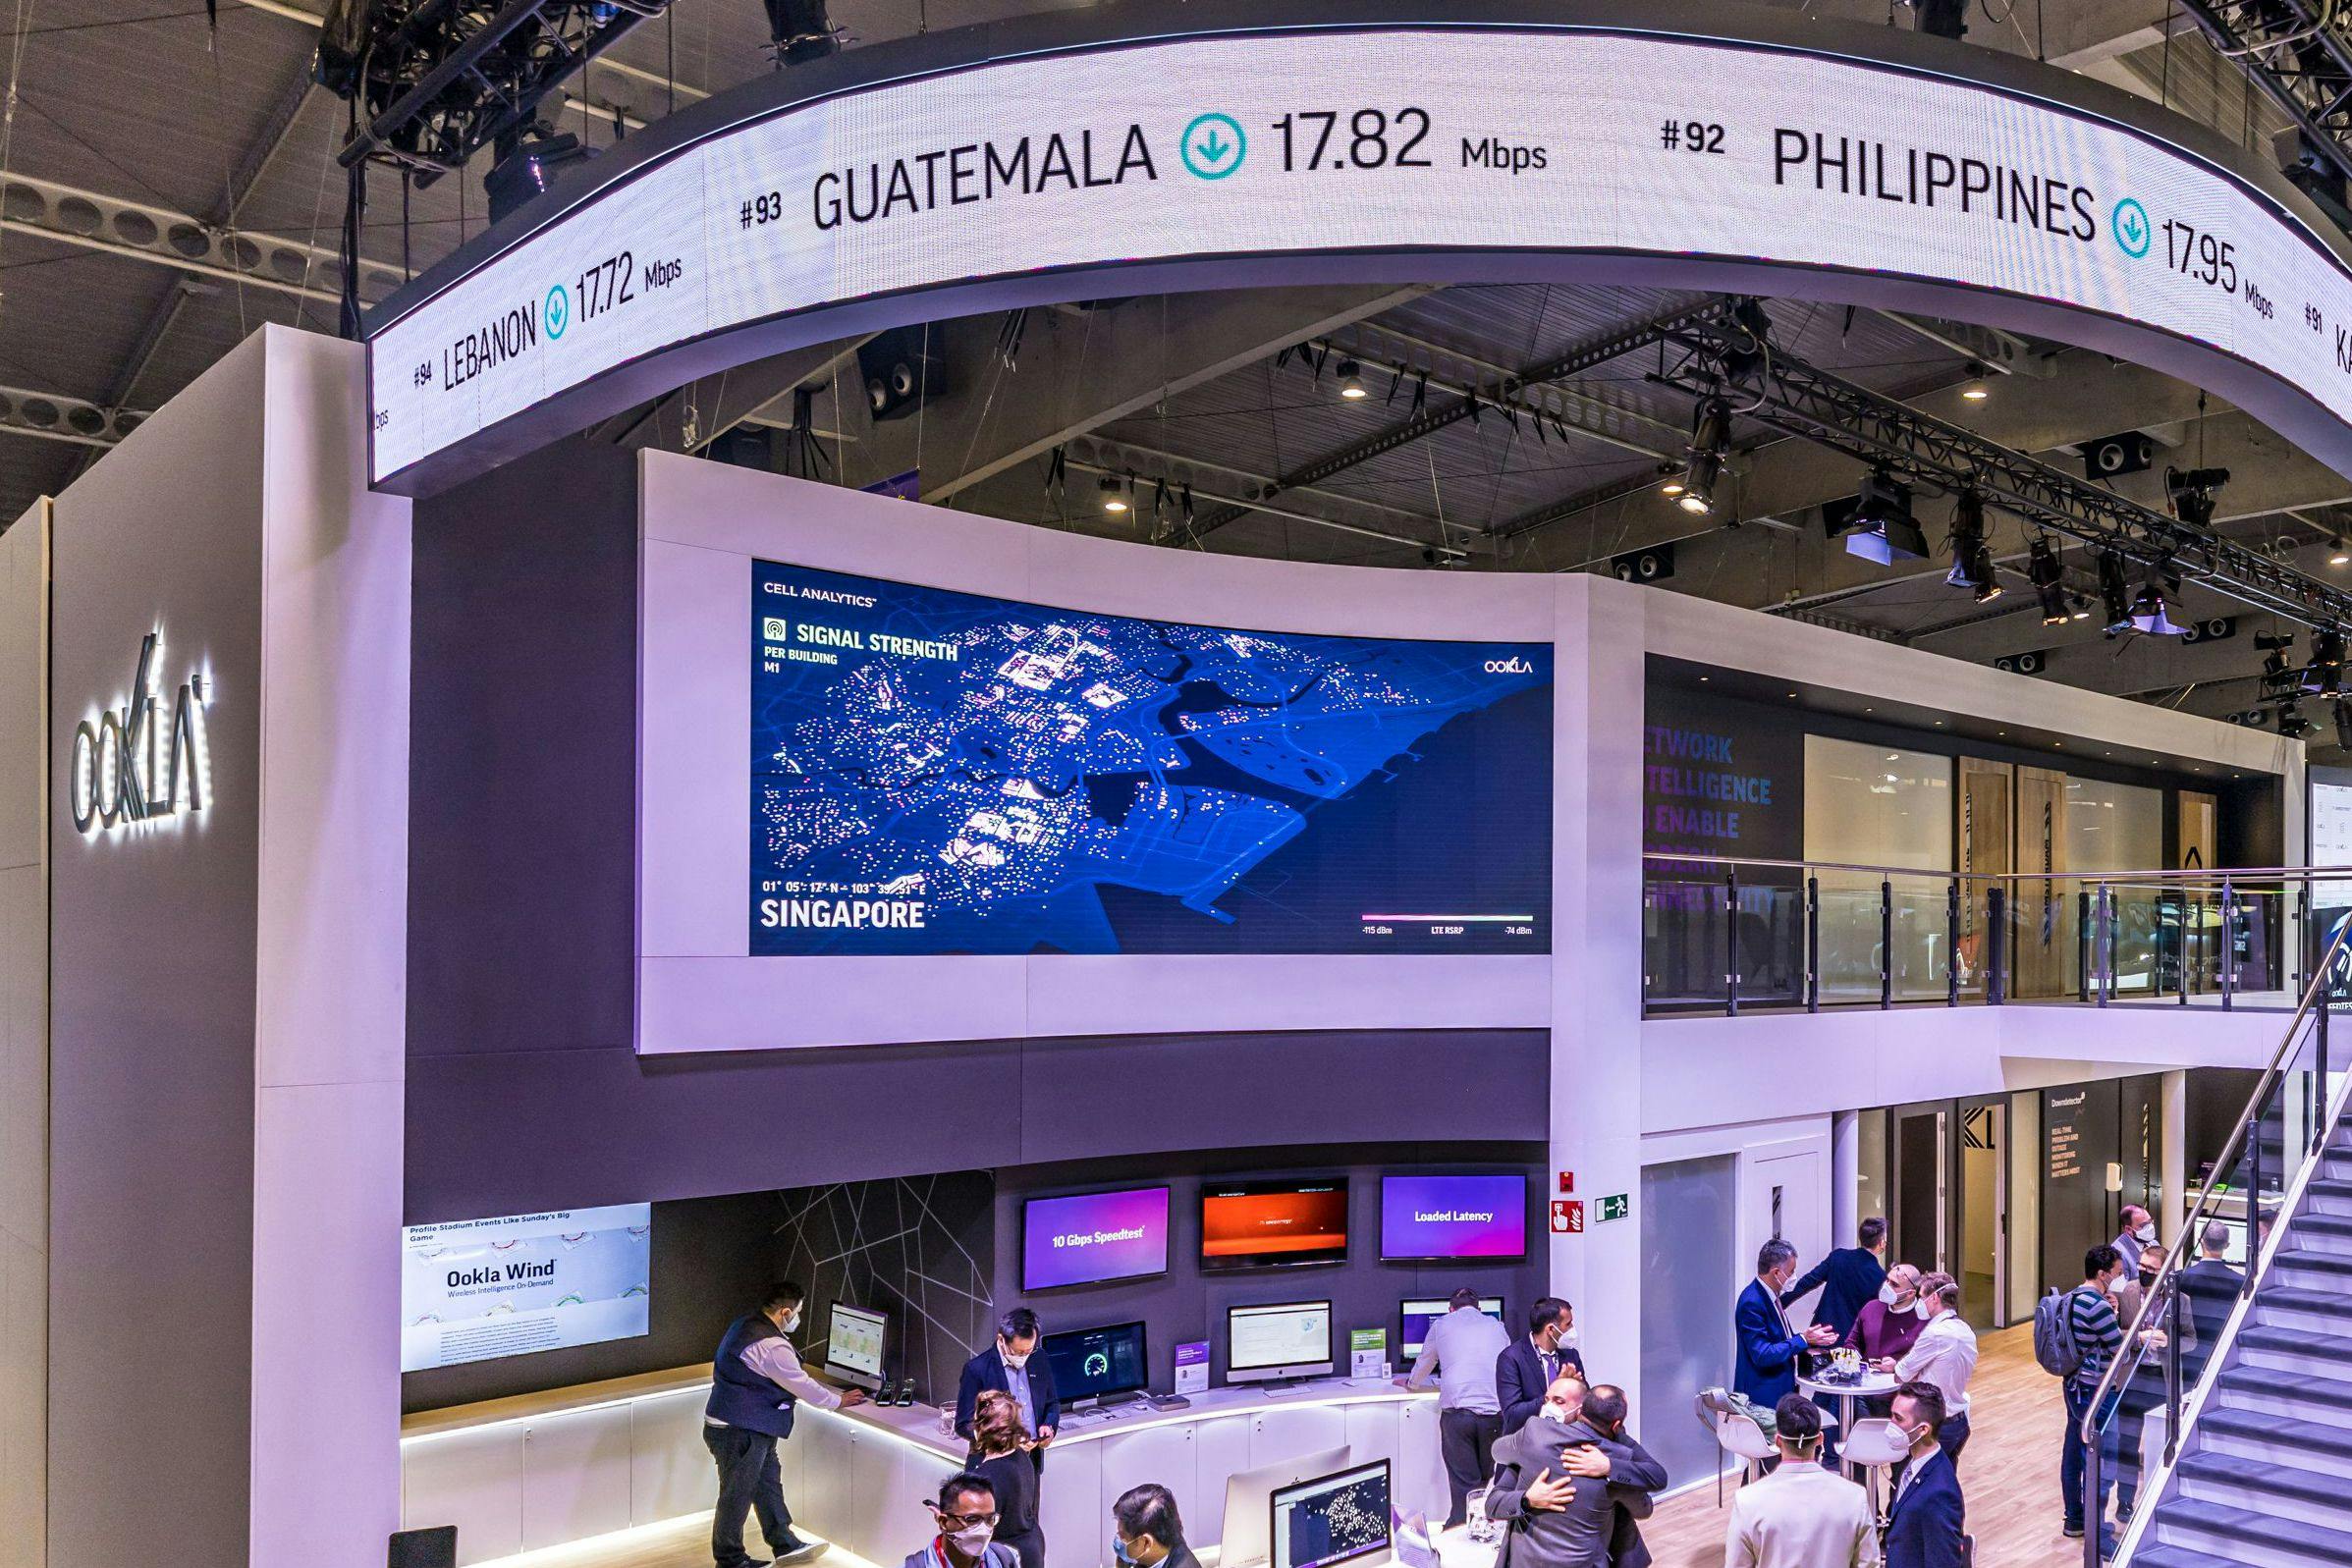
The depth and breadth of data from Ookla’s main products are at the core of their global market position. This data is normally only available in proprietary applications that require expert knowledge to gain these insights. In order to gain more leads during the Mobile World Congress (MWC), their data quality needed to be presented in a more accessible and eye-catching way.
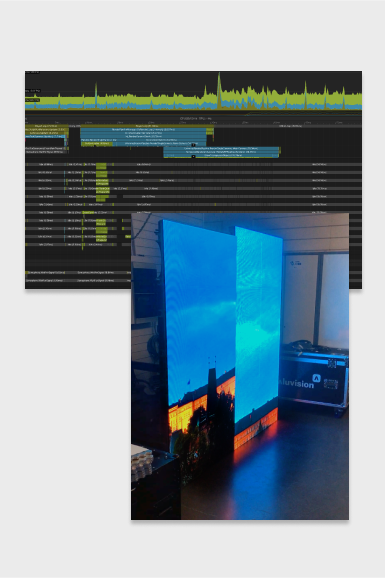
The MWC in Barcelona is the world’s largest and most influential connectivity event, hosting over 61,000 attendees from almost 200 countries during the 2022 edition. A large curved LED display at the entrance of their massive booth, was appointed as the canvas for their product data visualizations.
Projectkick-off
The project started with a kick-off workshop together with the Ookla team, during which we mutually shared our ideas & goals, explored visual directions and discussed the technical and practical boundaries of the project.
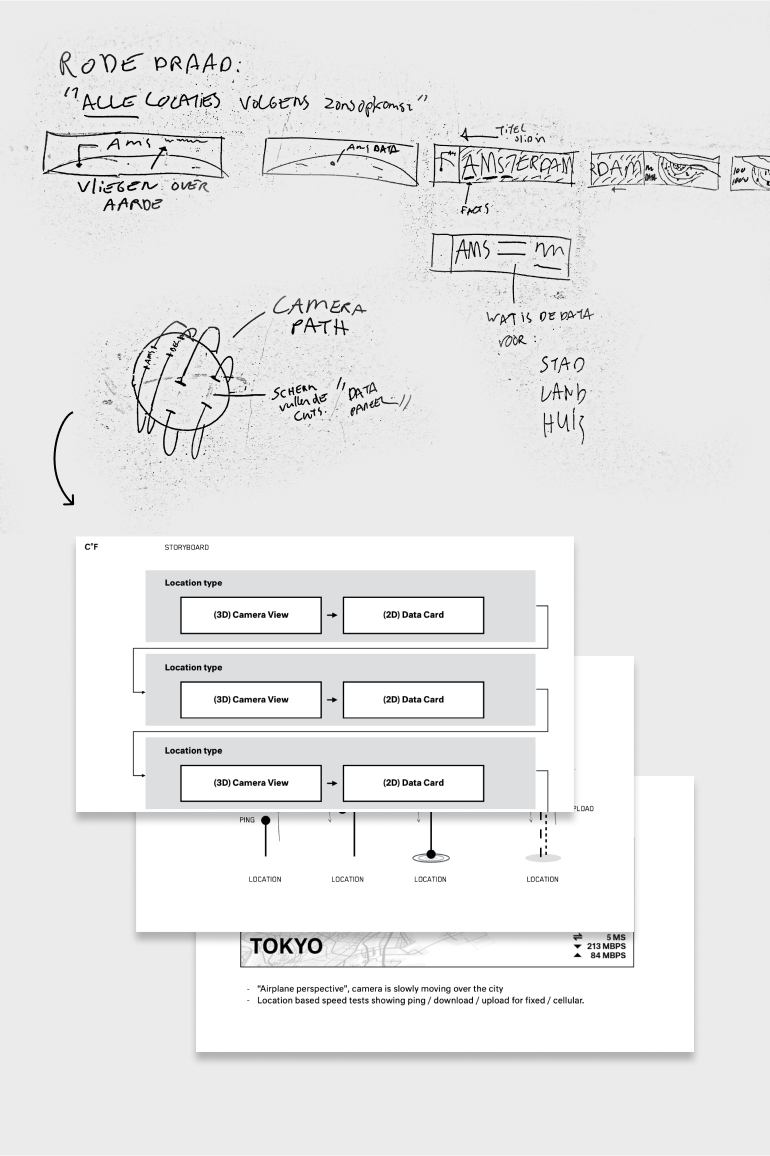
Storyboarding
Based on the provided data and the strategic desires that came from the kick-off workshop, we started sketching storyboards that eventually shaped the storyline.
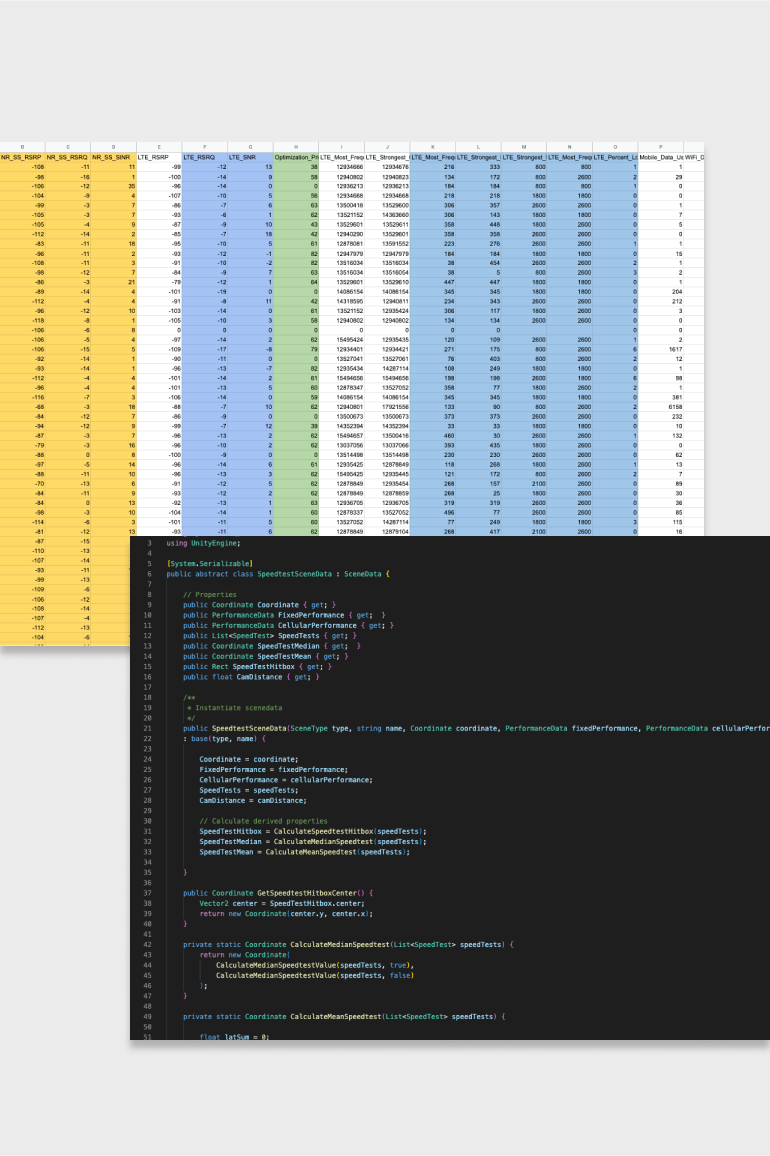
Datapreparationandanalysis
All provided data was processed and prepared so it could be used in our technical setup. Furthermore, we did basic data analysis to validate our storylines and to identify any anomalies.
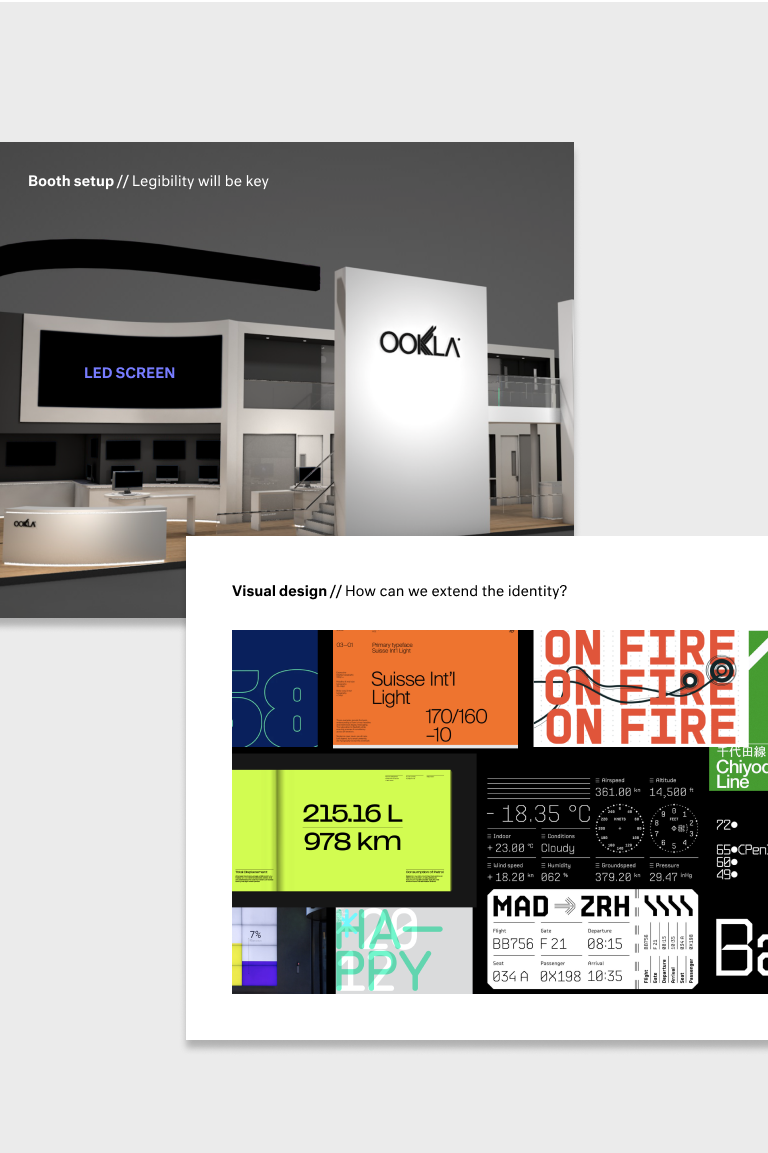
Technicaltesting
To ensure feasibility we were continuously testing our concepts against the technical limitations. Such as the legibility of text while shown on the LED displays and the 3D software performance.
Phases and toolkit items used
Design
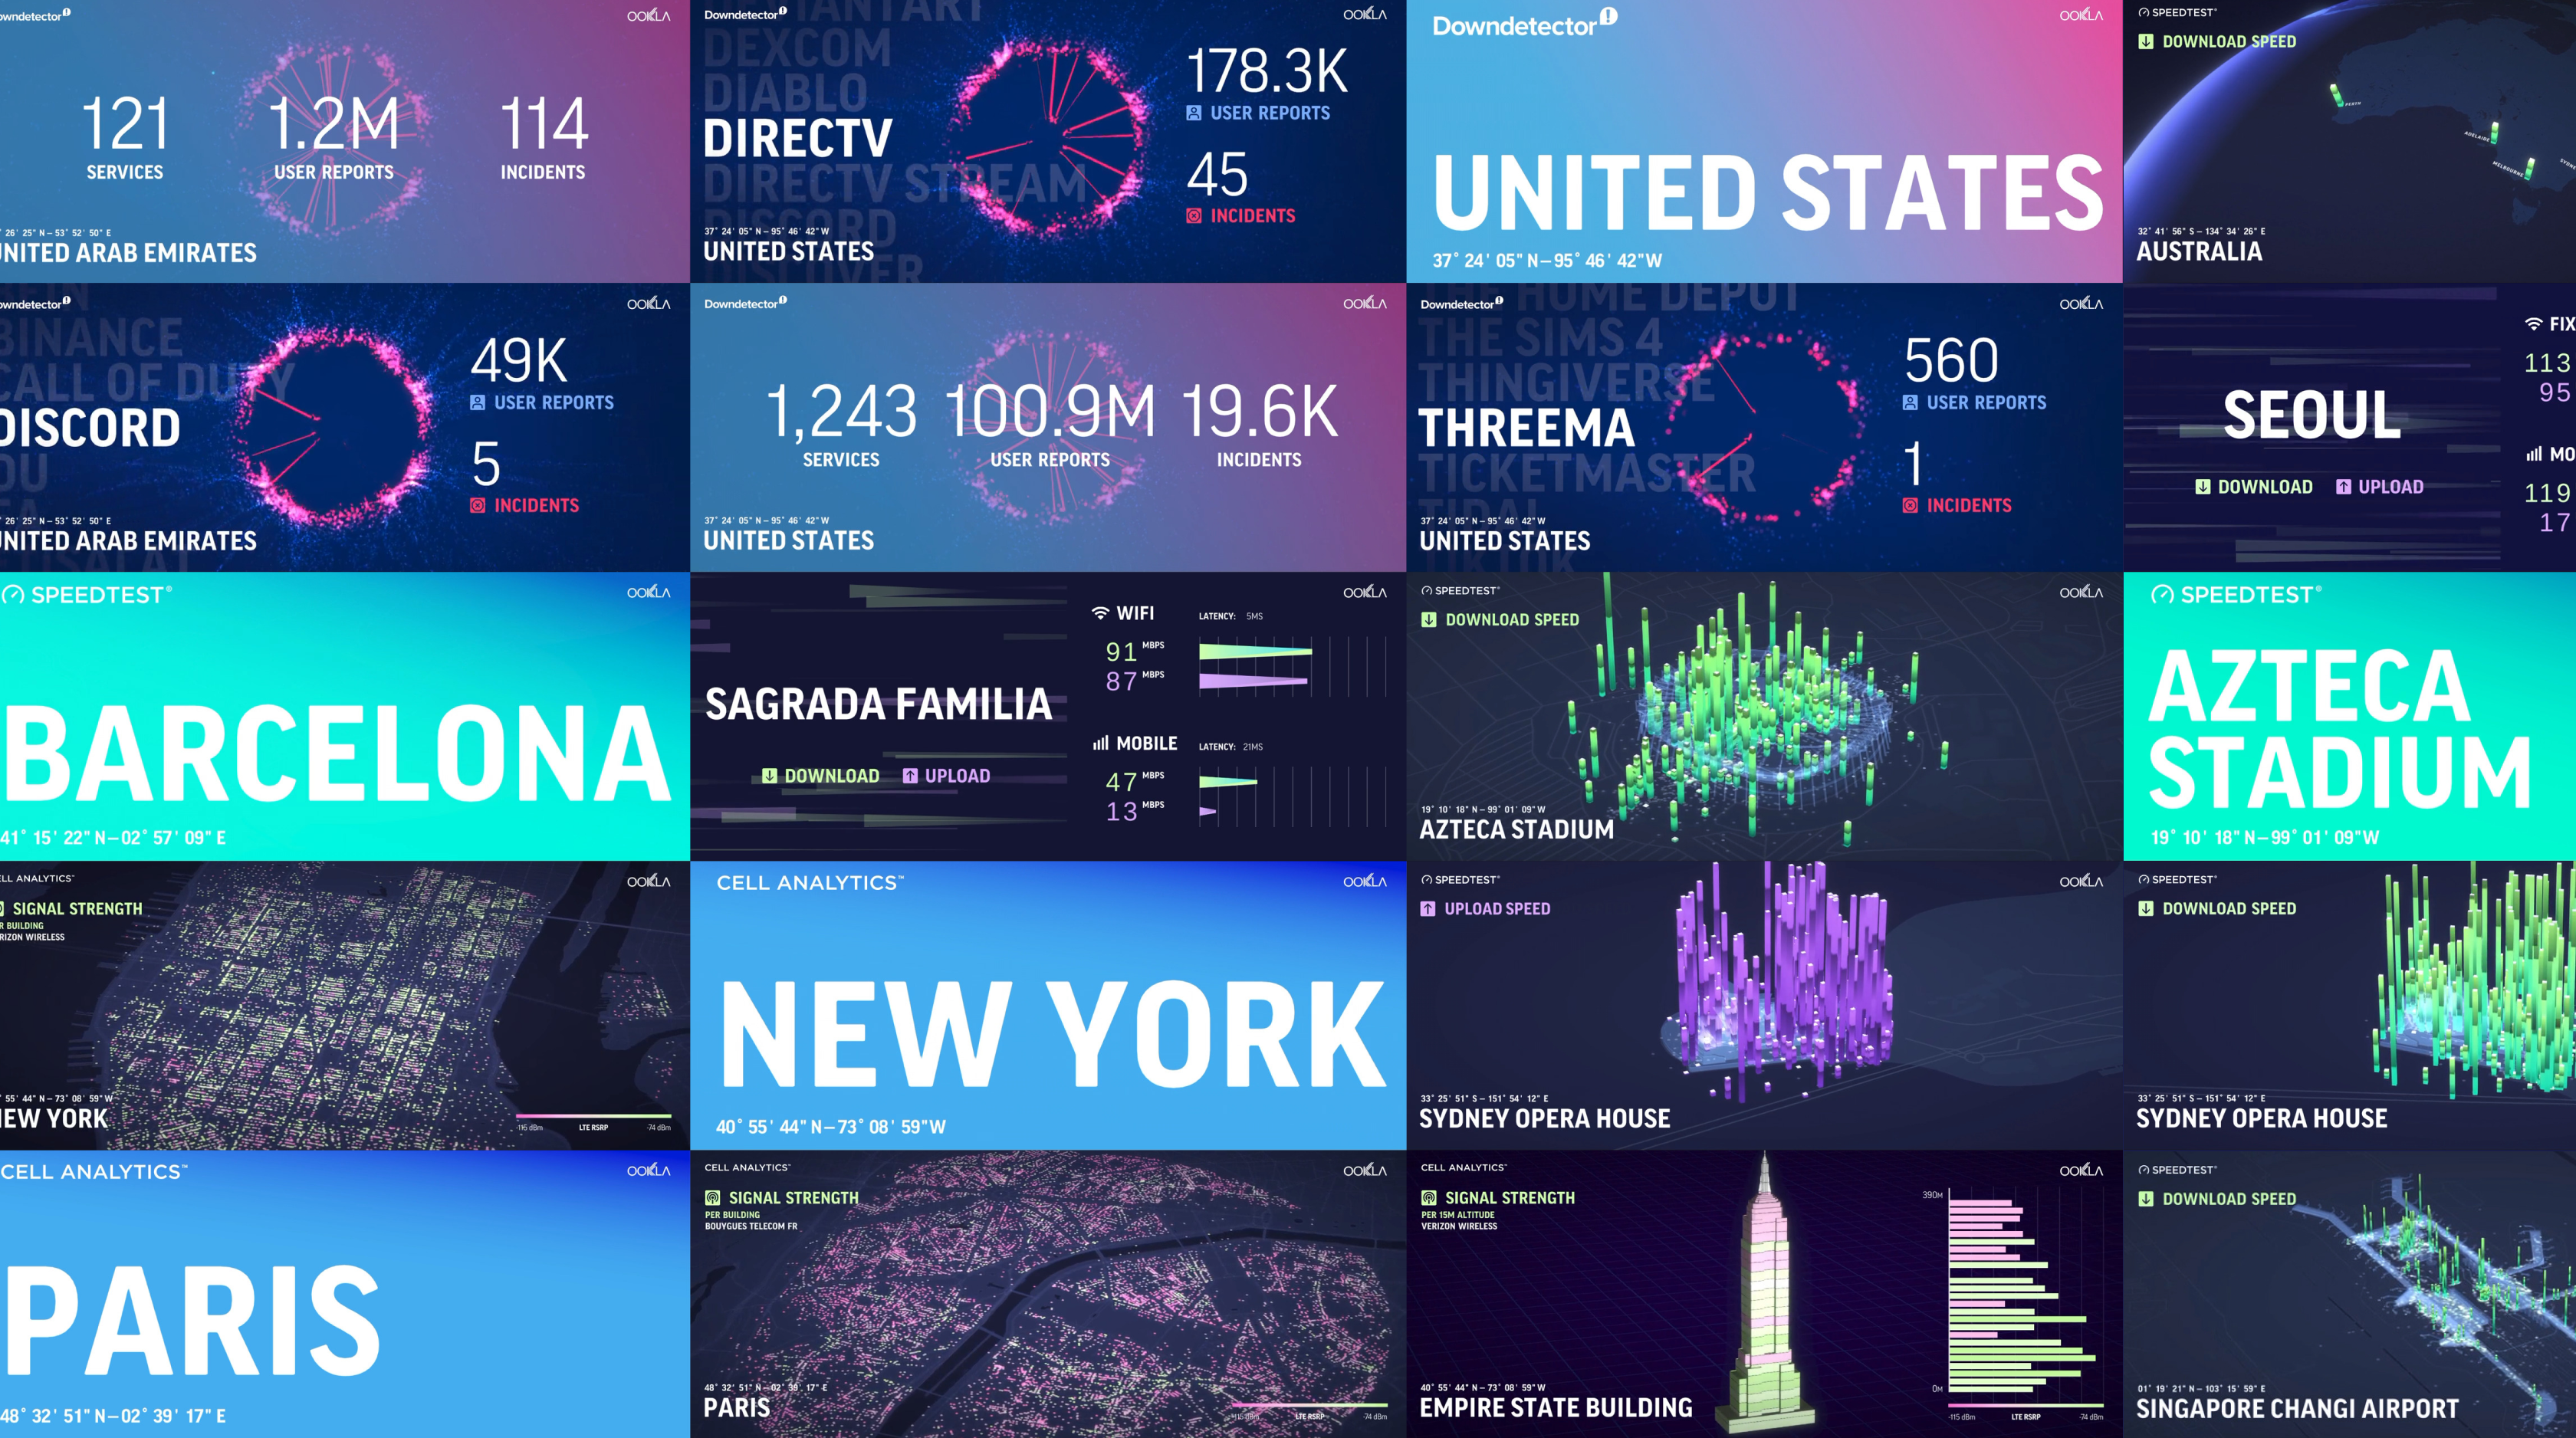
Based on the existing Ookla branding we created an extension of their identity, to create a slightly different visual language of the visualizations that were aimed to bring the data more forward.
The 3D scenes were inspired by the spectacular mid-air views you usually get from different types of aircraft. This perspective-driven types approach resulted in visualizations with a cinematic ambience while maintaining its informative character.
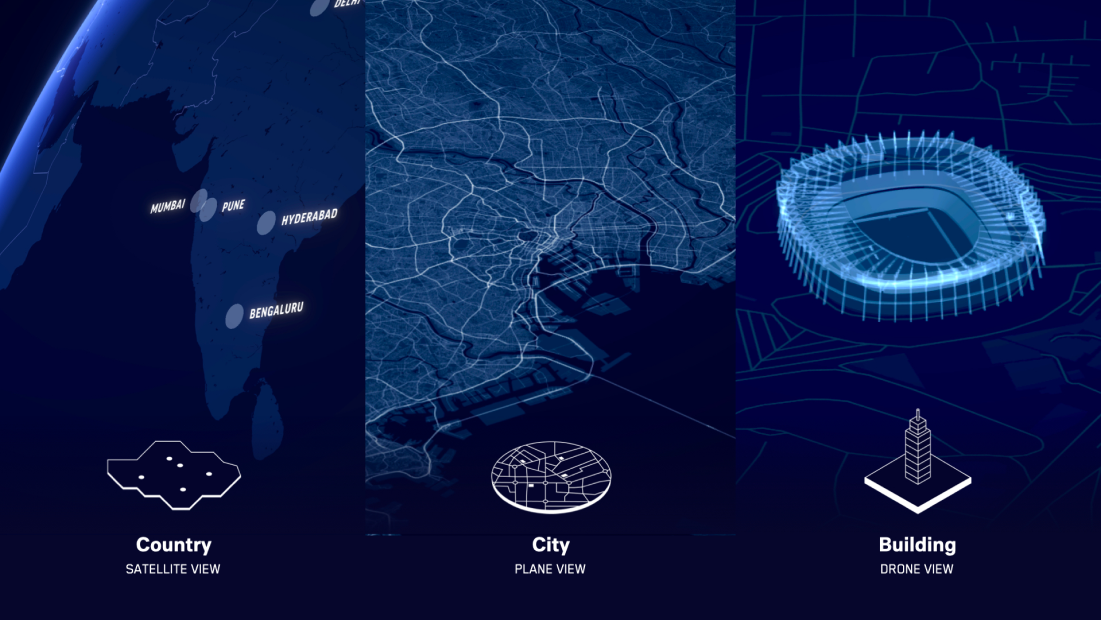
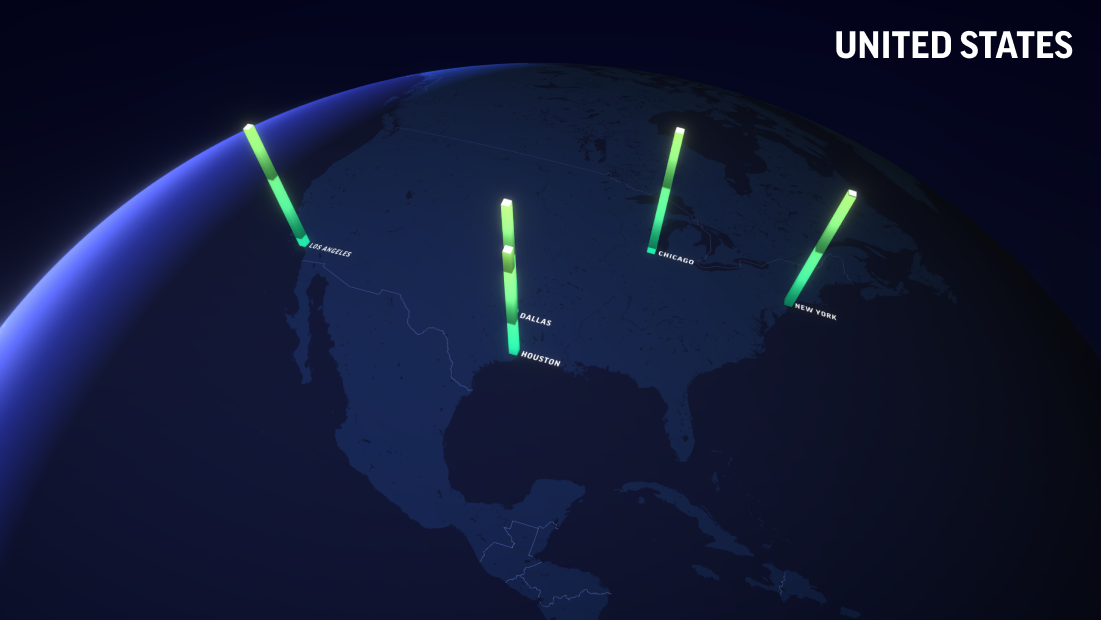
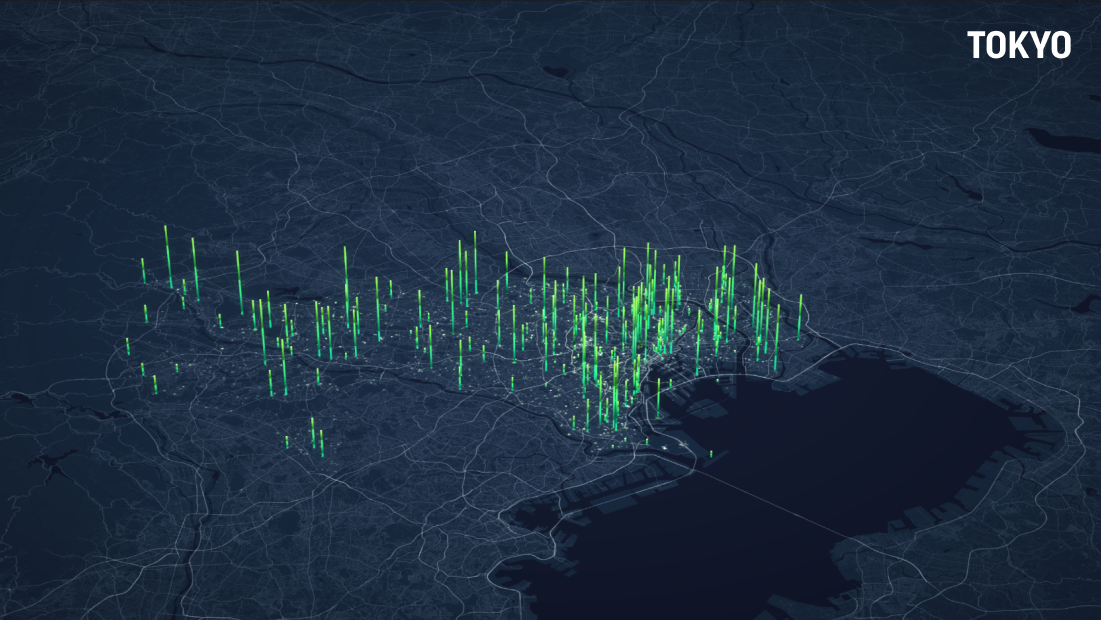
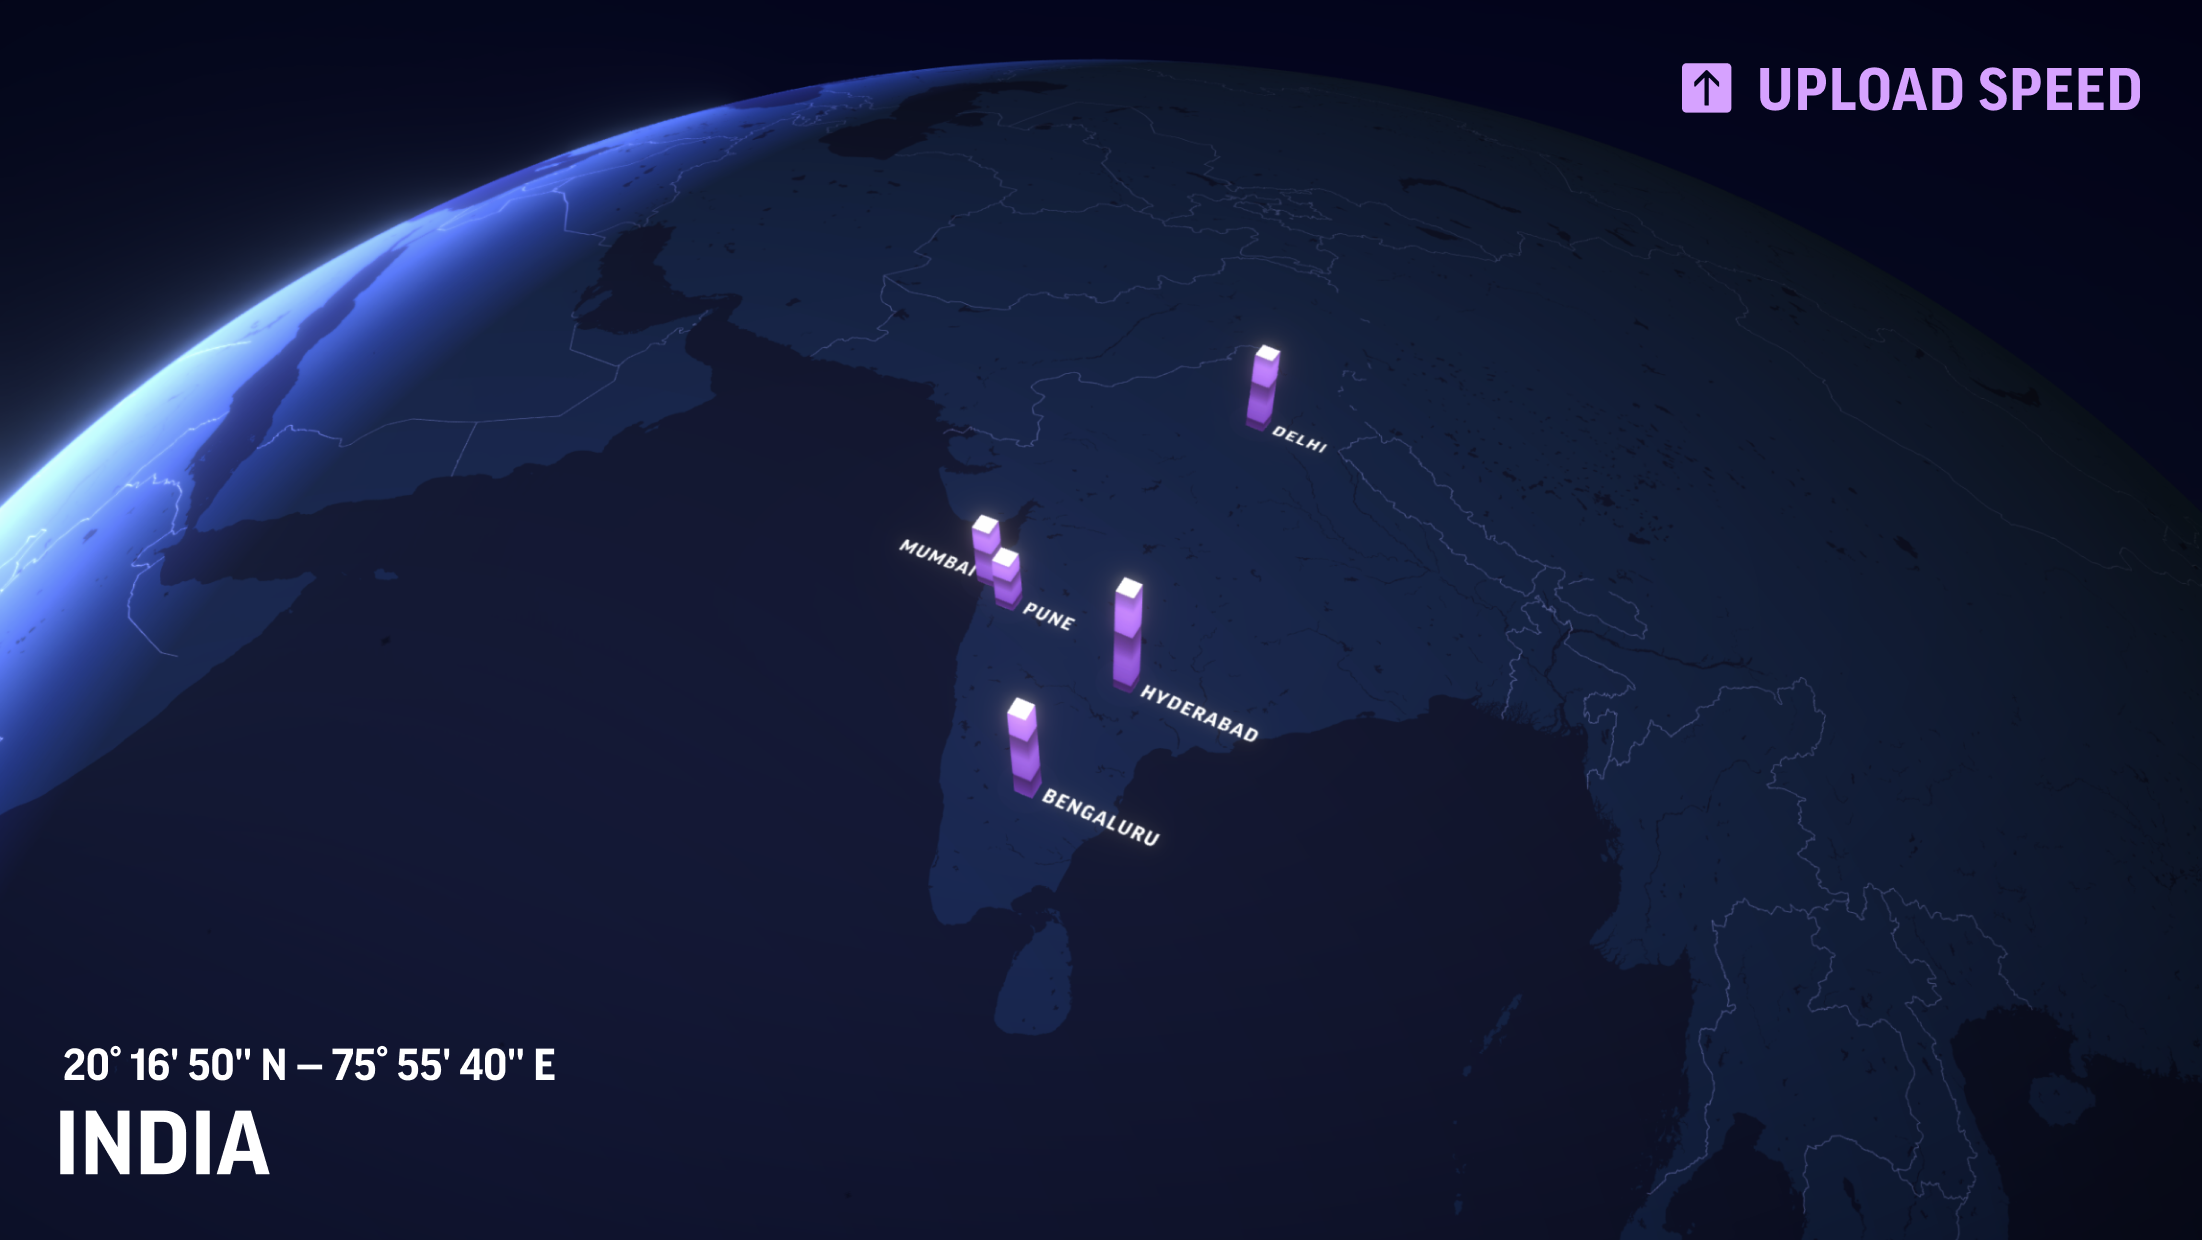
Geographicalzoomlevels
The data from their core products was mainly focused around three geographical zoom levels; country, city, and building level.
To emphasize these levels, the visualizations were based on three different camera perspectives, aiming to provide the visualizations with a cinematic ambience.
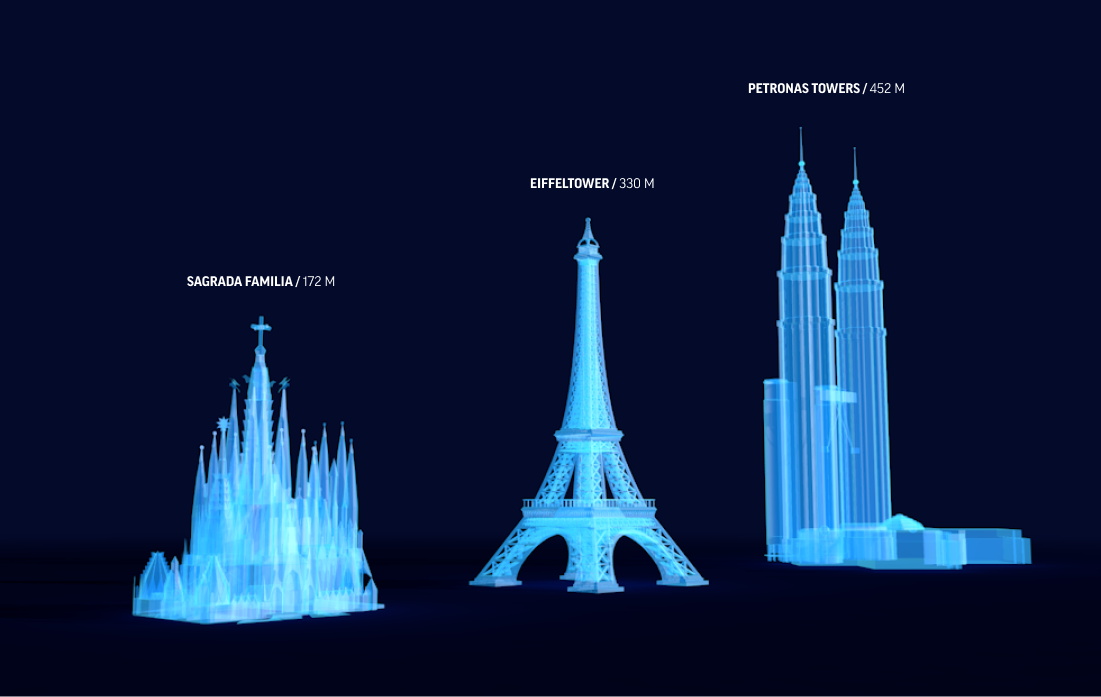
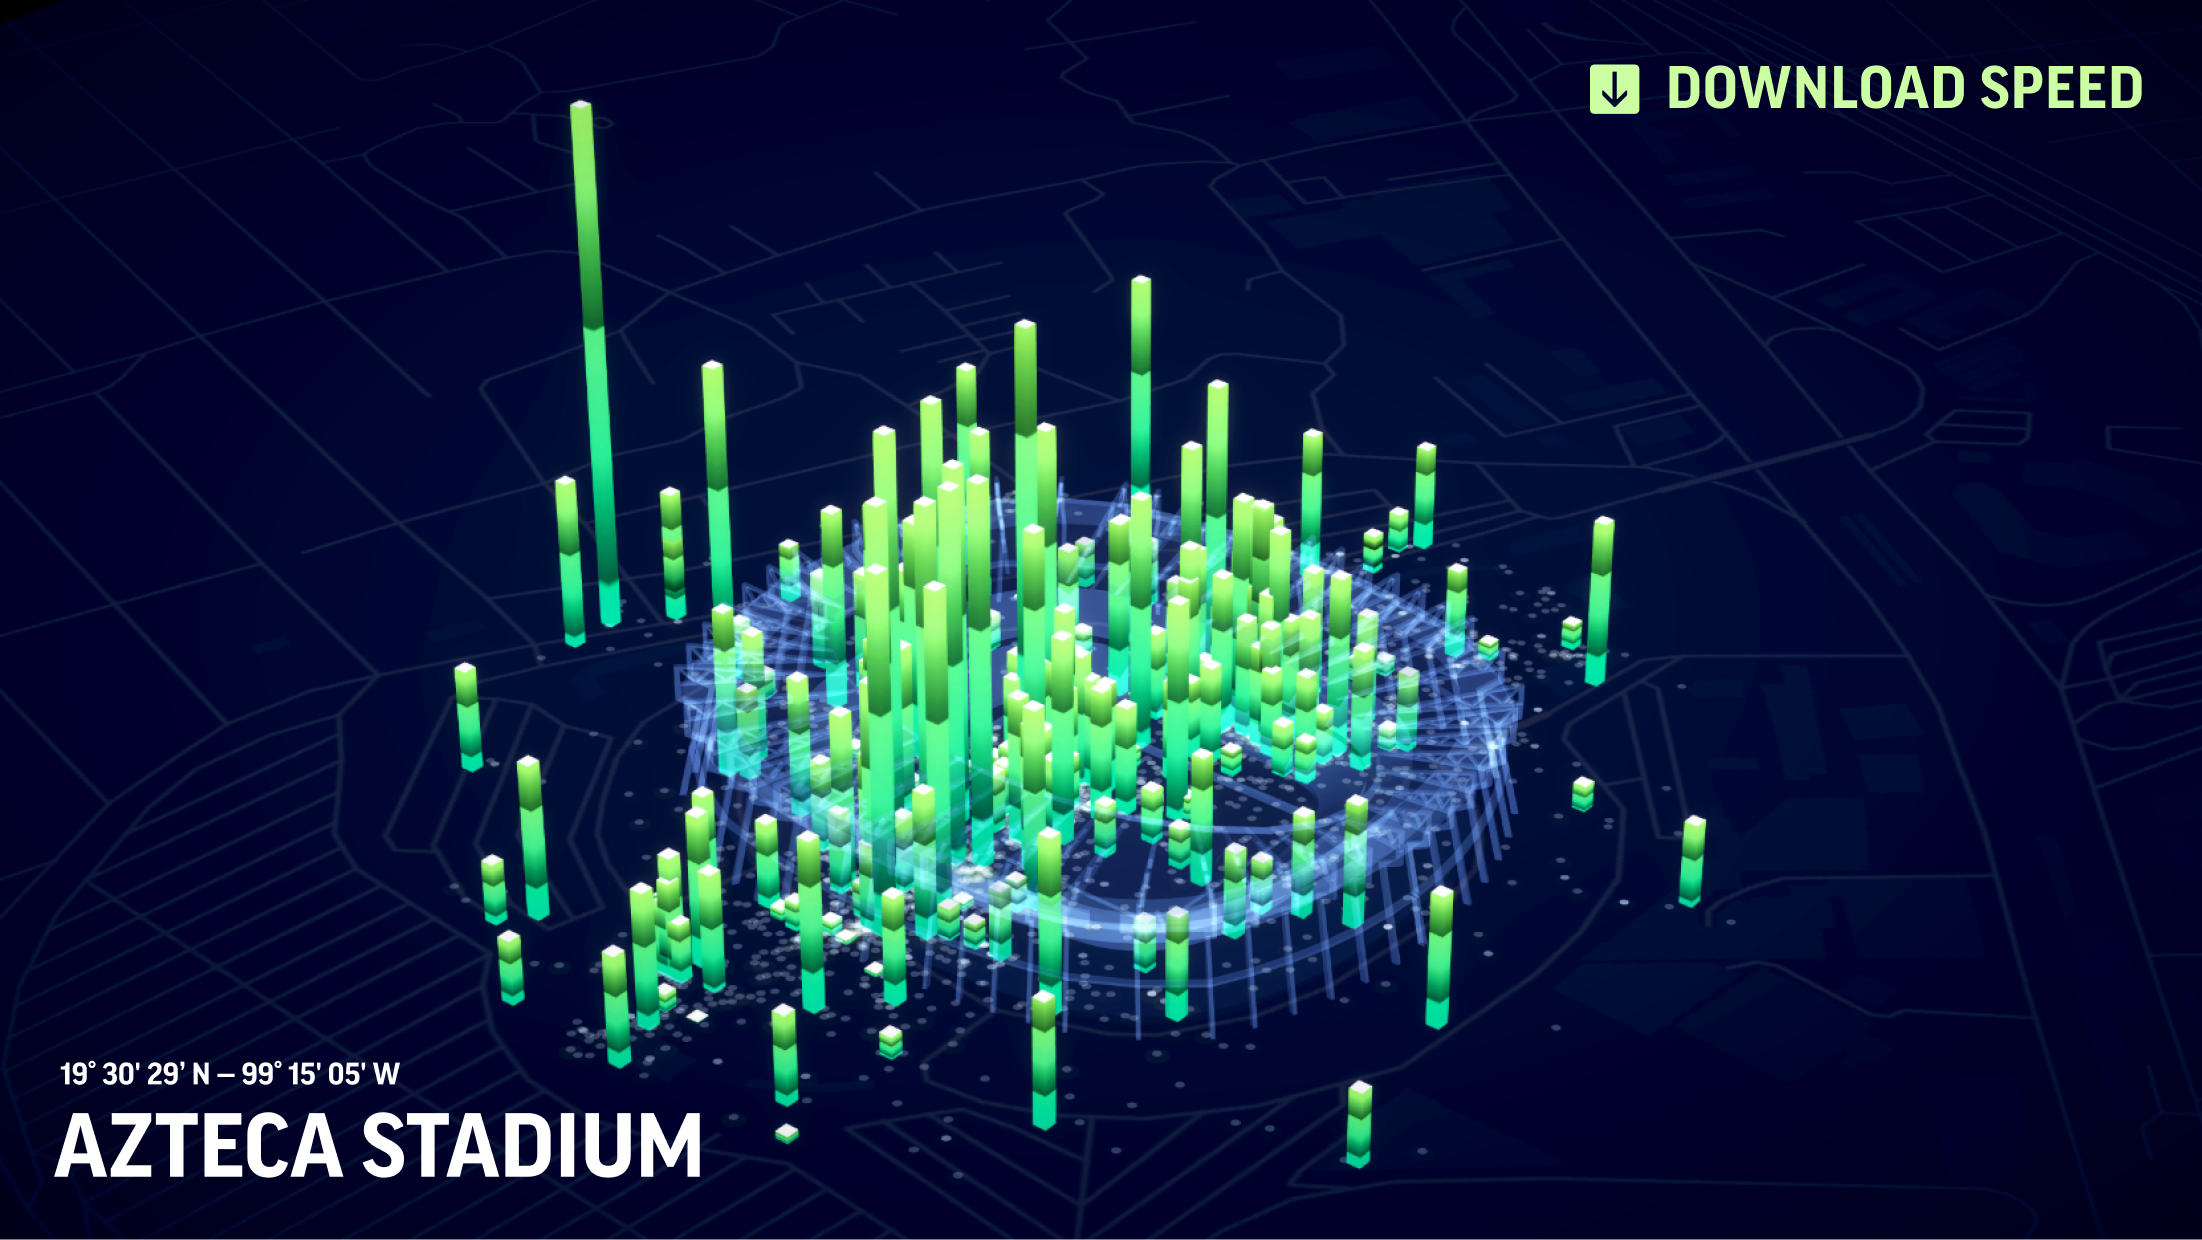
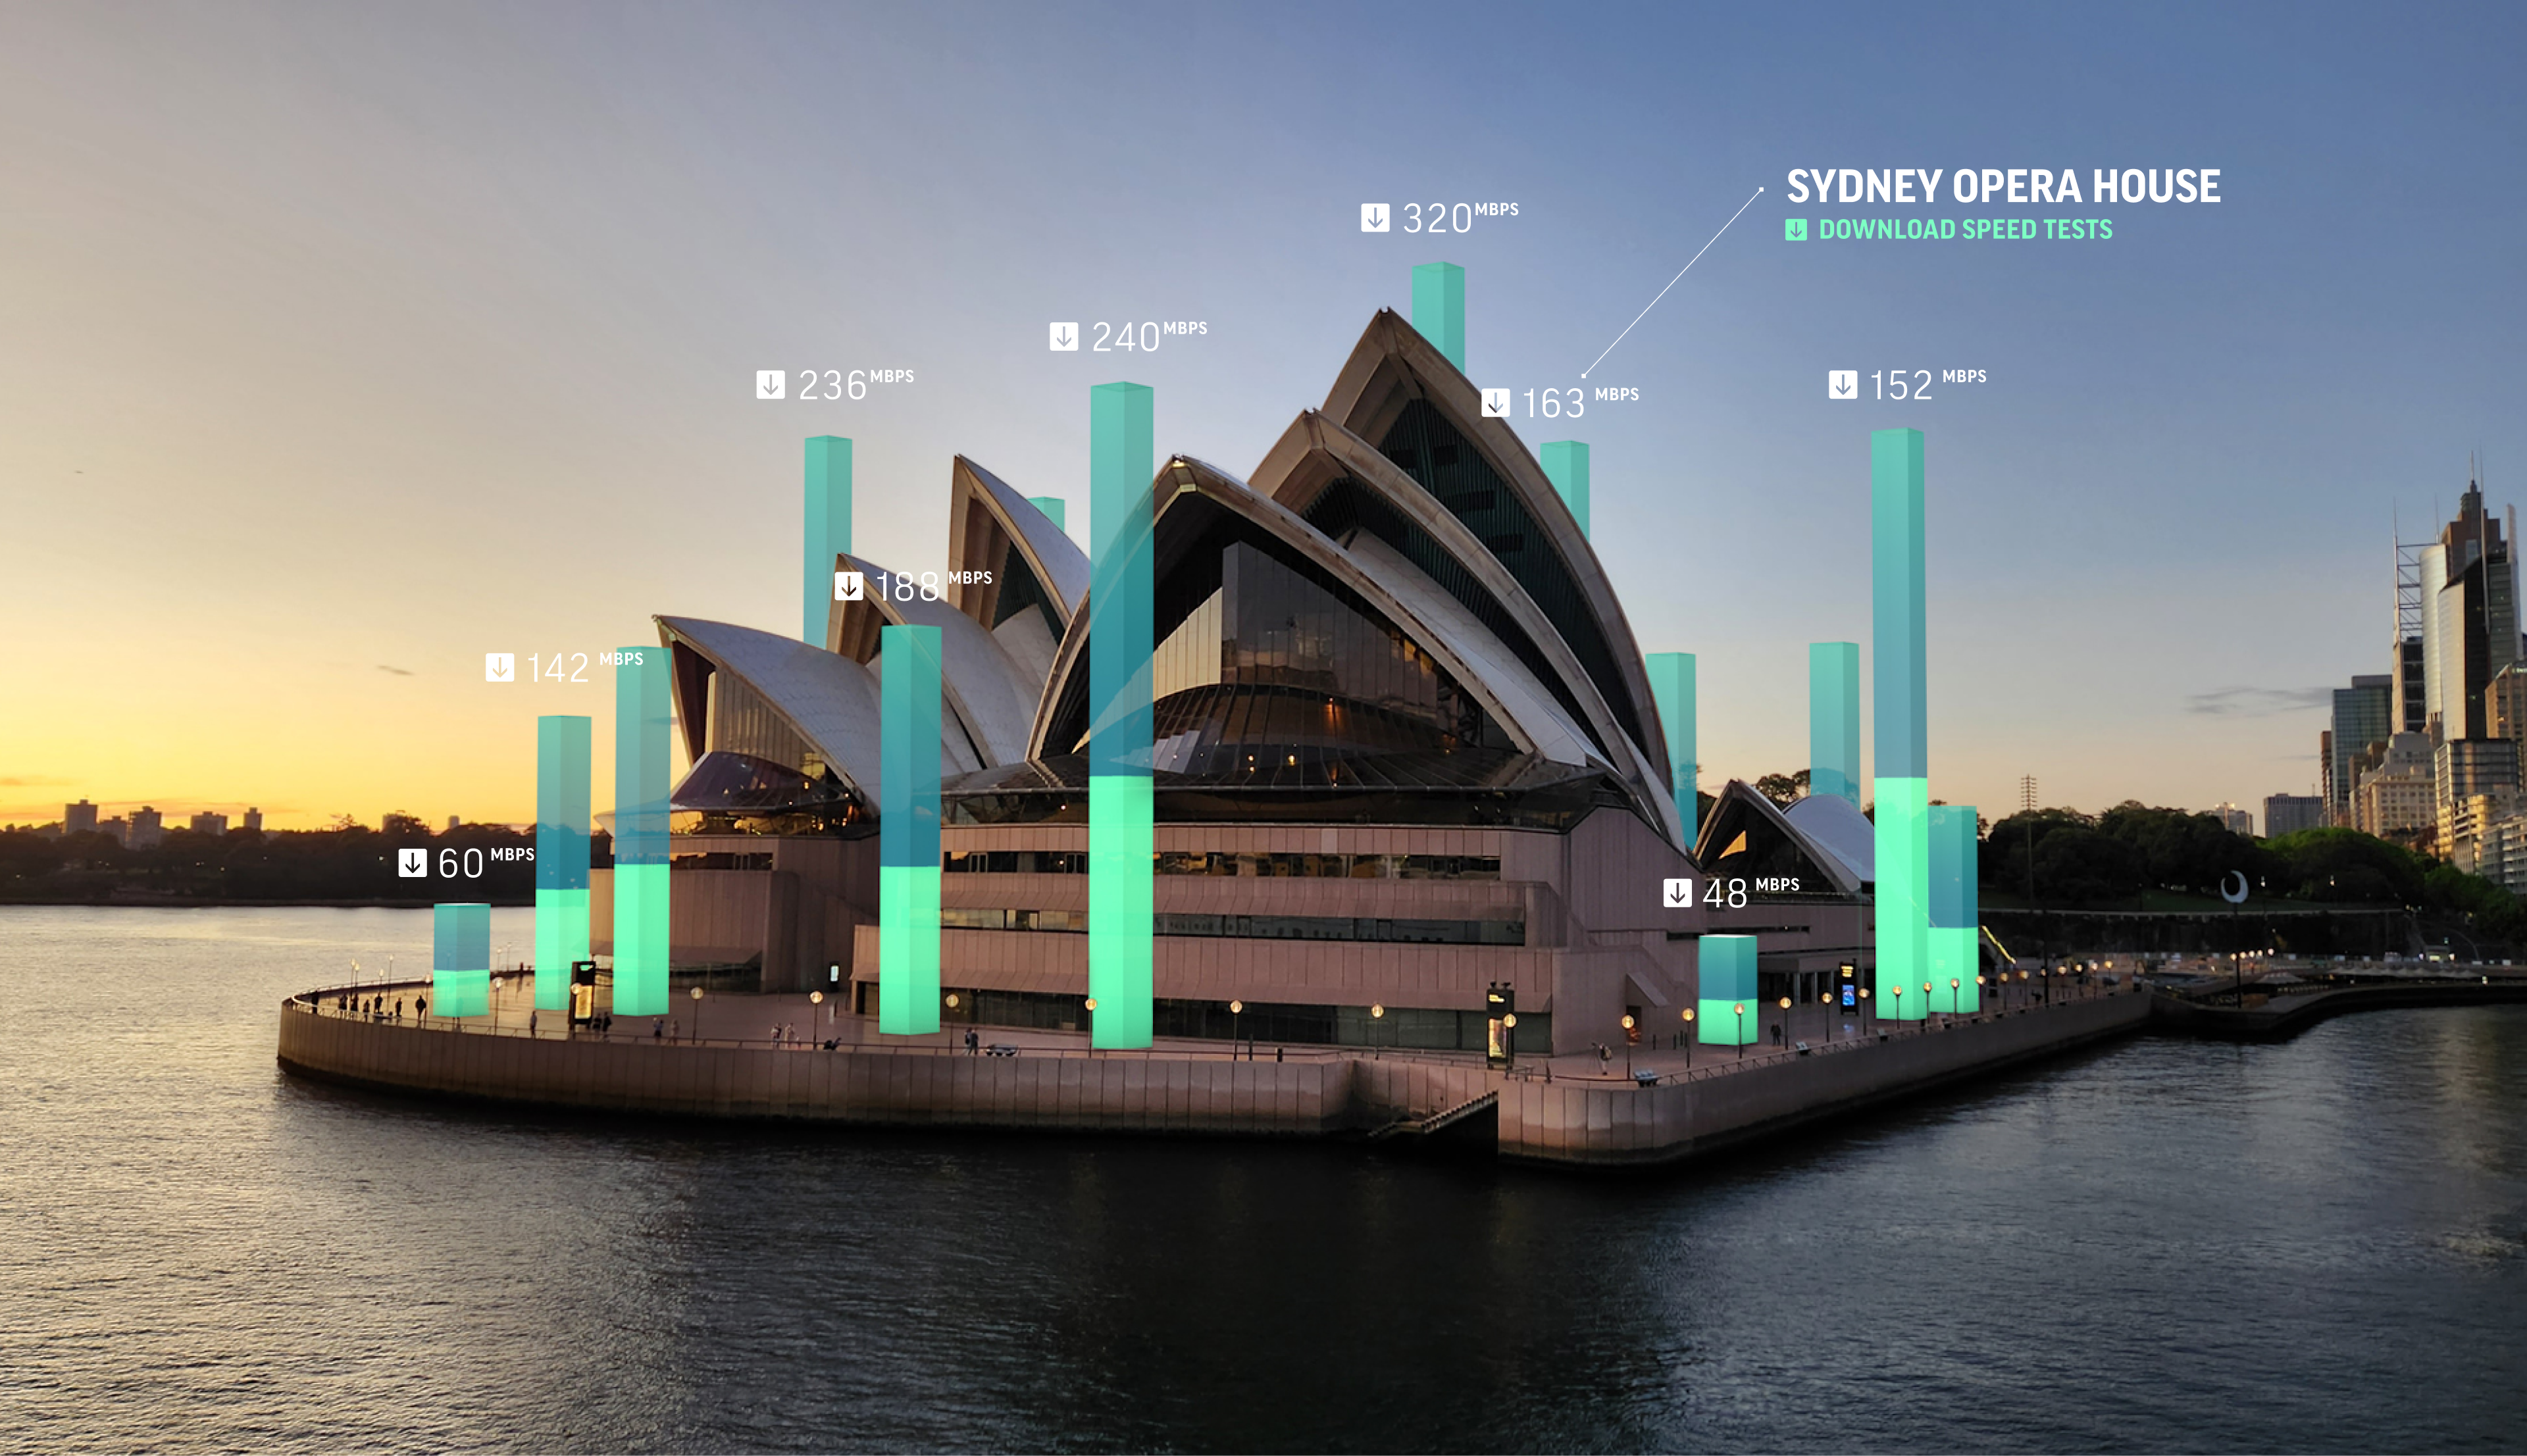
Iconiclandmarks
To demonstrate the incredible accuracy and resolution of their data, iconic landmarks were used as locations to showcase their data on higher zoom levels.
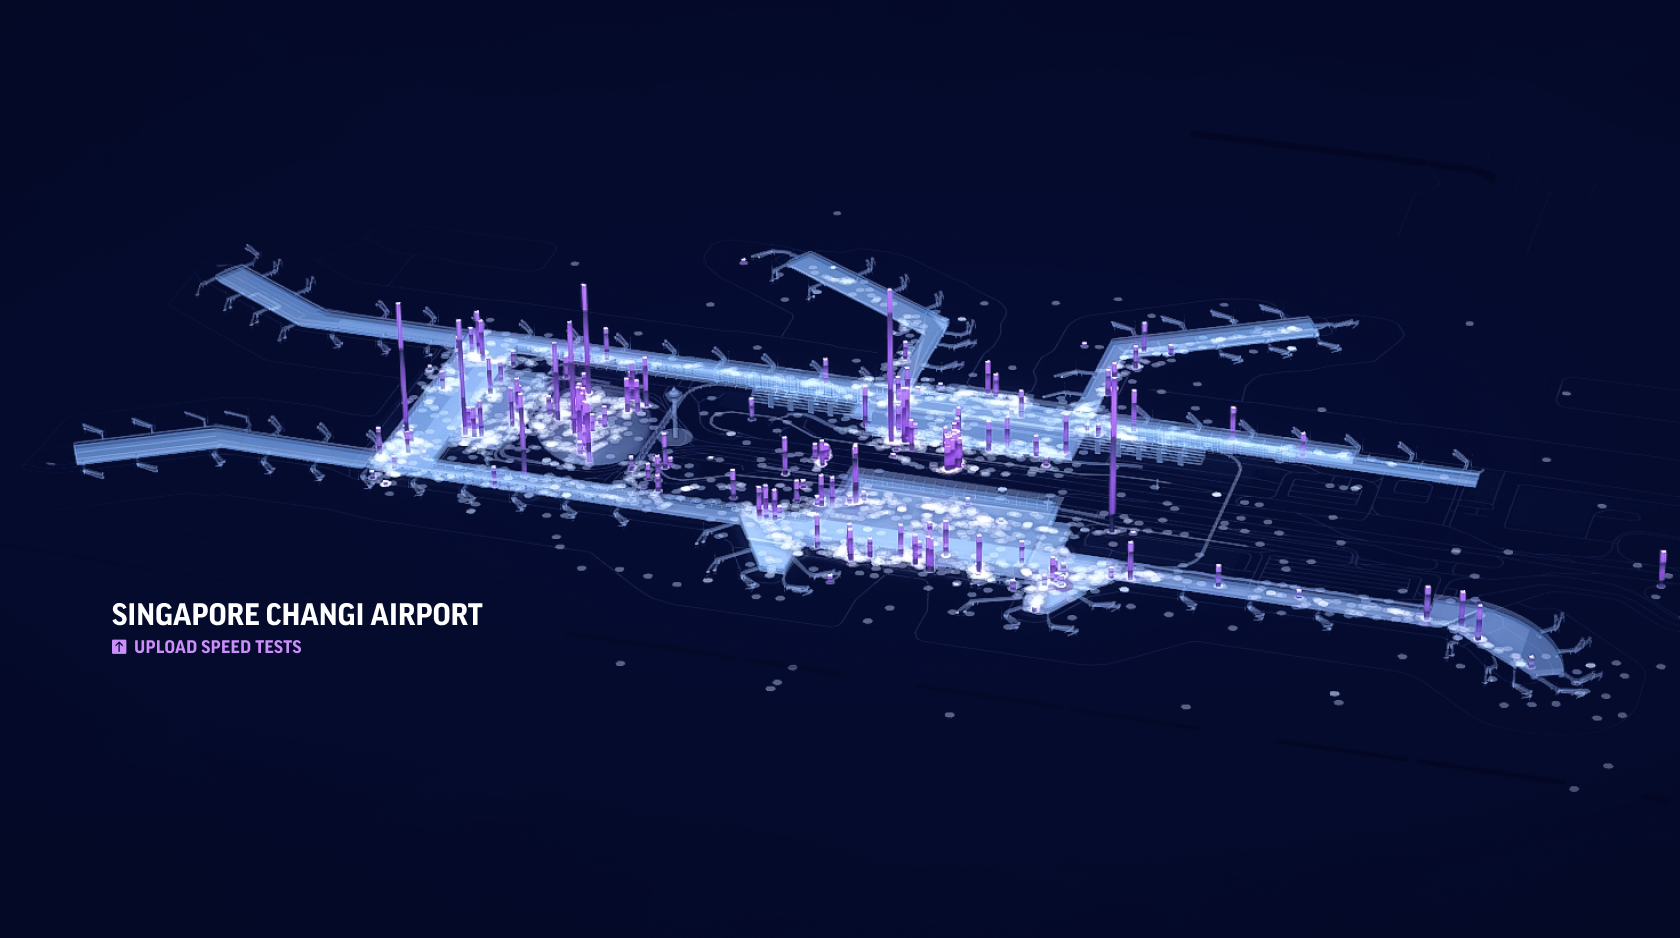
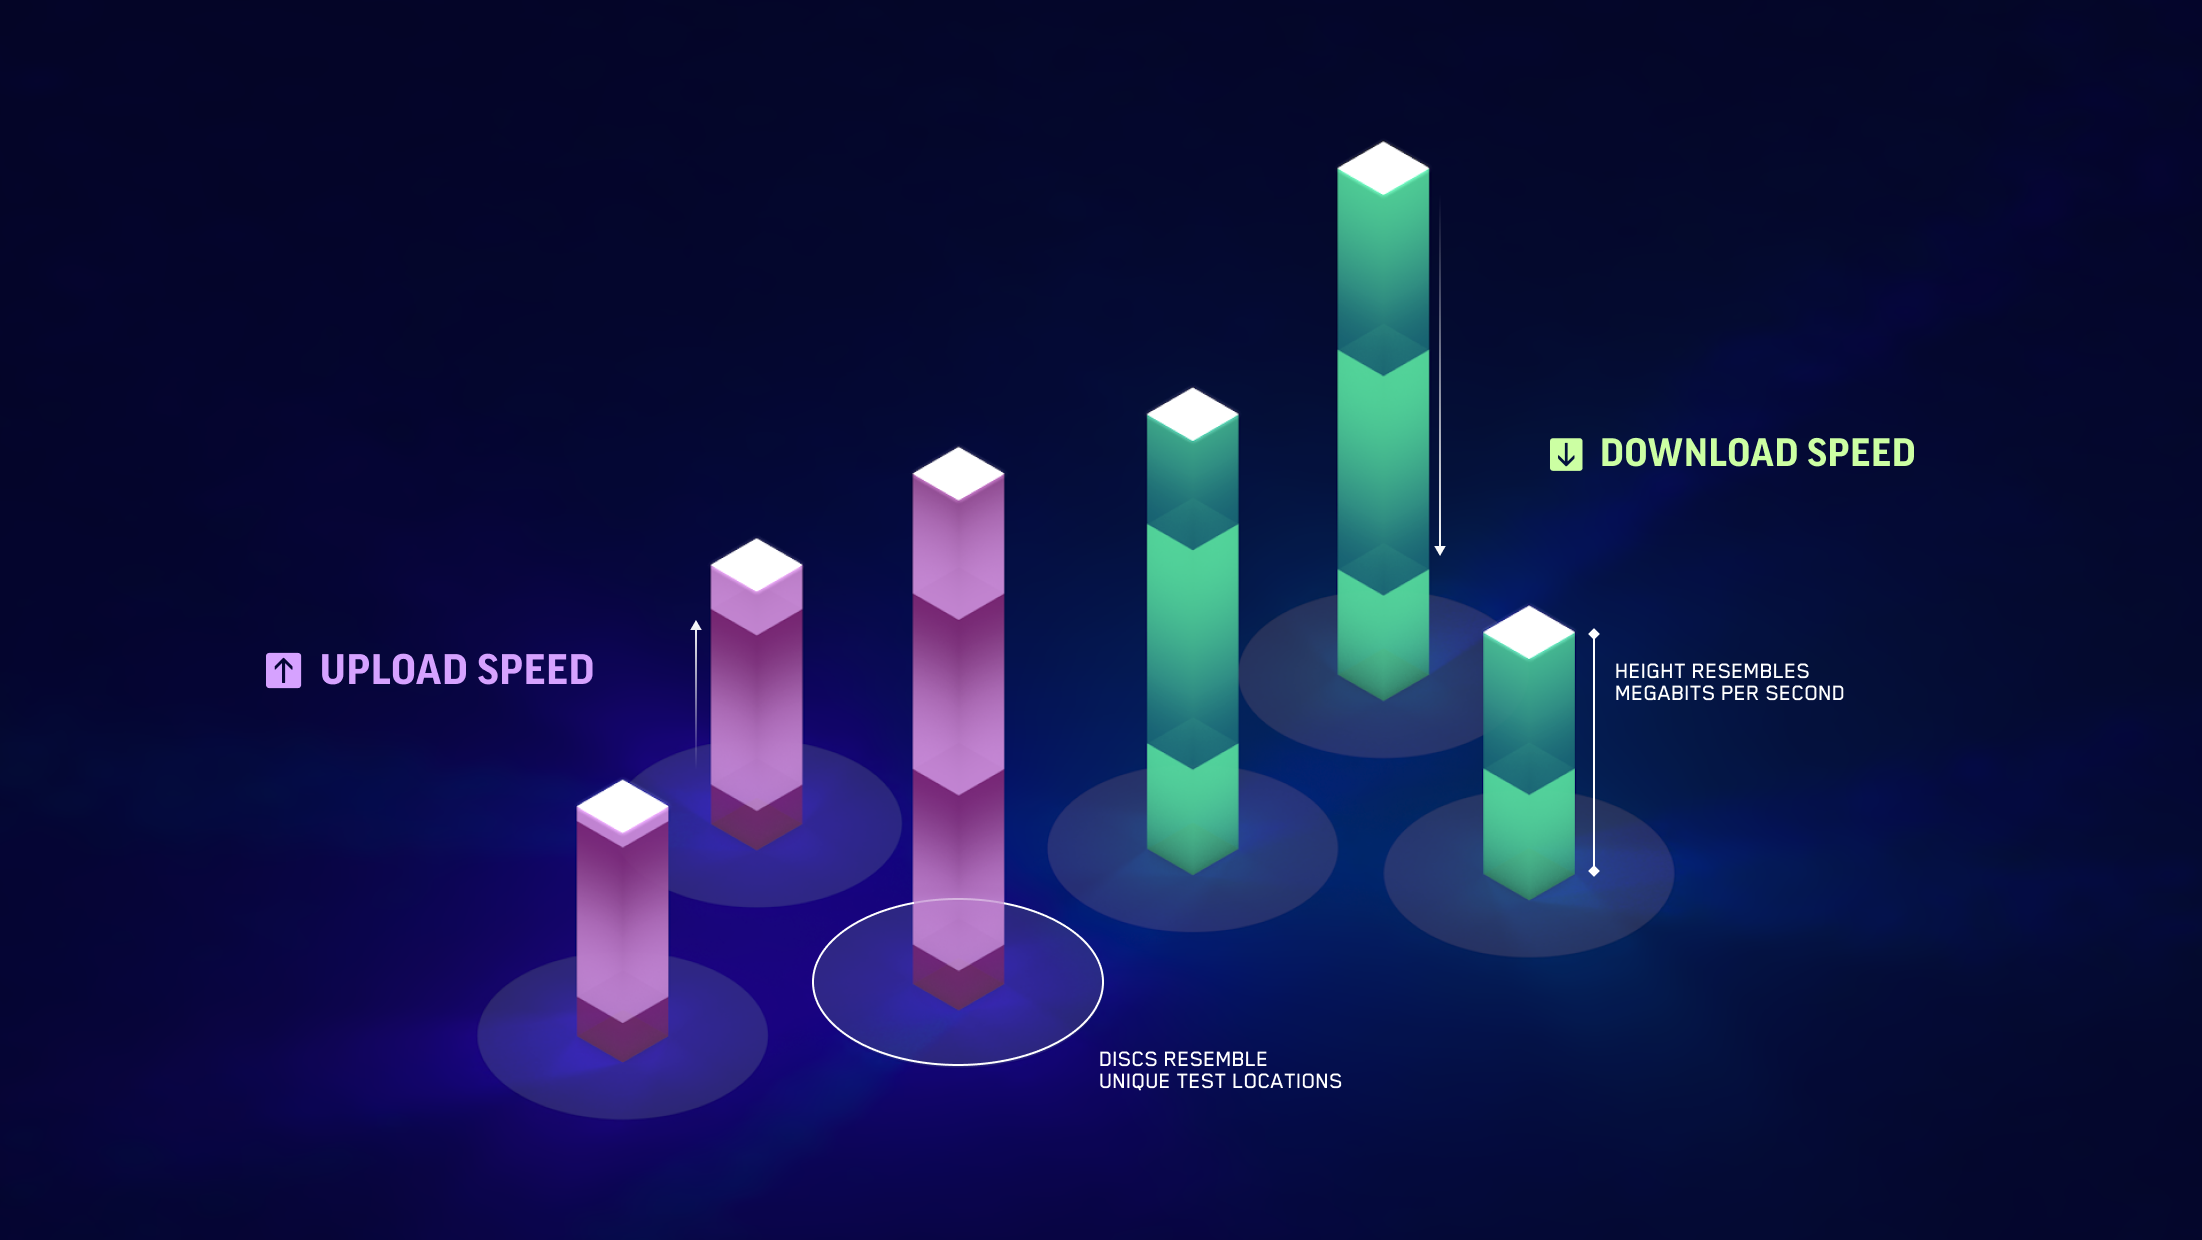
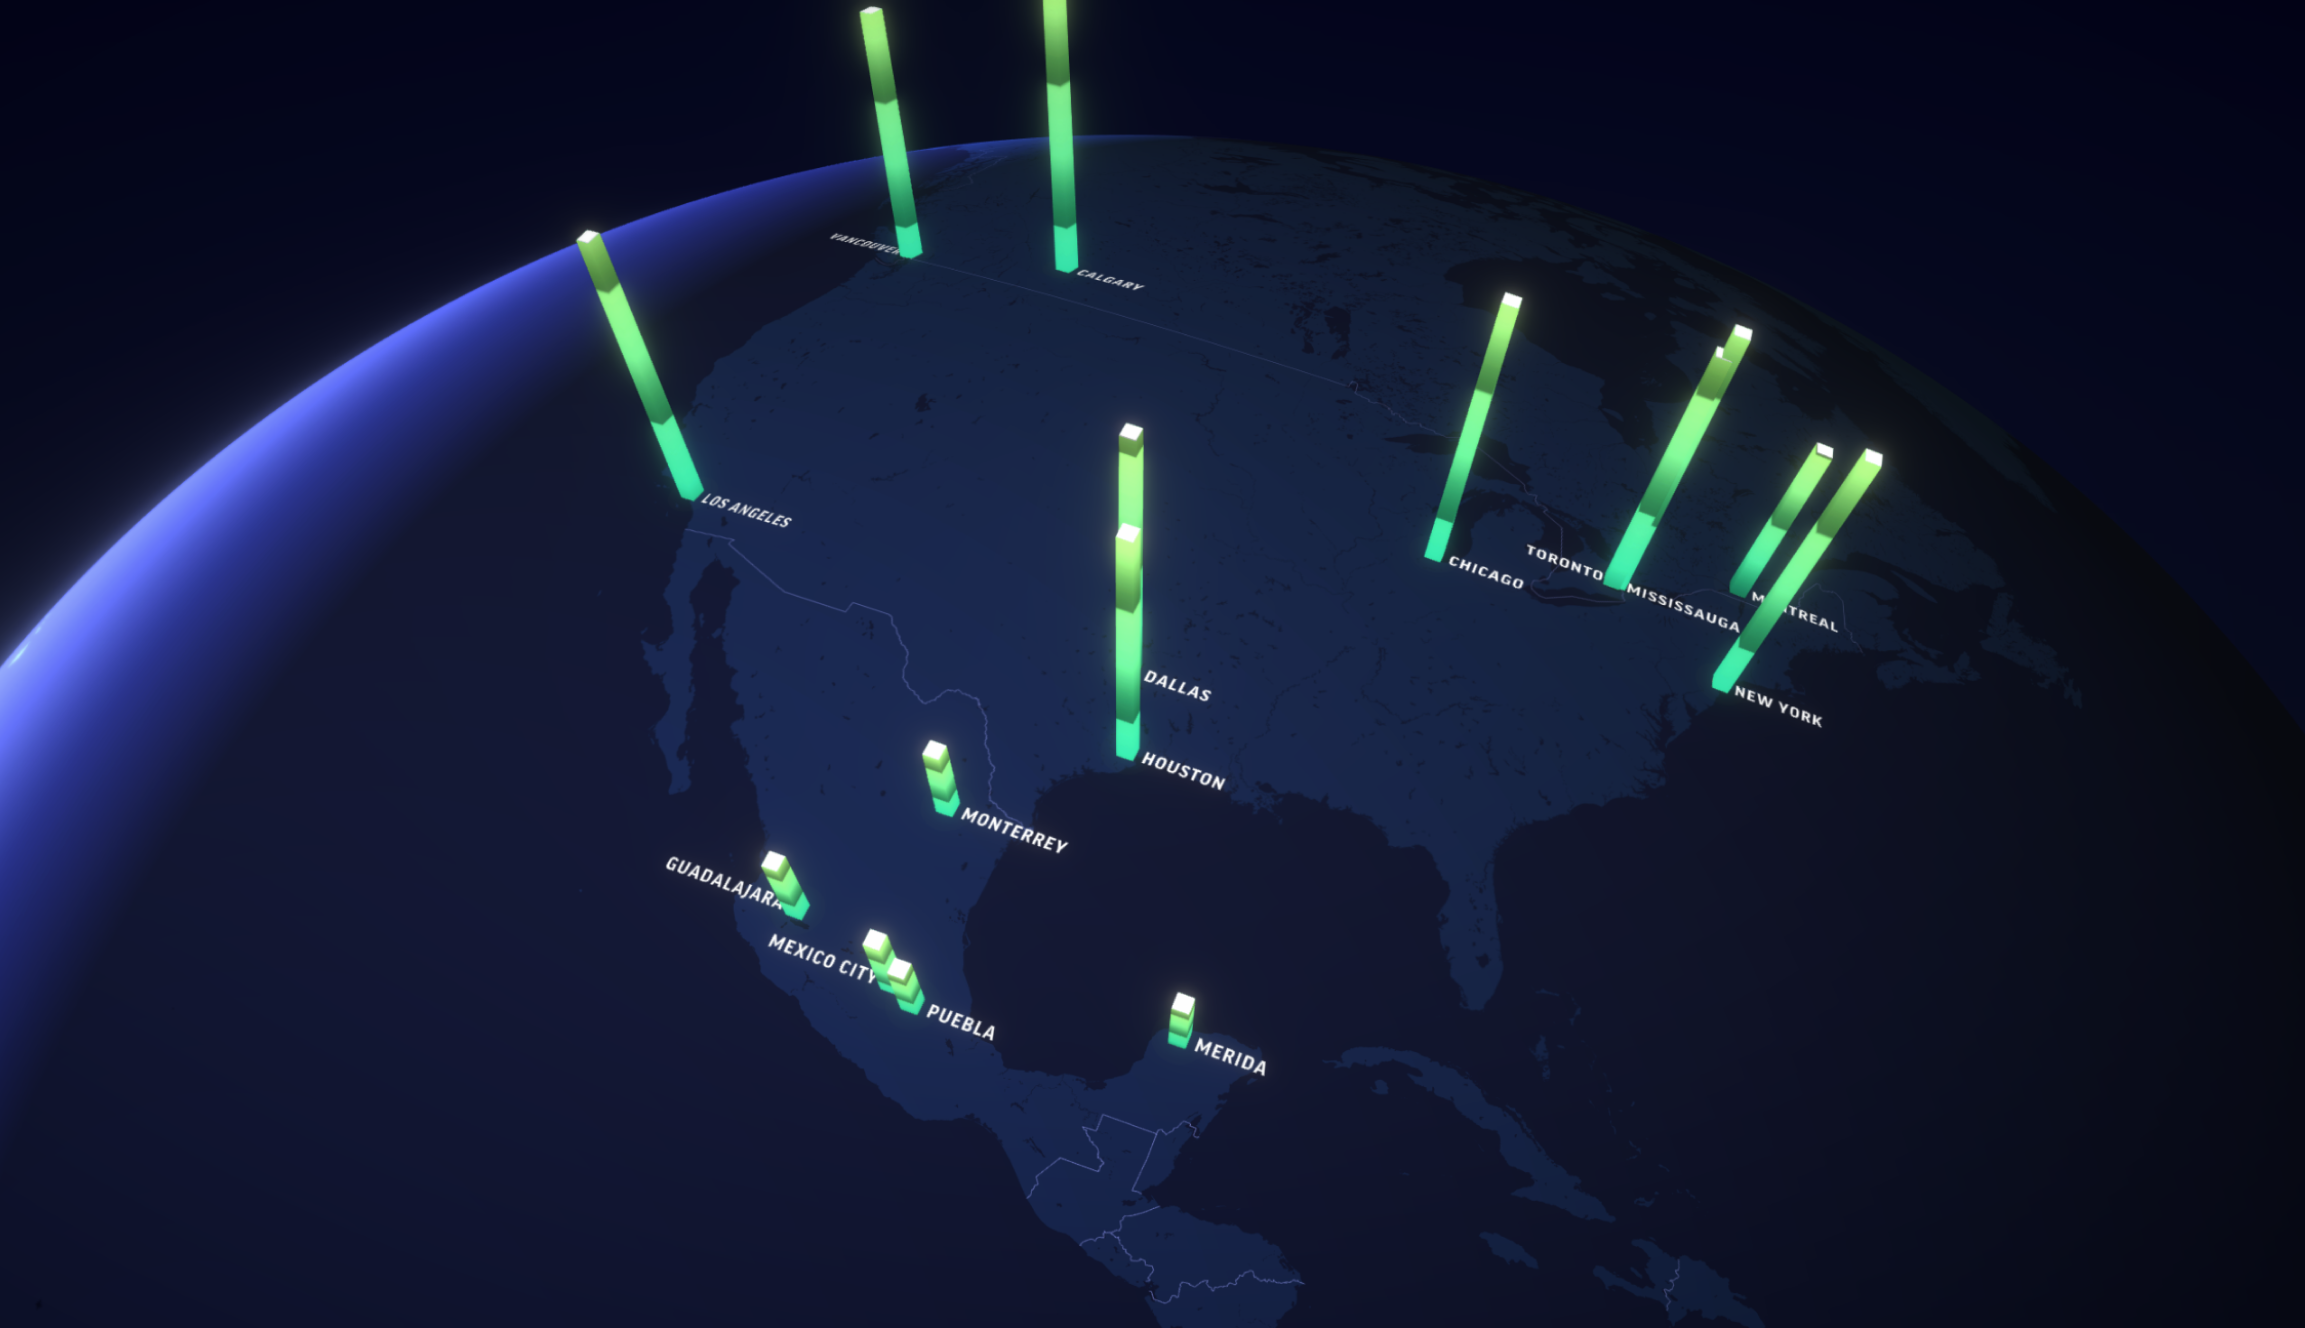
Datavisualizations
We created a simplistic 3D visualization language, that was reusable on every zoom level and data-density level. Motion was added to emphasize the metaphorical direction of the up- and download metrics, making sure visitors understood the visualization at first glance.
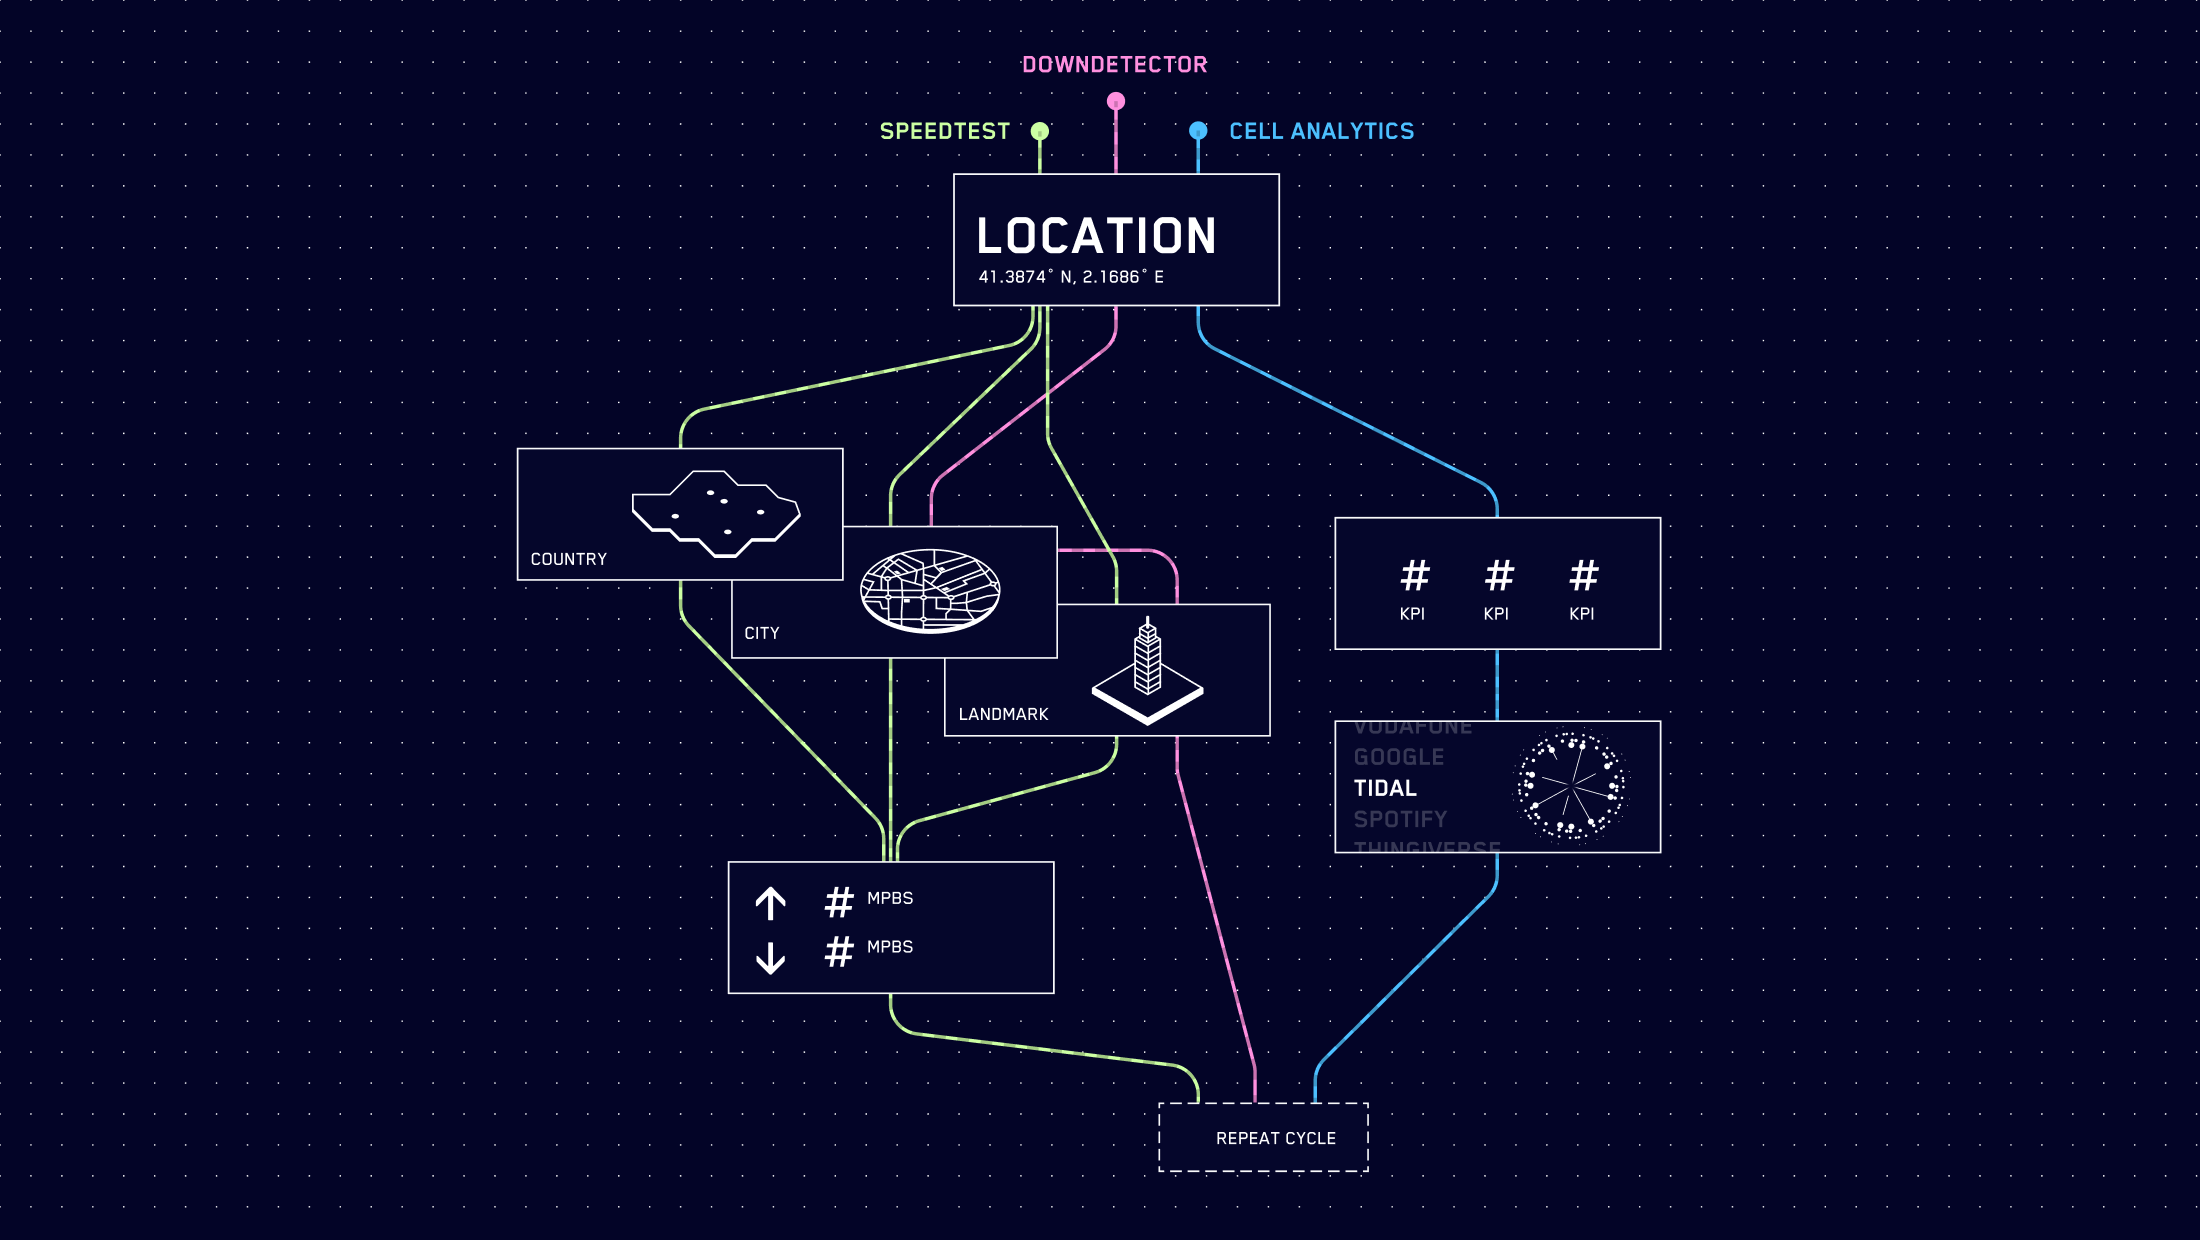
Custom-builtstorylinesystem
The number of different locations, data and products demanded a storyline logic that was reusable, generative and still flexible.
By creating a set of data-specific story components in a smart way, we were able to create multiple and different storylines for every product.
Technology
Scalabletechnicalsetup
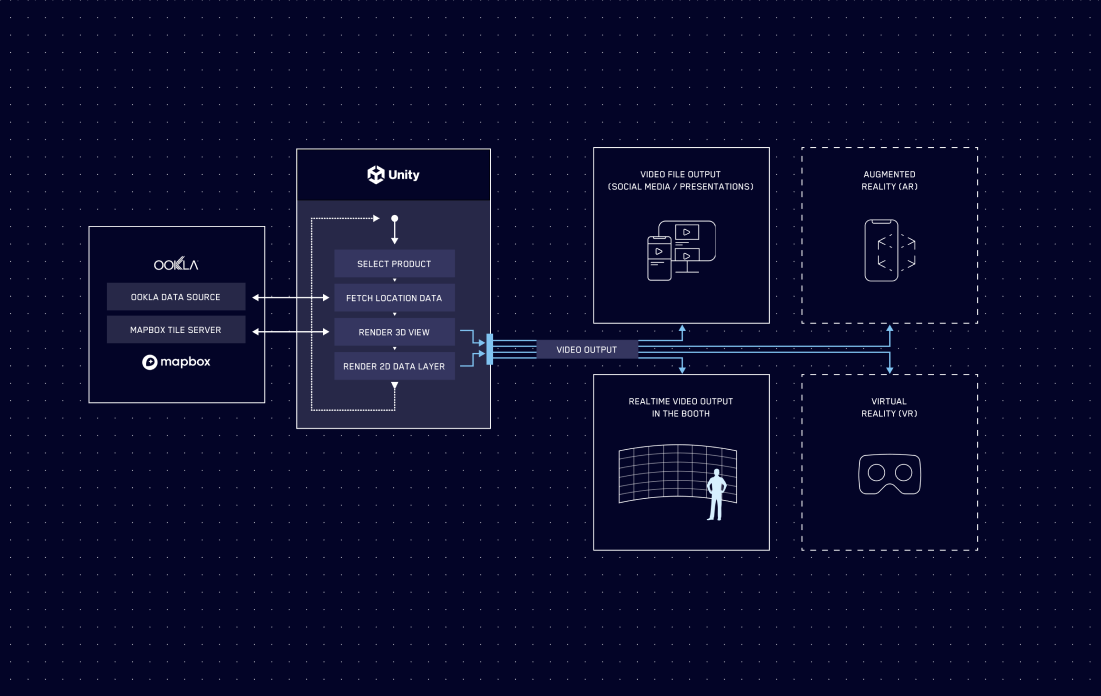
The modular setup of our custom-build visualization system, allowed us to efficiently generate 90 minutes of unique data-driven content across 45 different locations, in a very streamlined and adaptive process.
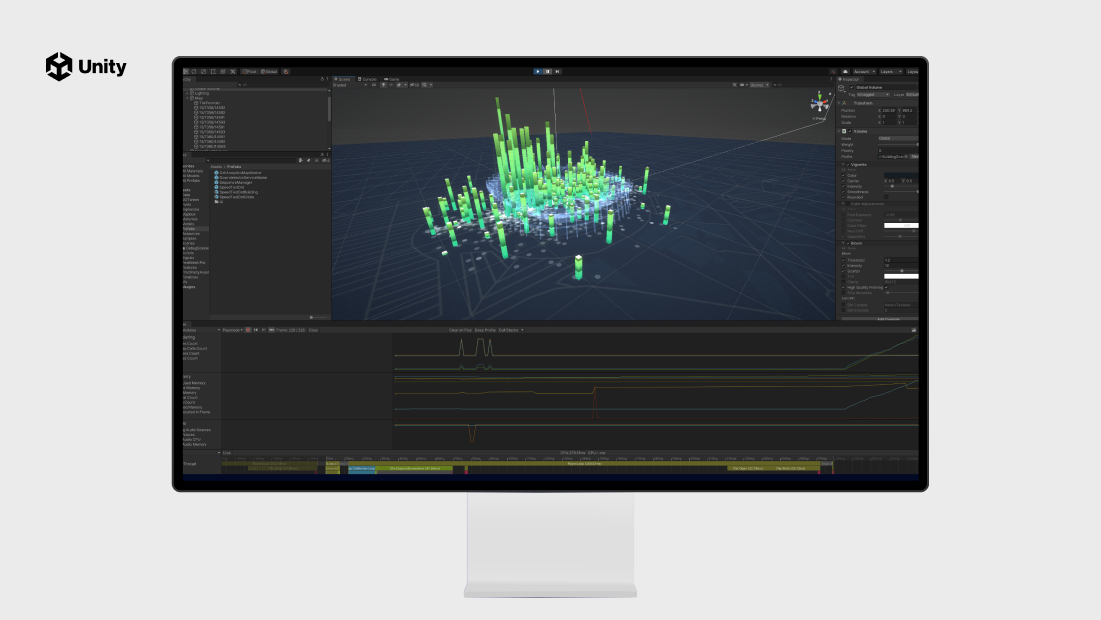
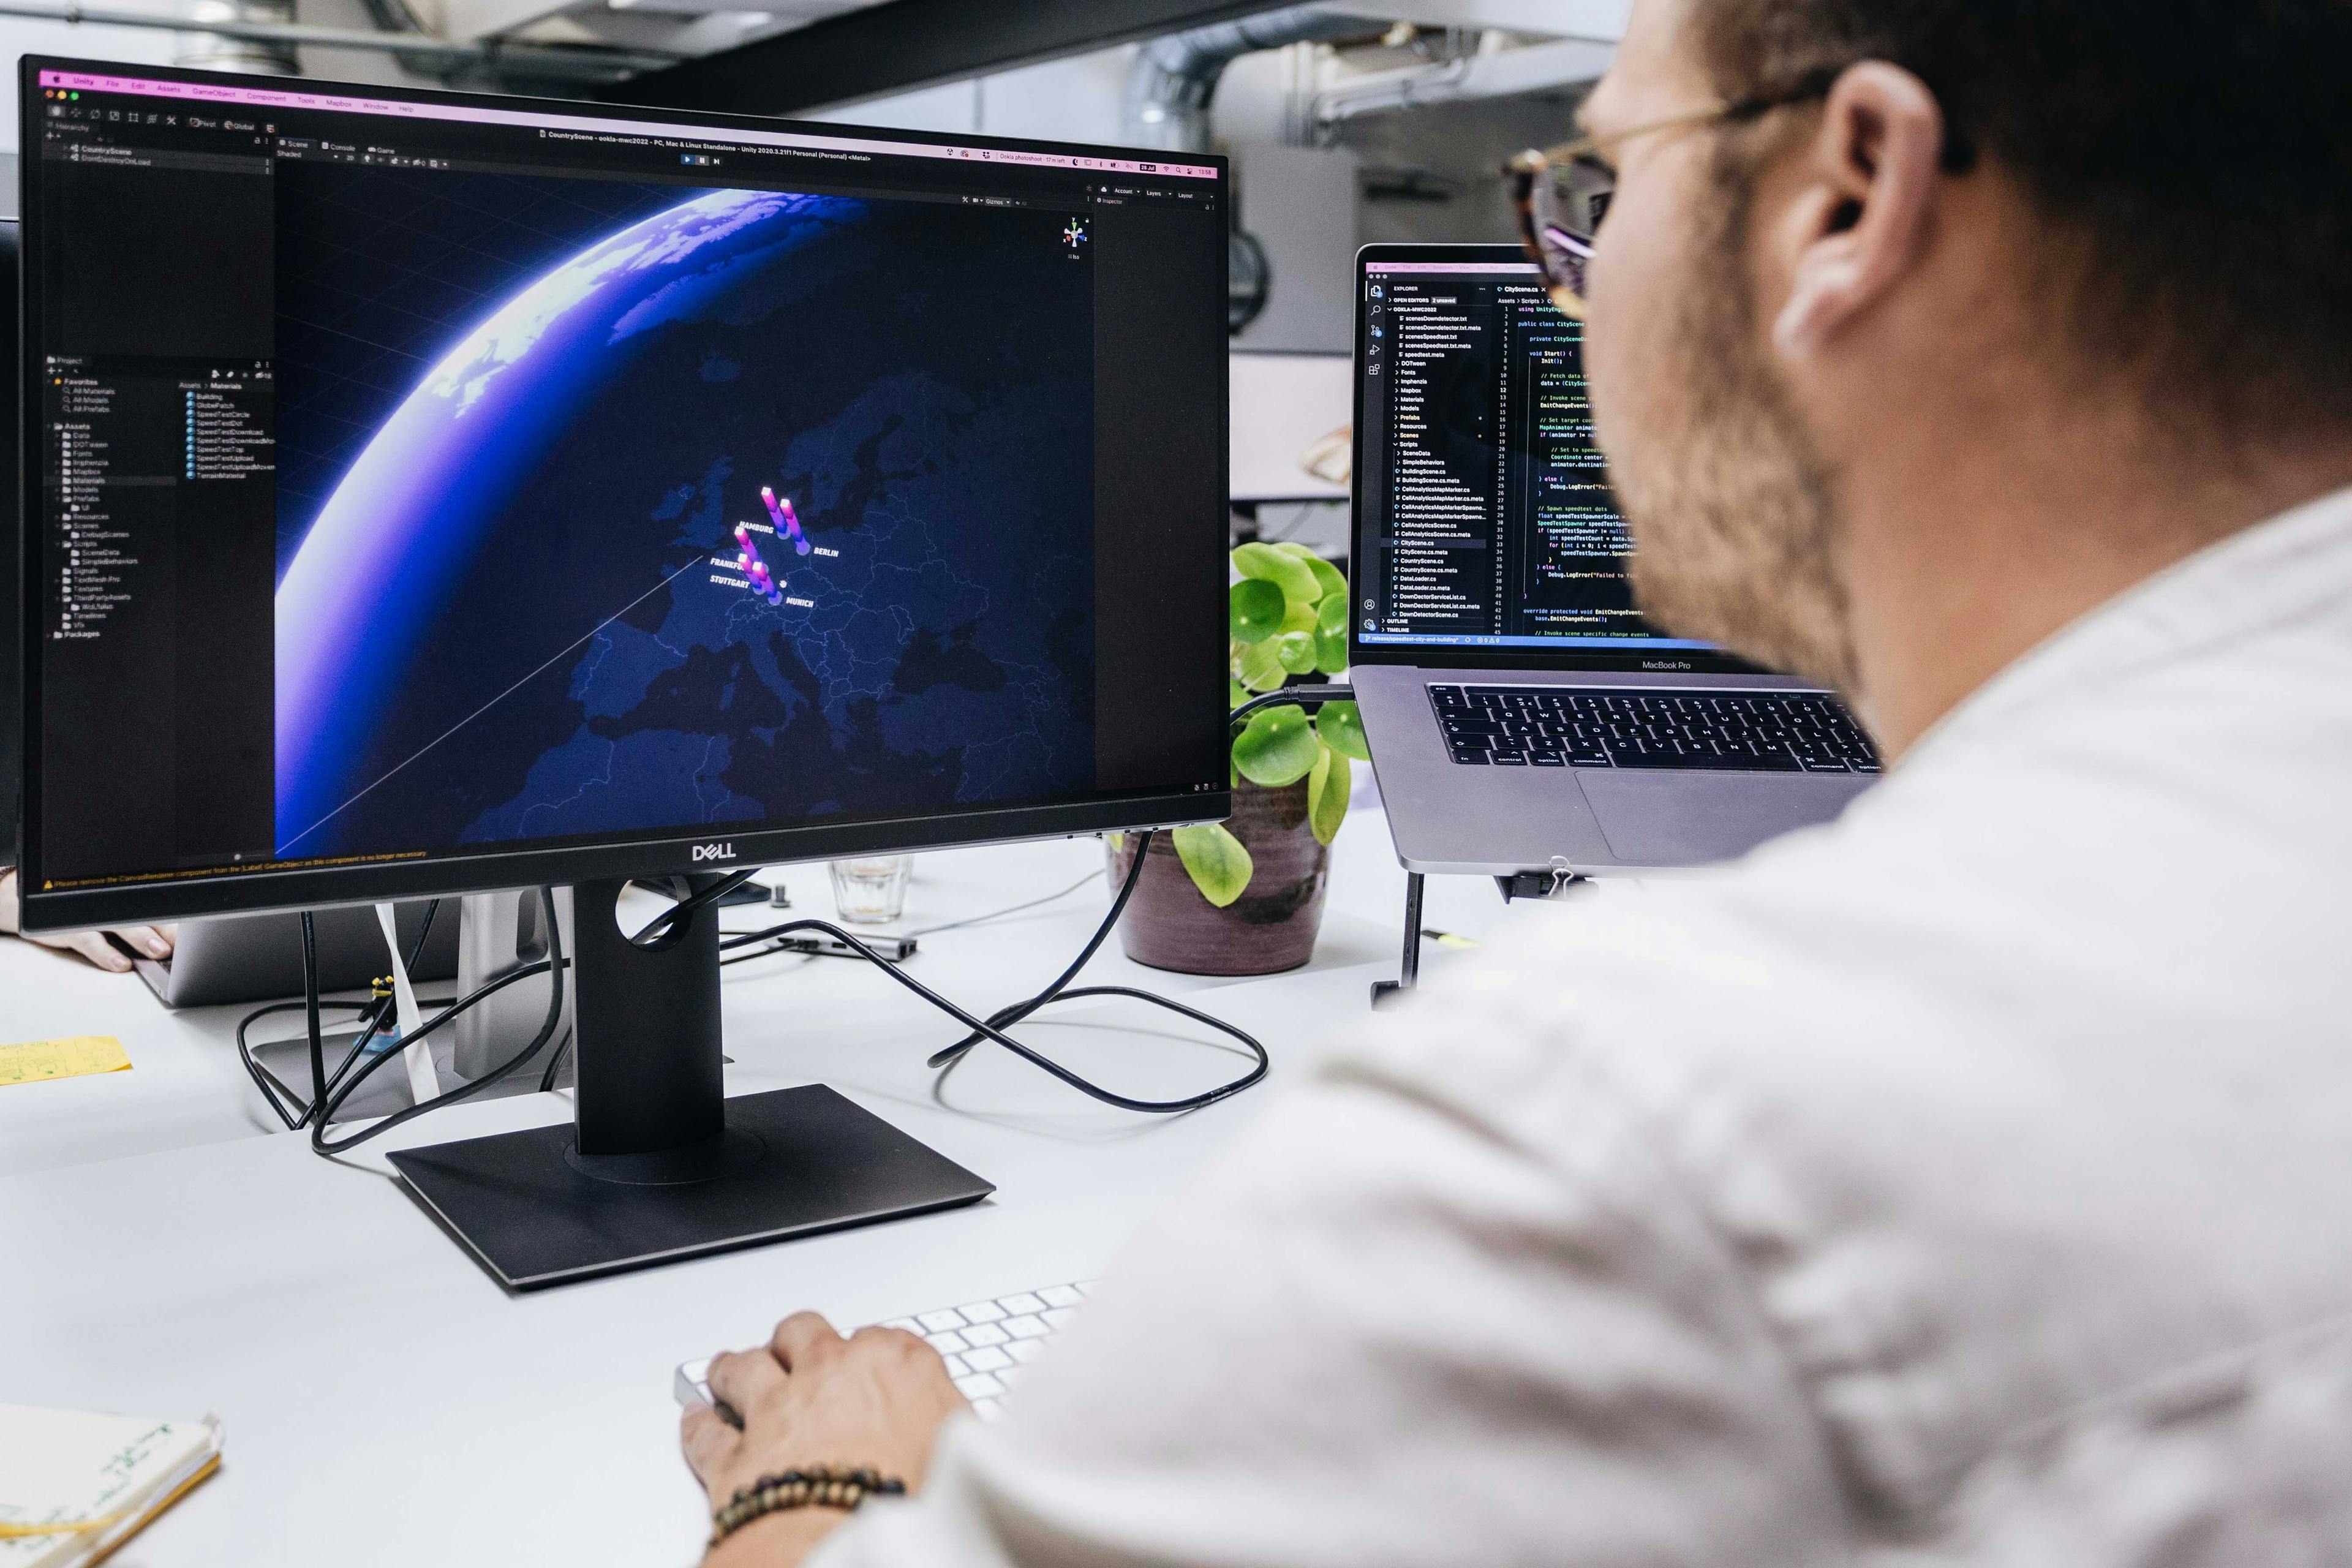
Real-timerendertechnique
All visualizations and scenes are developed in a realtime render engine called Unity. This software is initially build as a game engine, though we’ve successfully altered its functionalities to use it as a liable and performant realtime 3D data visualization tool. Working in a realtime rendered environment allows us to iterate and finetune more efficiently compared to traditional render techniques.
Readytoevolve
Unity also offers possibilities to extend the system towards Extended Reality (XR) applications within the same technical setup. This flexibility is a solid base for a sustainable and adaptive solution, and allows the tool to evolve in many ways.
Nextsteps

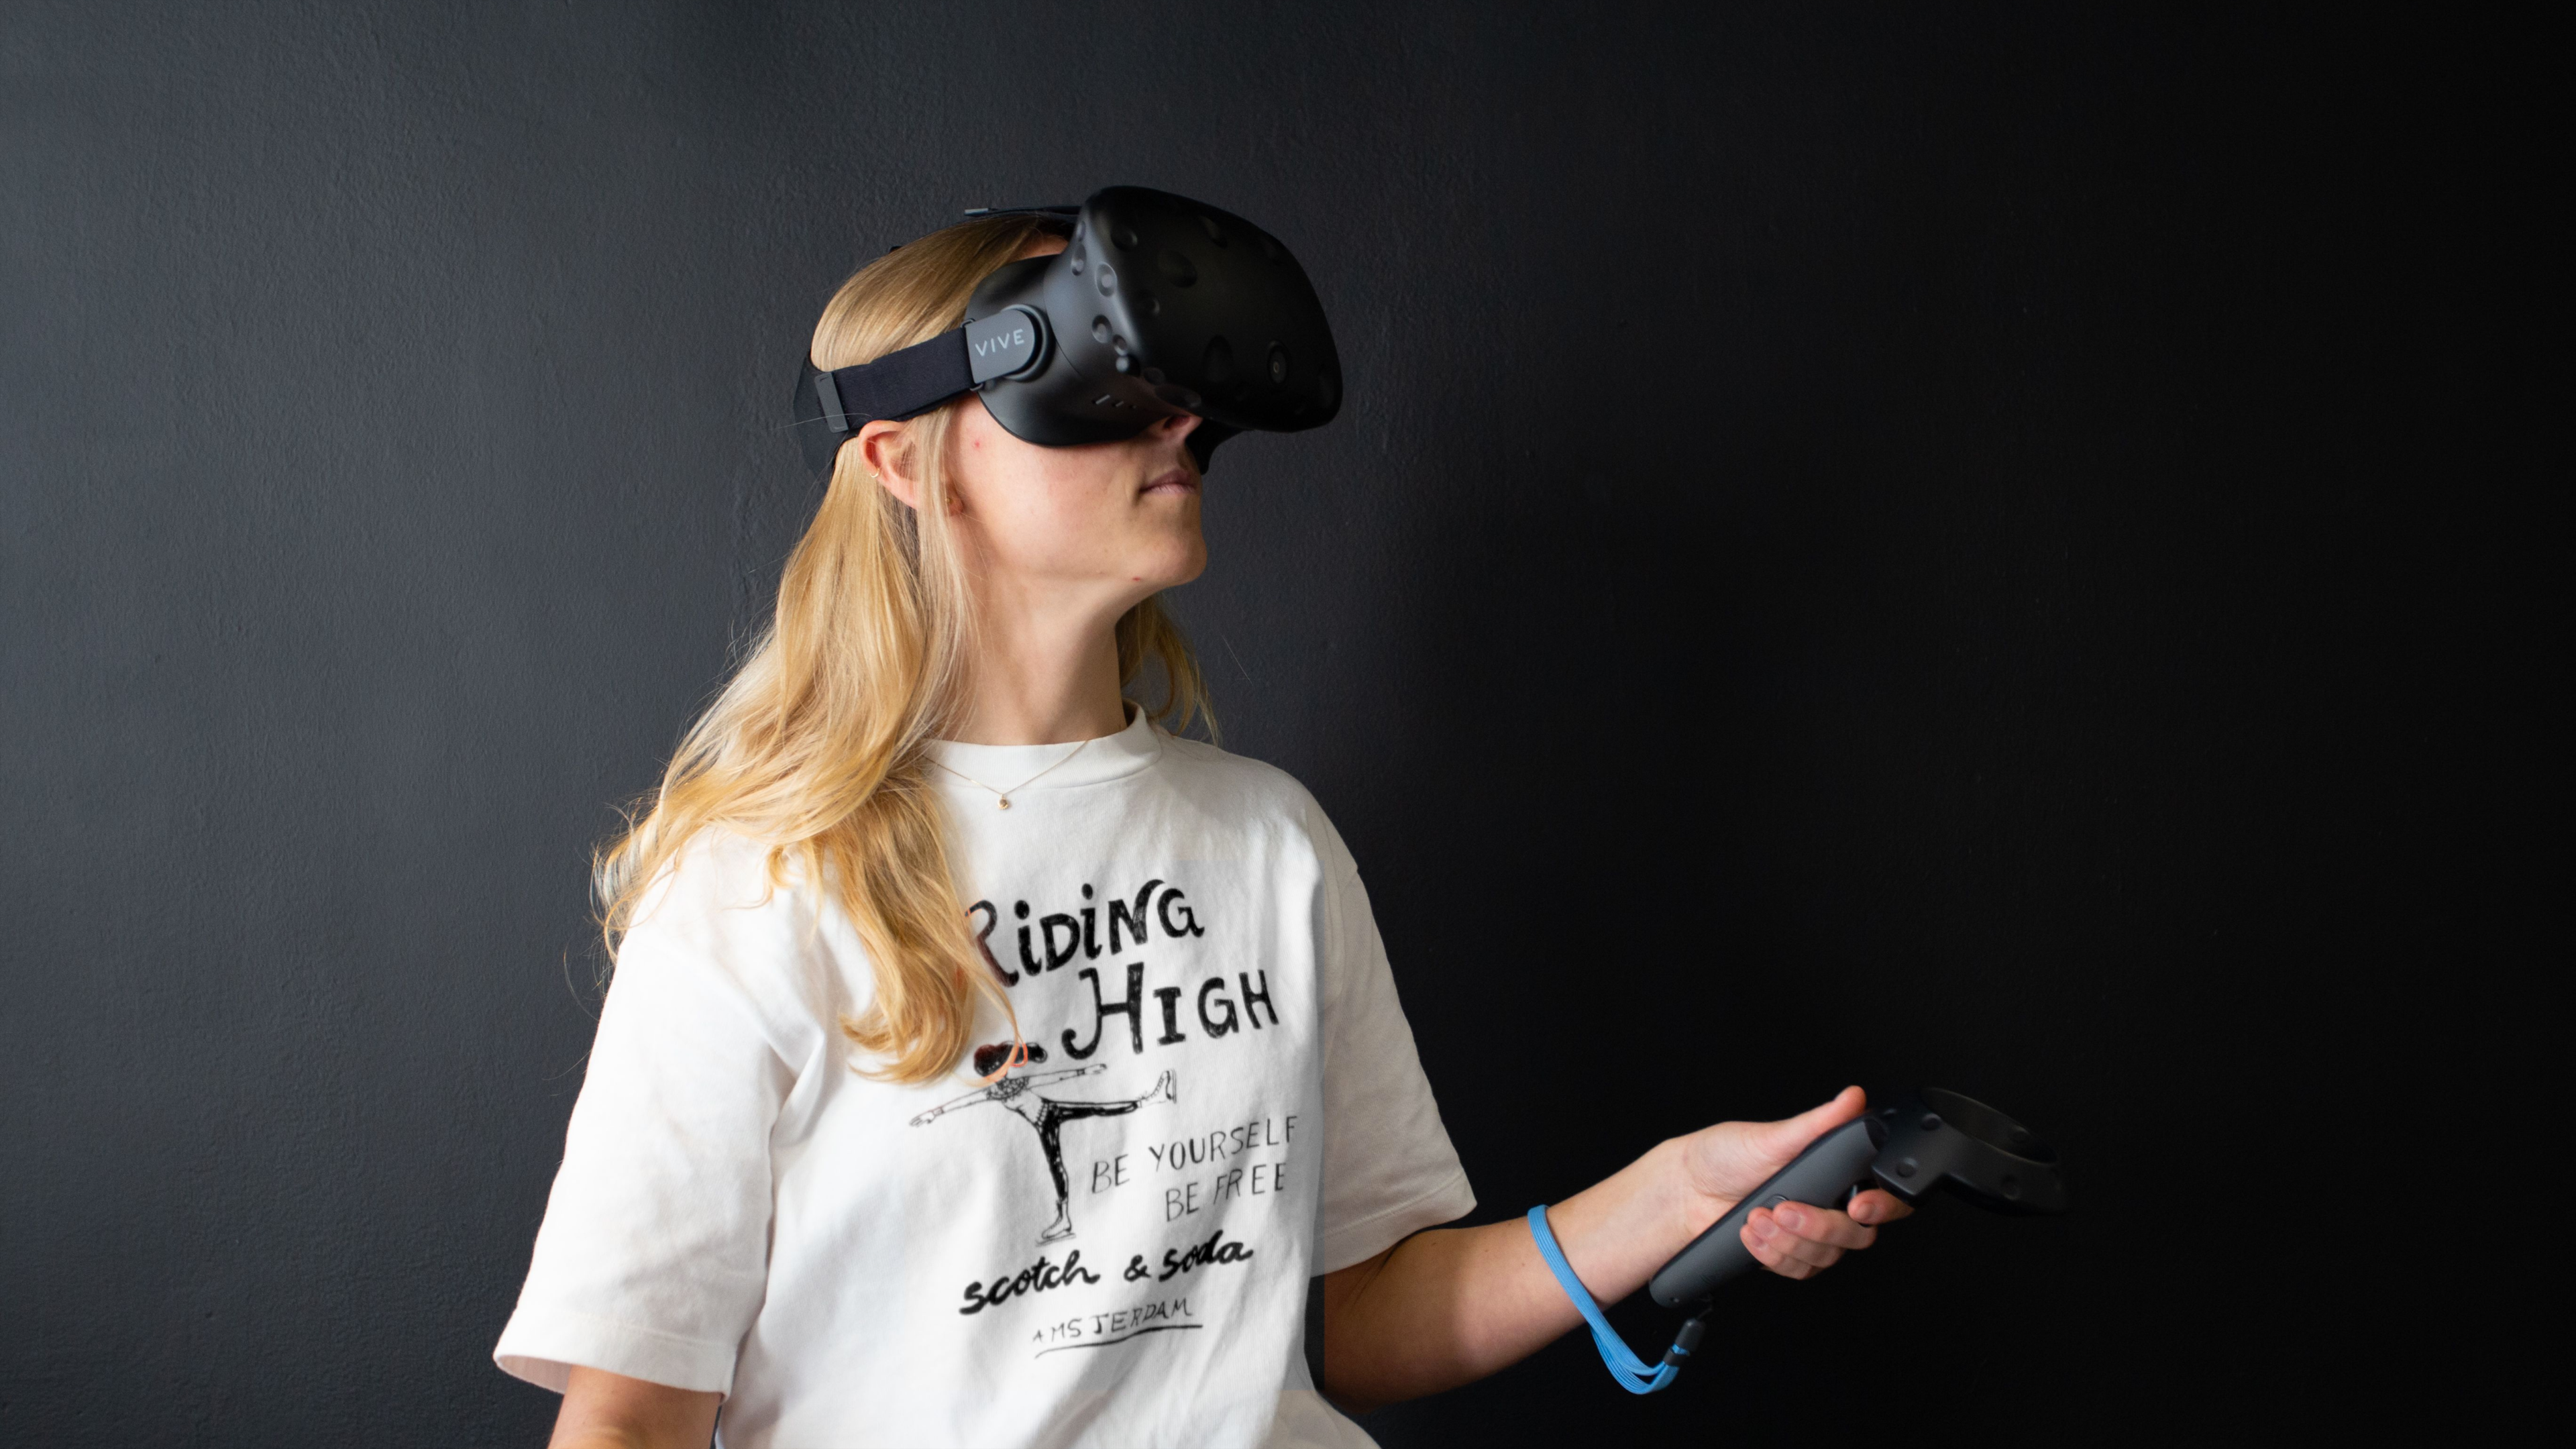
Immersiveexperience
New technologies, such as Virtual Reality (VR), open up new opportunities to showcase and explore Ookla connectivity data through a more interactive immersive experience.
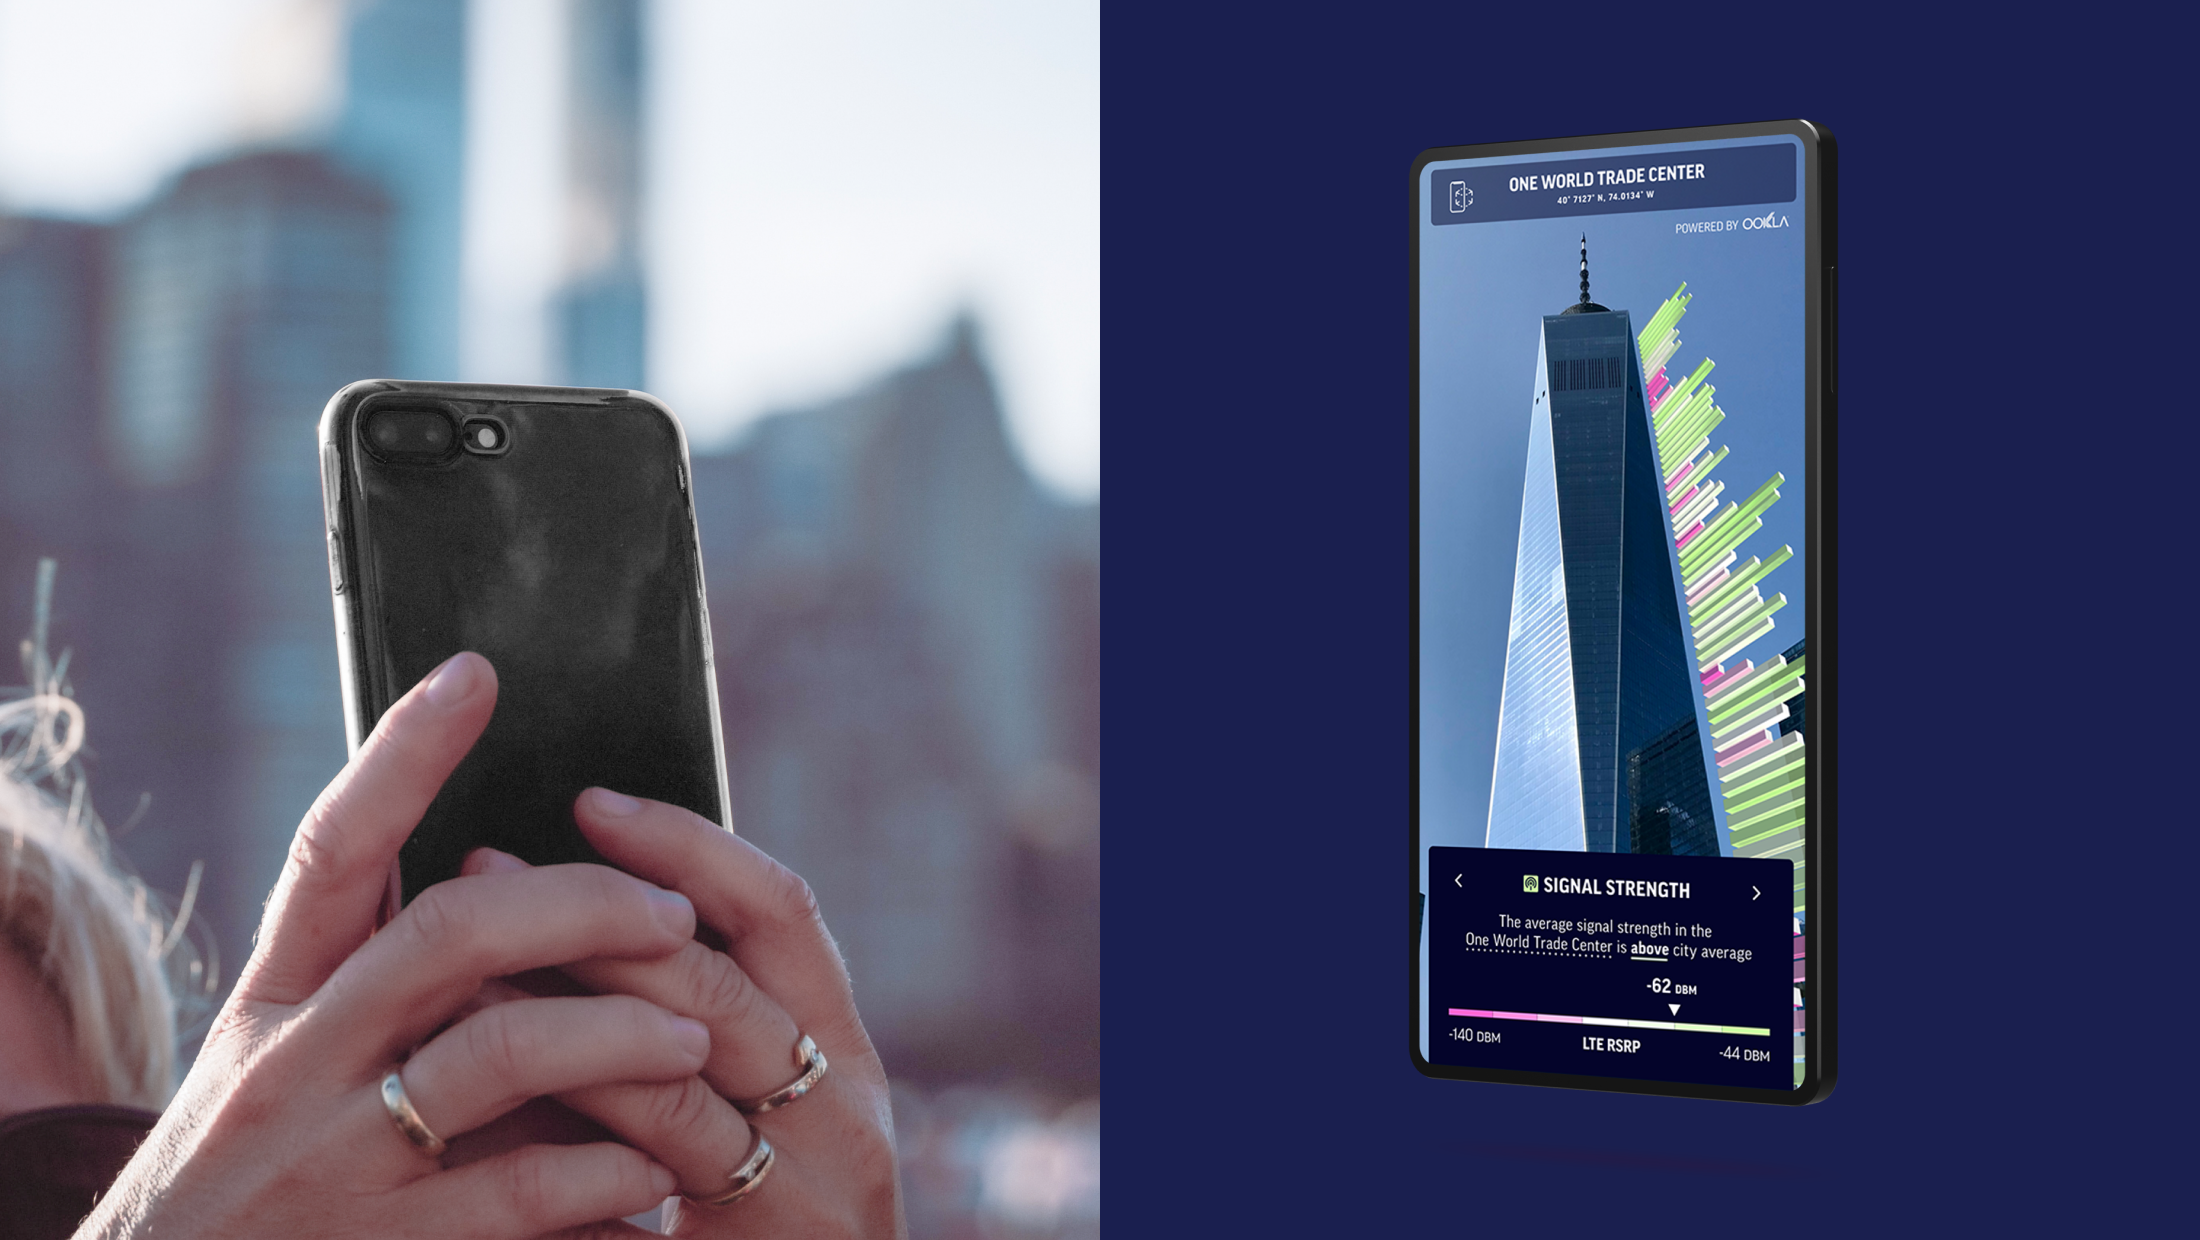
Beyondthebooth
To bring the visitor experience beyond the booth, we envision a mobile companion Augmented Reality (AR) app that allows users to use and enjoy the quality of Ookla data in their own environment and reality.
Results
Placing Ookla's information in recognizable 3D environments made their information a tangible and relatable experience. The tool enables Ookla to use updated data and create customized visualization for specific situations, allowing them to use the motion sequences flexibly. Ultimately the tool brings a human touch to their data insights and helps customers better understand the power of Ookla's products and services.
For C°F the tool showcases the power of data in 3D environments. Taking it one step further, in real life with augmented reality (AR) technology, the tool could help us find the best spots in buildings to connect to the internet. Applying it to the immersive VR / metaverse space, it can help us have a better perspective and discuss the status of the connectivity in our world.
Working with CLEVER°FRANKE on content for our biggest shows has been a pleasure. Their team has given us a fresh new perspective in how we express stories in our data. Even with compressed timelines and shifting needs, CLEVER°FRANKE has delivered quality products.
Sr. Program Manager, Ookla