play
Particle images
Optimizing particle visualizations for web design
We simulated precipitation in Indianapolis over a period of two hours.
In this project, we experimented with placing images on top of a map and we learned how they behave. To achieve this, we used MapBoxGL and exported (QGIS) high resolution PNG layers onto the exact coordinates. All data is kindly provided by 3Di Water Management. 3Di provides state-of-the-art hydrodynamic simulation software for pluvial, fluvial and coastal floods.
Simulations of weather events in real time can offer a more informed engagement with meteorological activities and enhance people’s everyday life.
Particle images
Optimizing particle visualizations for web design
Smart office atmosphere visualization
How can generative visuals turn sensor data into an expressive, room-specific ecosystem?
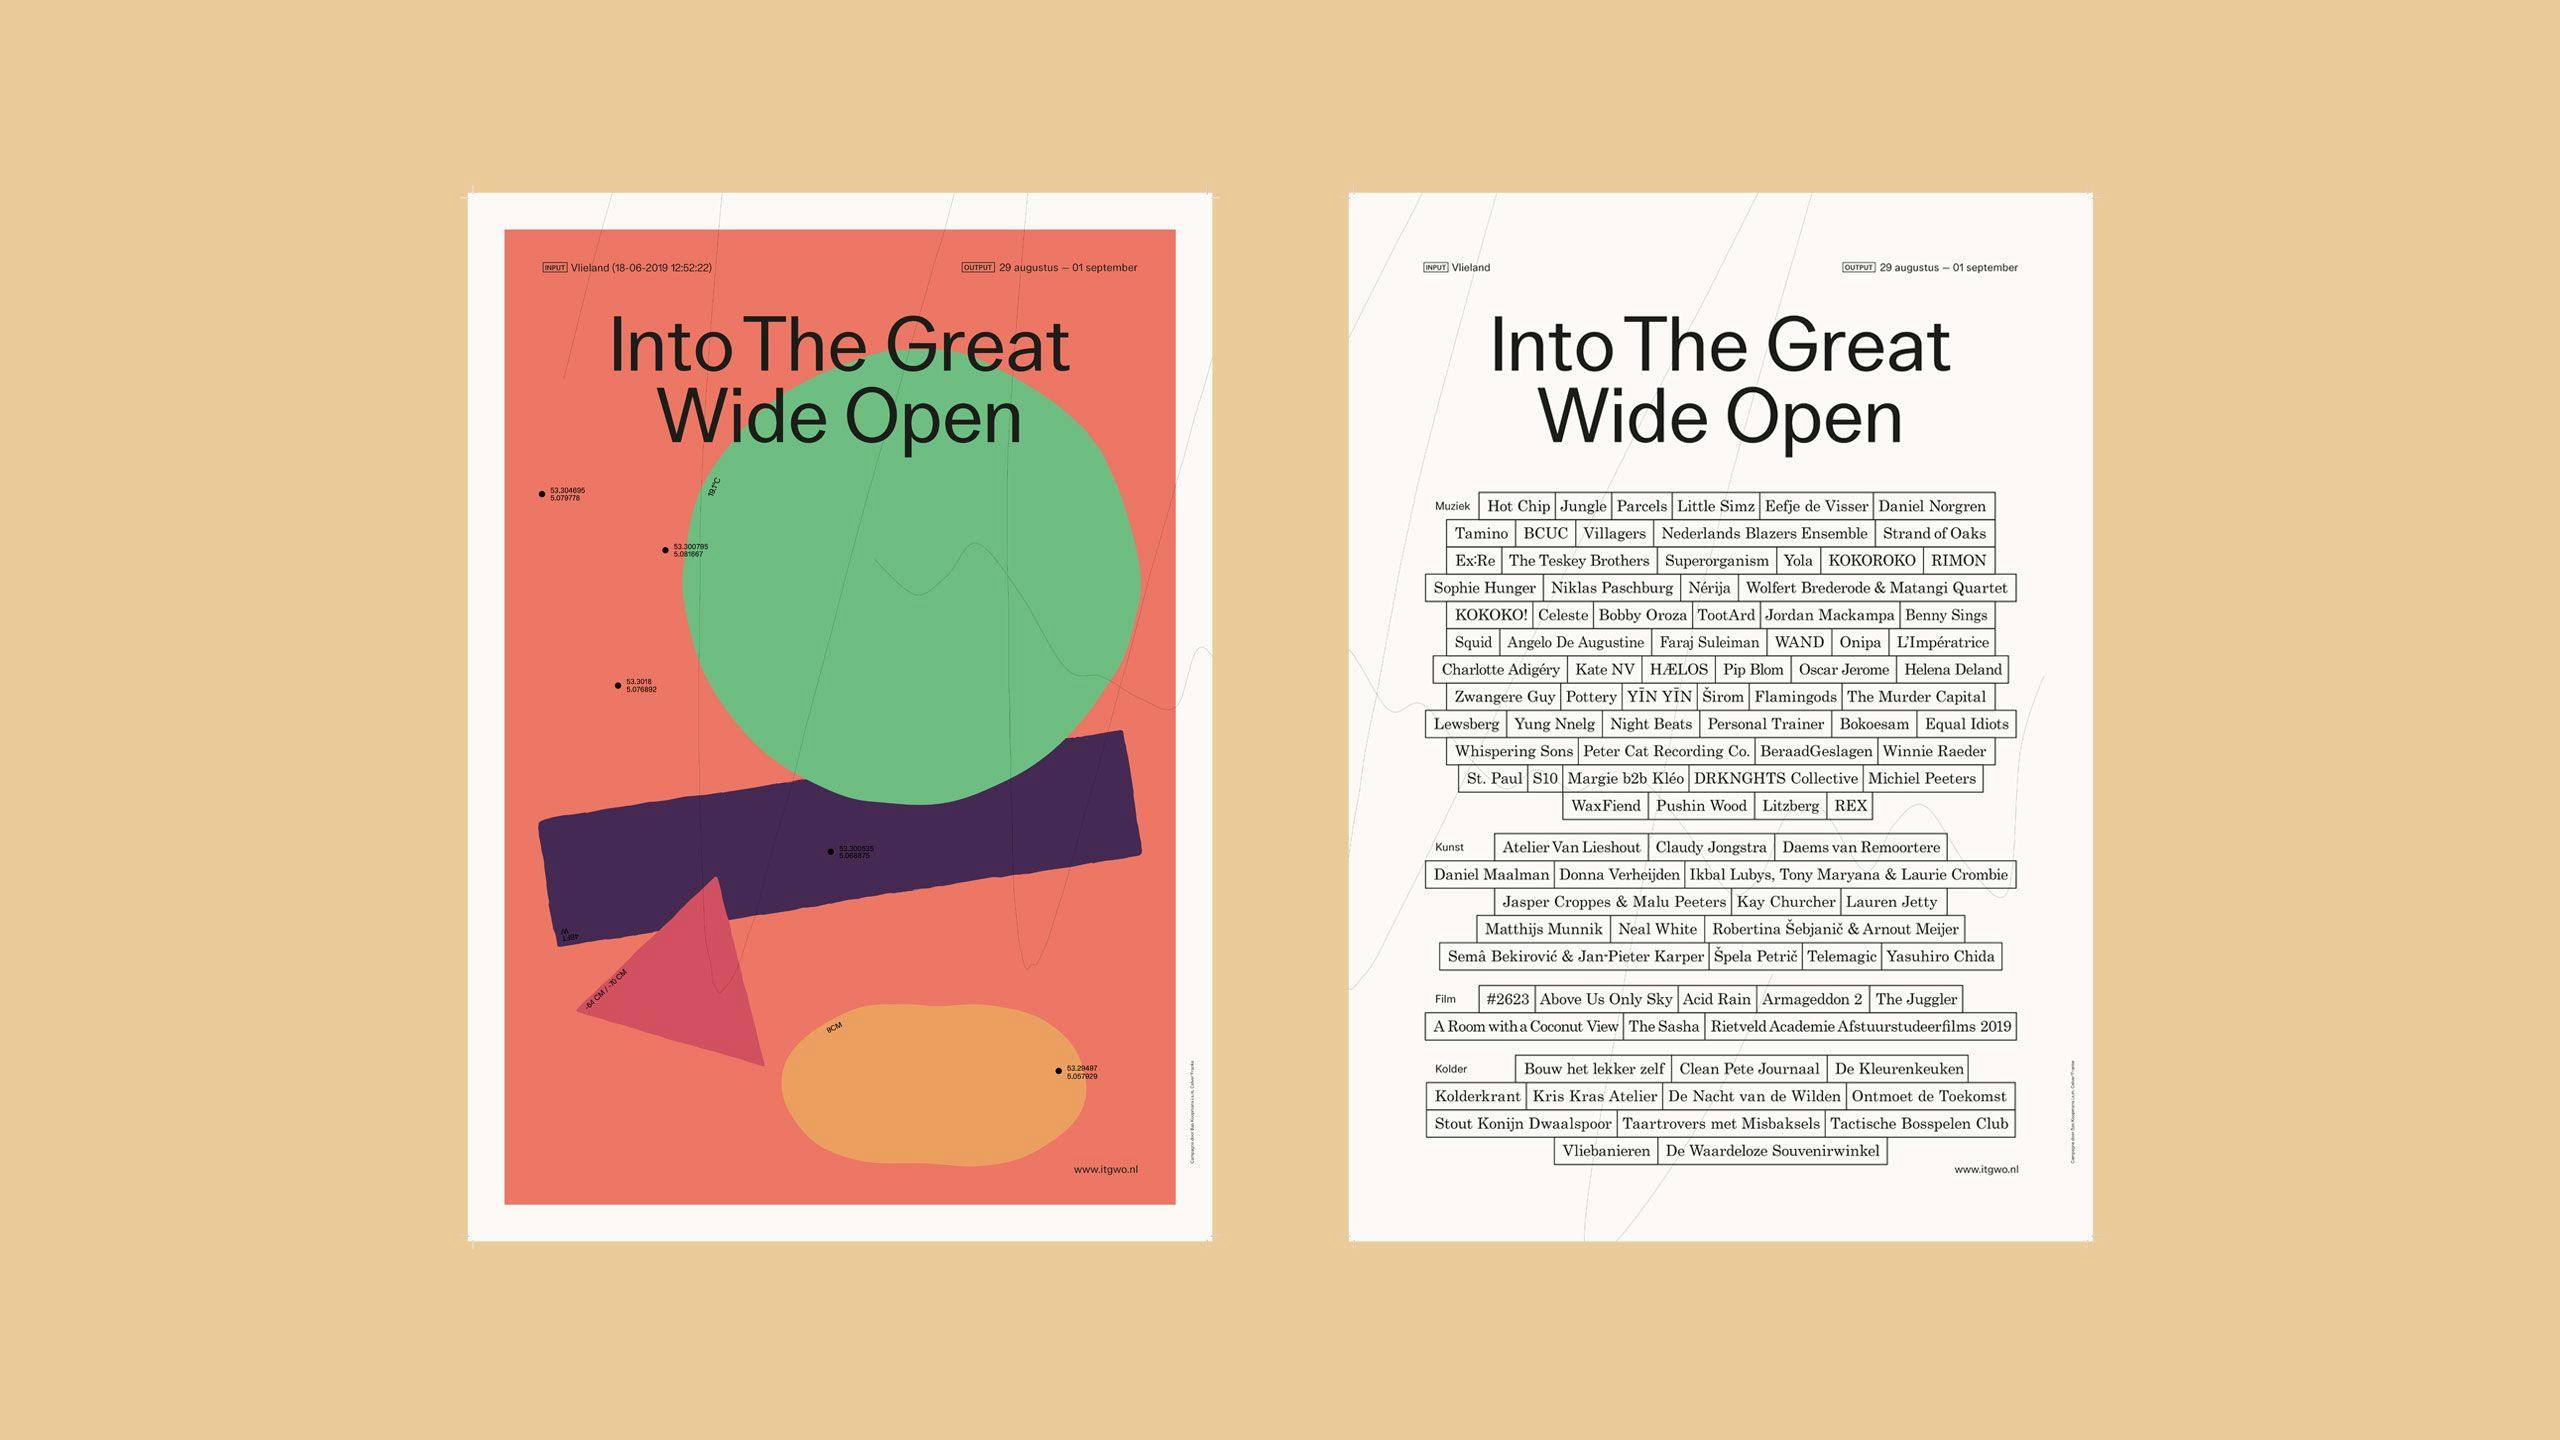
Into The Great Wide Open poster generator
Poster generator
Our colored view of the world
How online news articles paint our worldview