Playful data-driven stories that raise awareness of issues that matter to young people
Statistics
- Client
- UNICEF
- Awards
- European Design Award – Bronze
- Red Dot Design Award (x3)
- Innovation by Design Award – Nominee
- Deliverables
- Microsite
- Report
- Open data source
The challenge
In today’s rapidly changing world, the way children experience their surroundings is also changing fast. As the world is increasingly becoming more digital, globalized, and diverse, childhood is transforming with it.
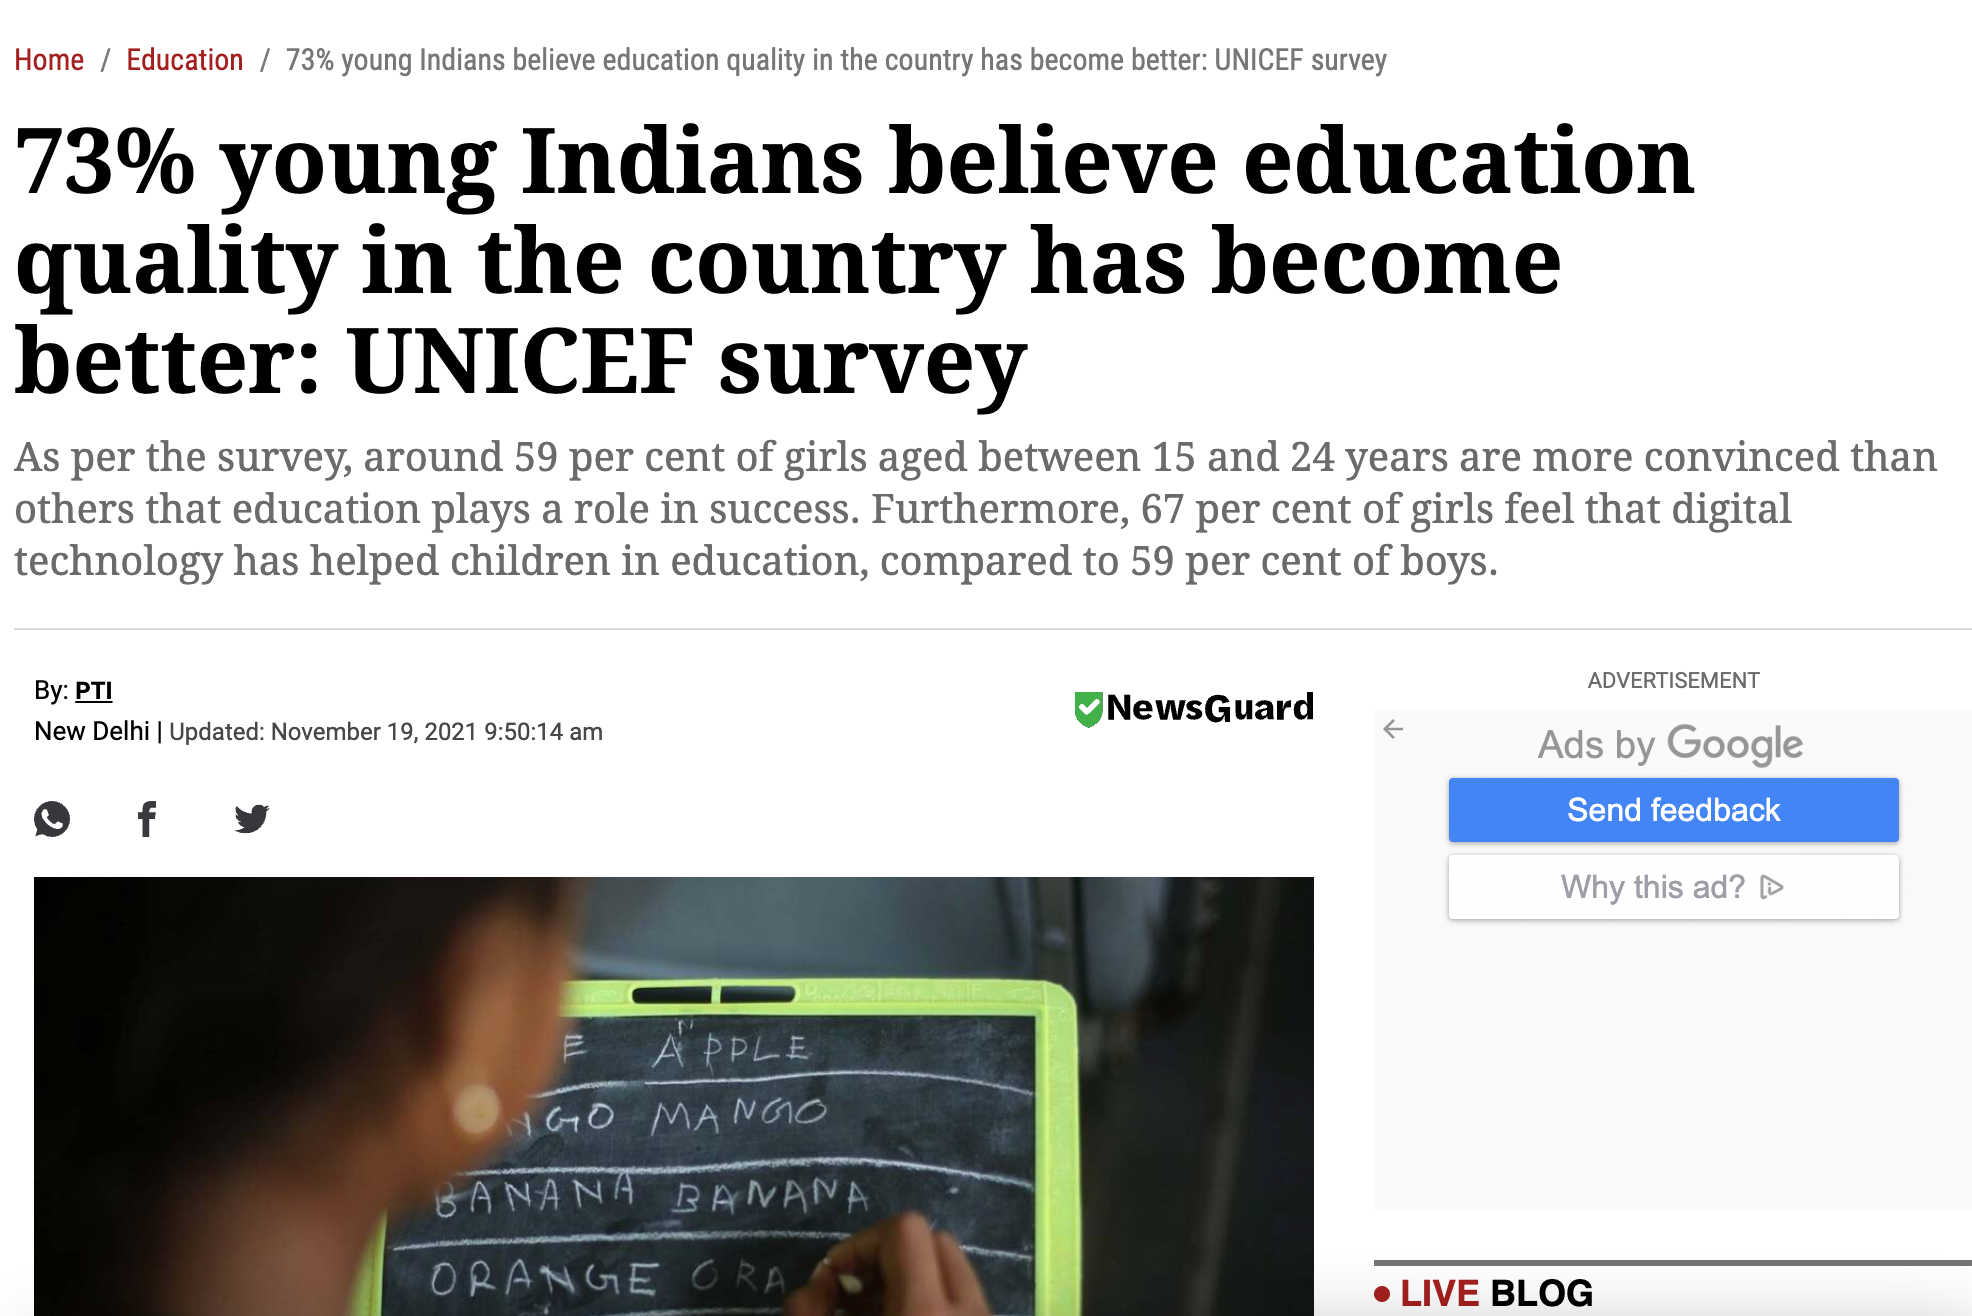
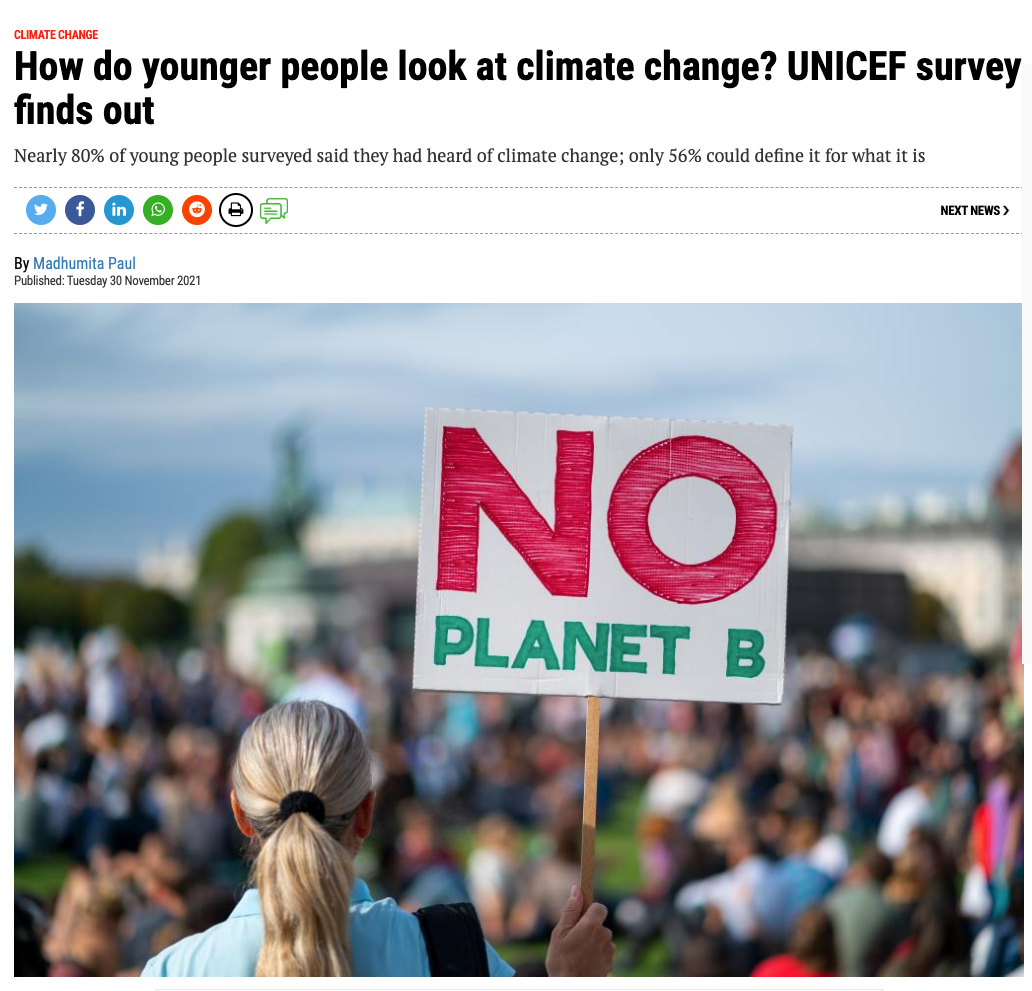
To better understand shifts in today’s childhood, UNICEF and Gallup Inc. conducted a first-of-its-kind global survey that gives insights into the perspectives of younger generations. UNICEF surveyed 22.043 people in 21 countries around the world and asked CLEVER°FRANKE to turn lengthy survey results into meaningful and compelling stories. We designed and developed an immersive, engaging and intuitive experience, guiding the user through the key themes and findings from the survey.
Value delivered
Turning static survey data into an interactive playful experience, which allows a broader public to learn about today’s challenges young people experience, fuels public discourse and ultimately strengthens UNICEF’s thought leadership in improving life for all children.
Background
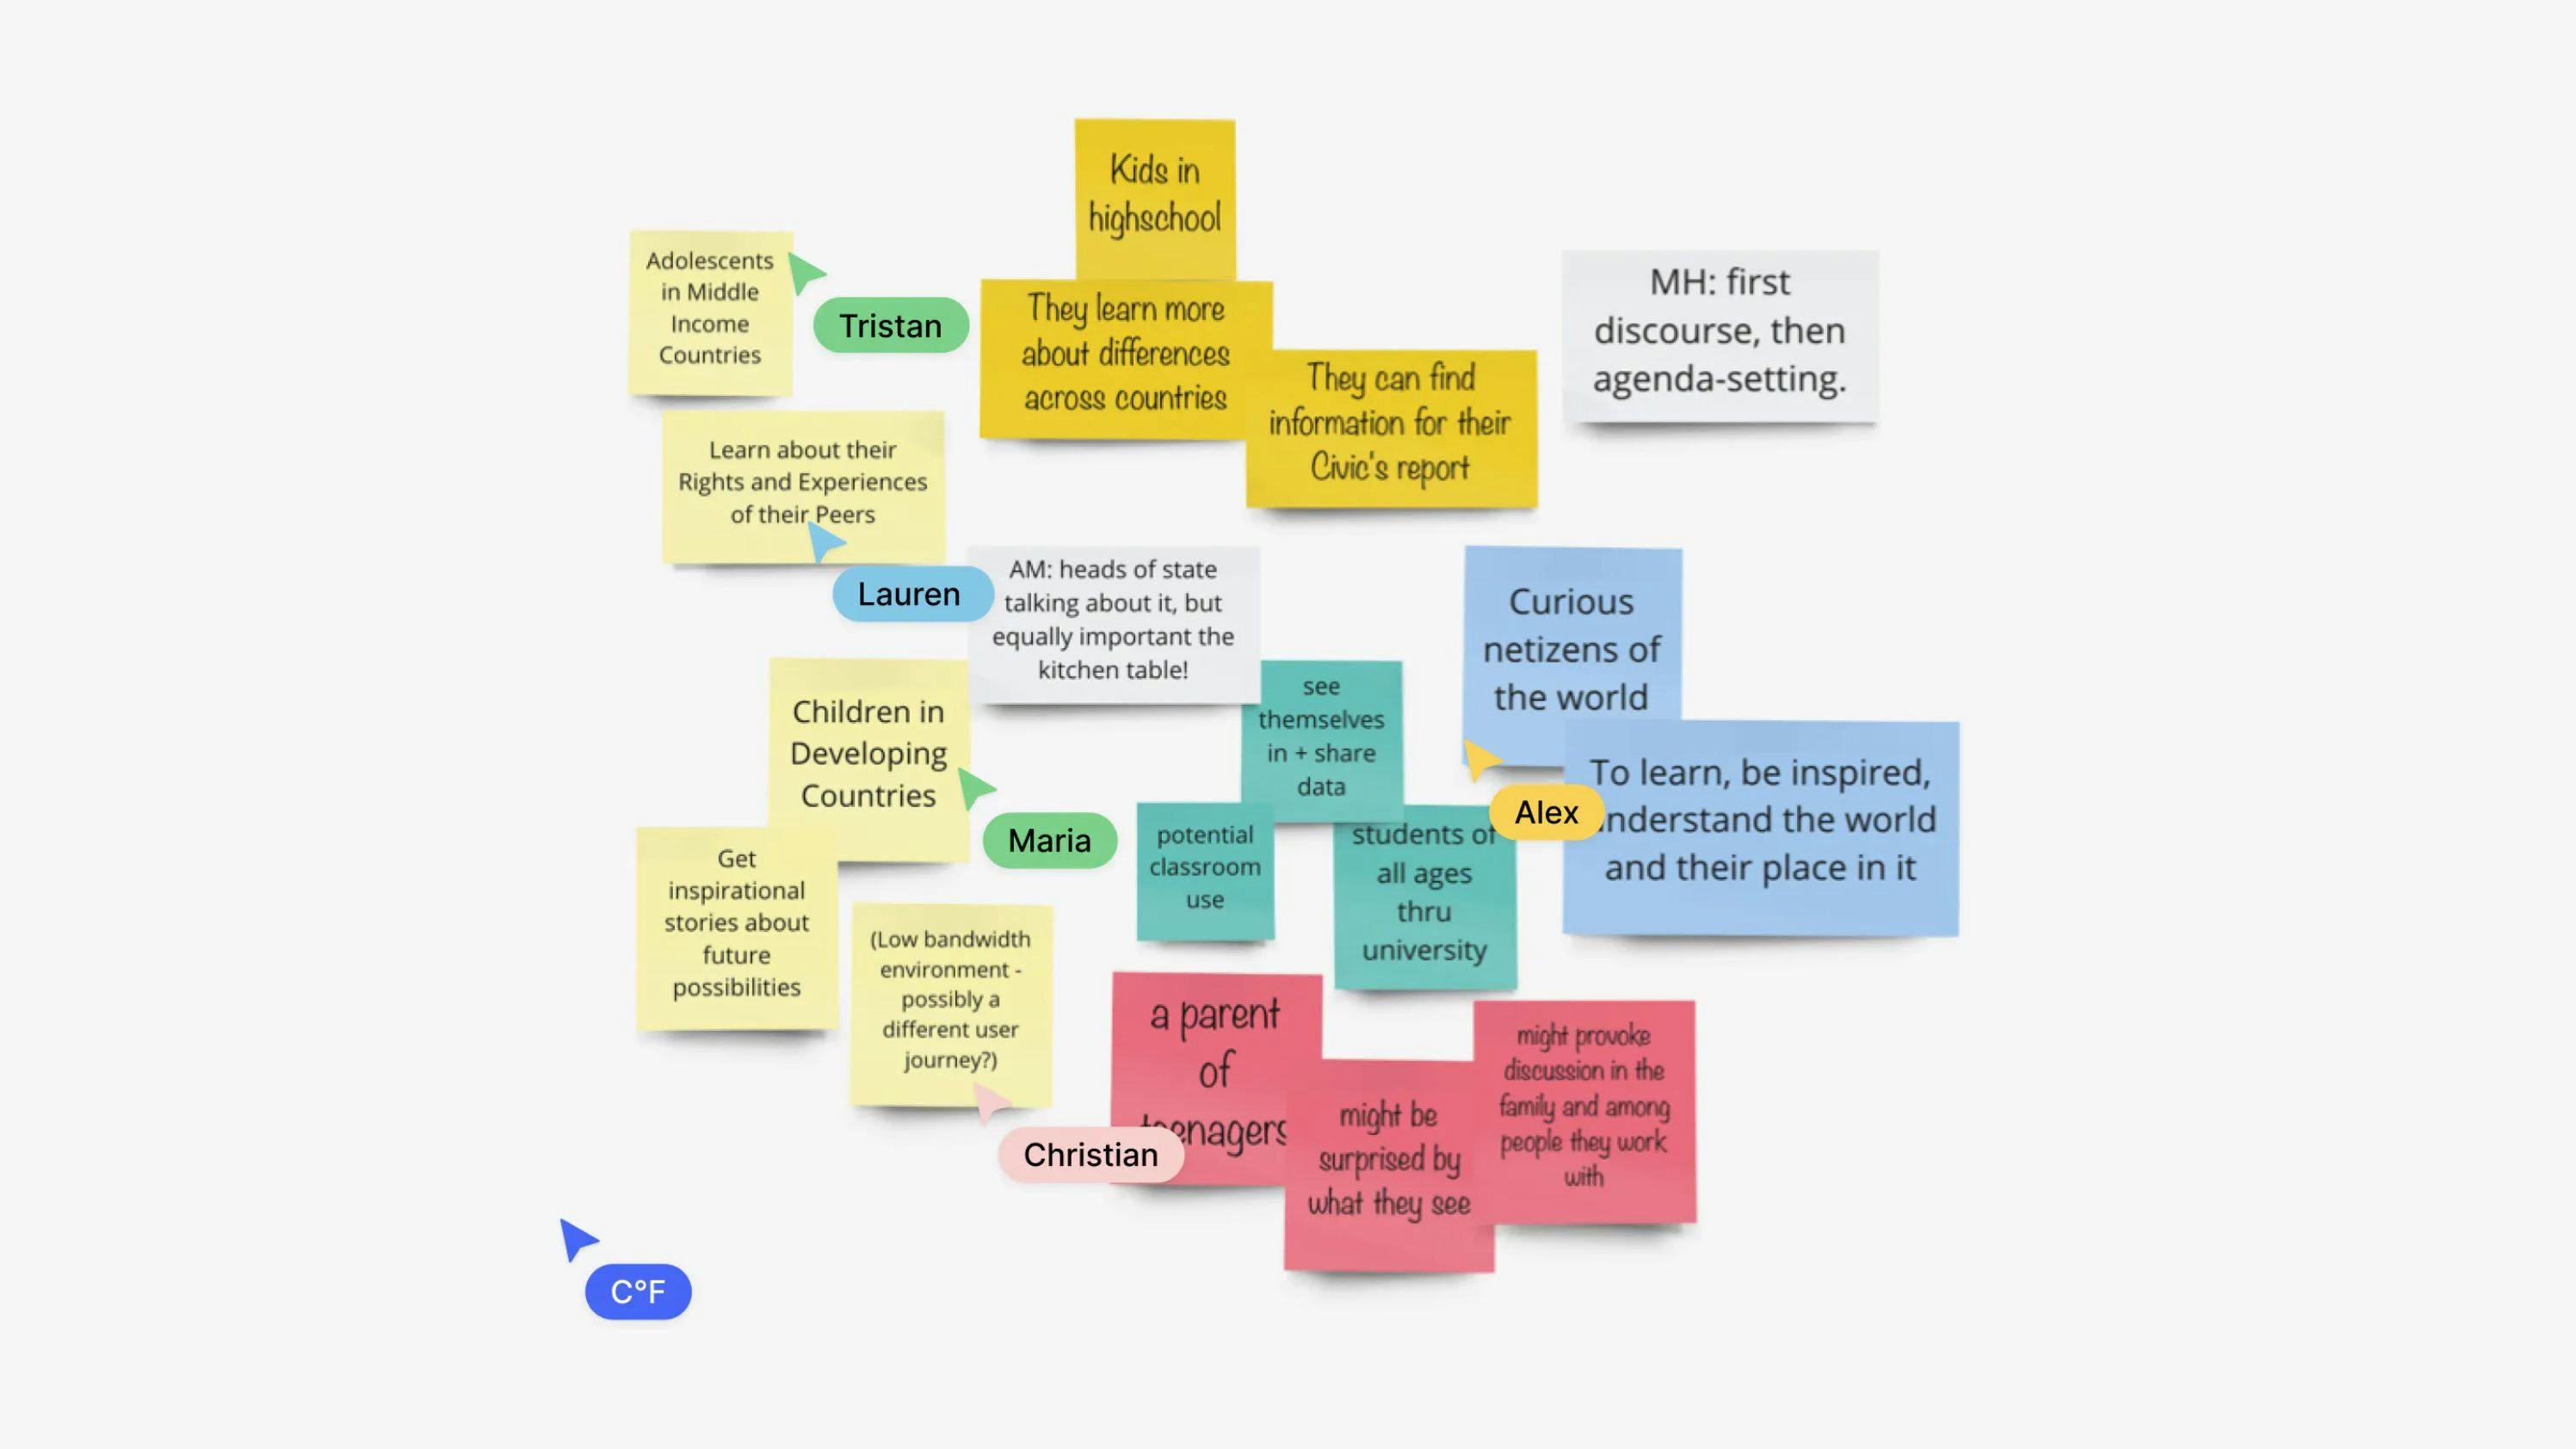
Being given large amounts of raw survey data, one of the main challenges was finding ways to turn it into meaningful narratives. To tackle this challenge, we started out with research and exploration. Through a kick-off workshop with UNICEF, we mapped out the strategy and defined our main audiences — mostly the young, but also policymakers and journalists.
Once we understood the audience, its interests and needs, the design, data, and technology exploration followed. We examined how to structure survey data and defined key design principles. The platform had to be engaging to attract young people, but also include enough factual content for policymakers.
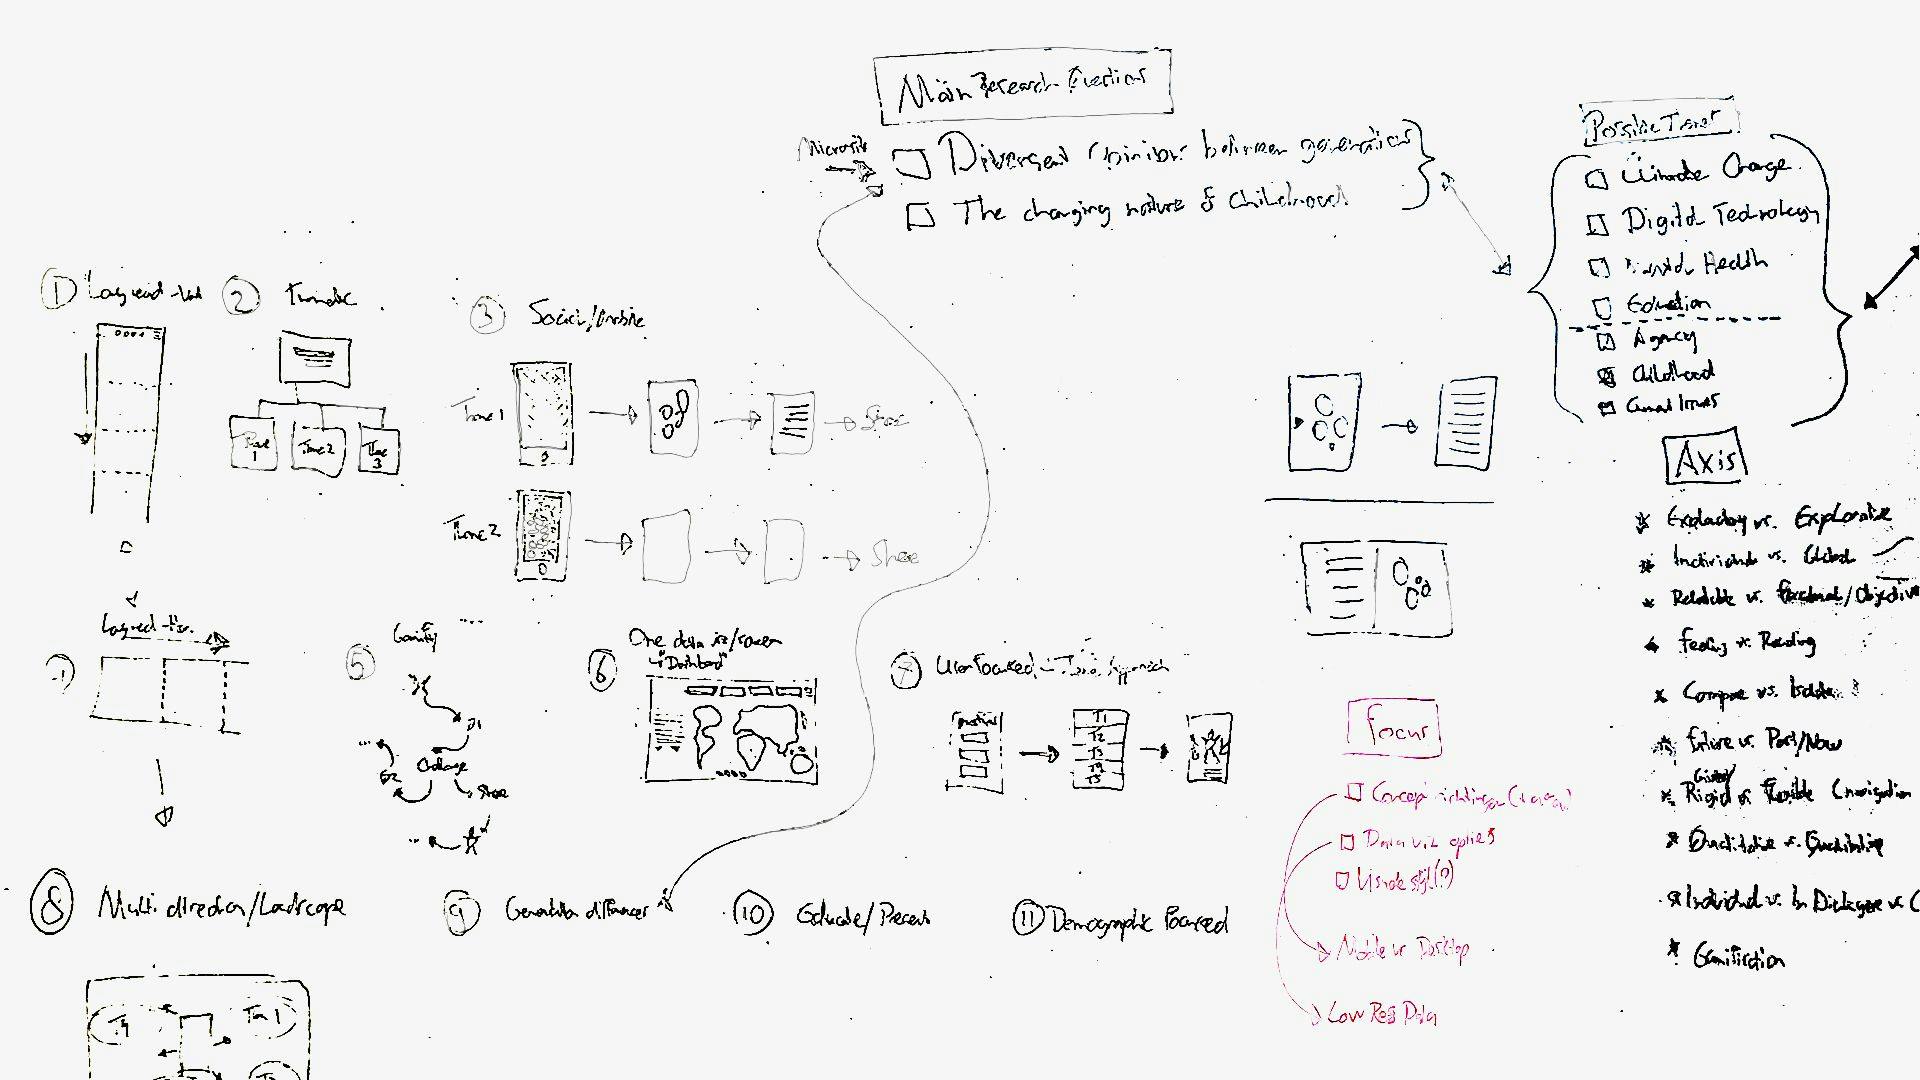
Phases and toolkit items used
Animationsexplorations
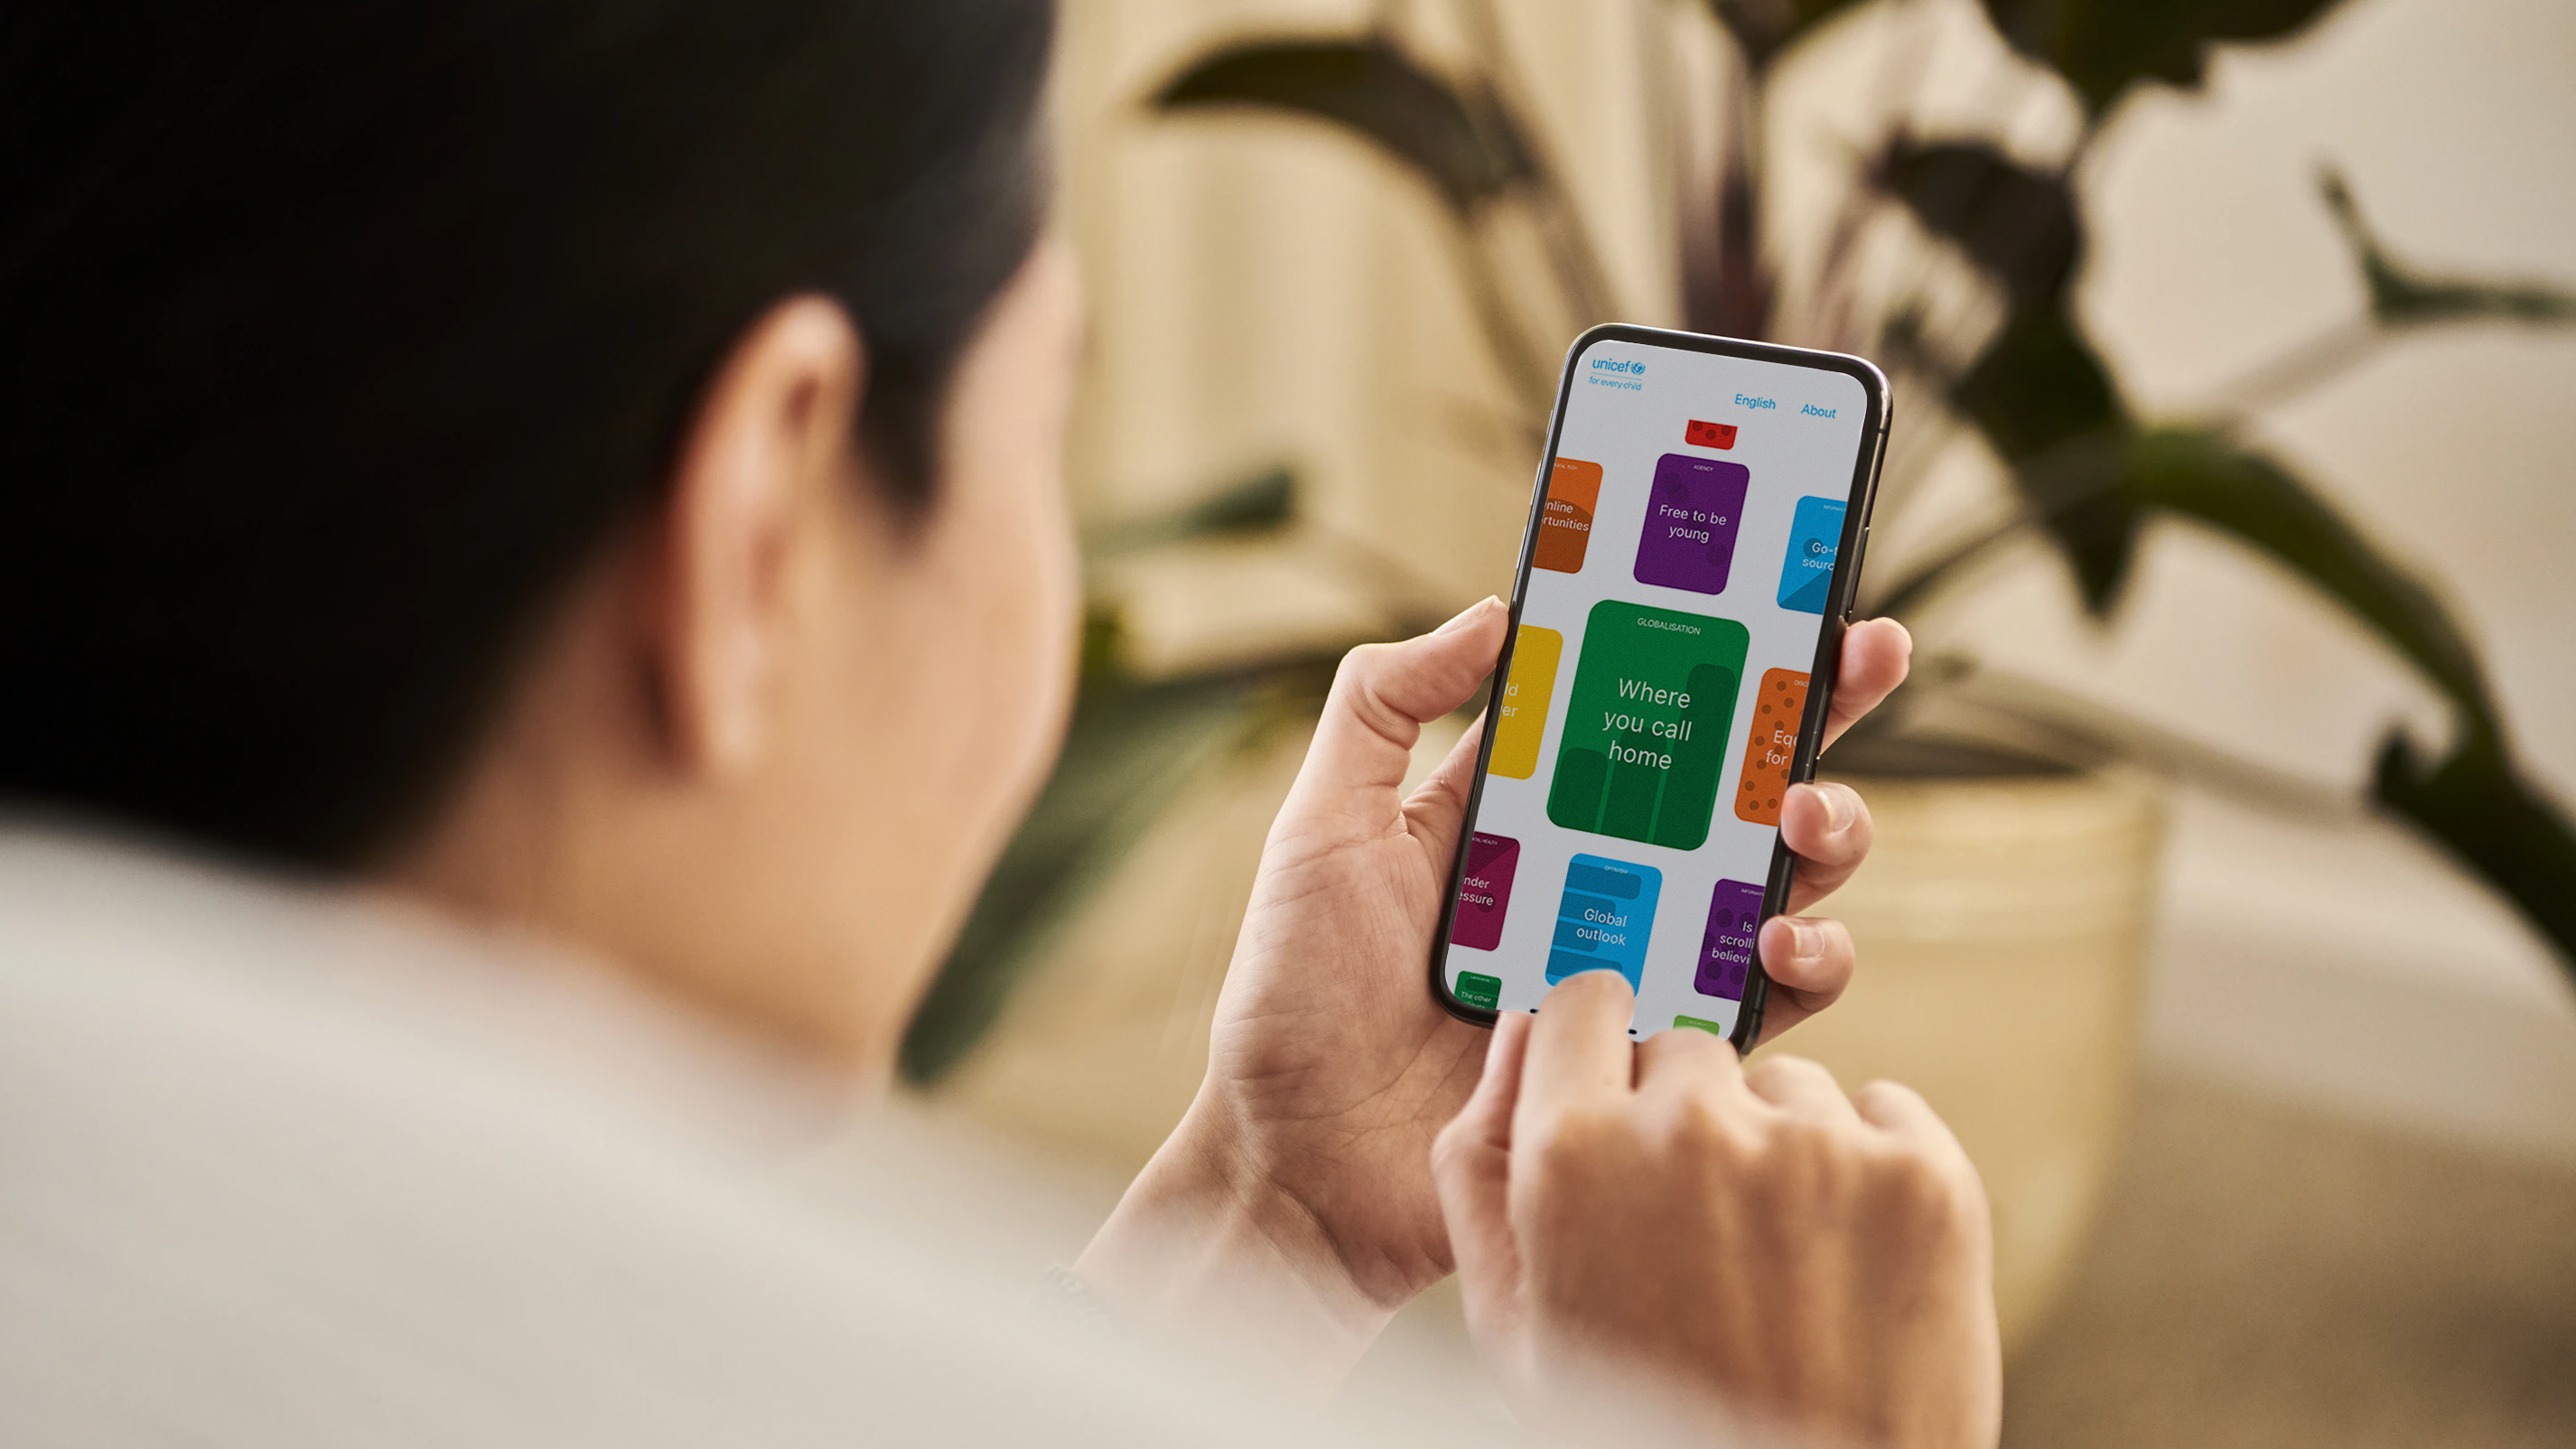
The layout of the cards grid was established having three main aspects in mind — accessibility, playfulness and good performance. We steered away from the initial idea to have an infinite number of cards in the grid and limited ourselves to as many cards as there are stories, which ensures an accessible experience and improved performance of the site.
We created several prototypes to test the envisioned playfulness and interaction.
Solution
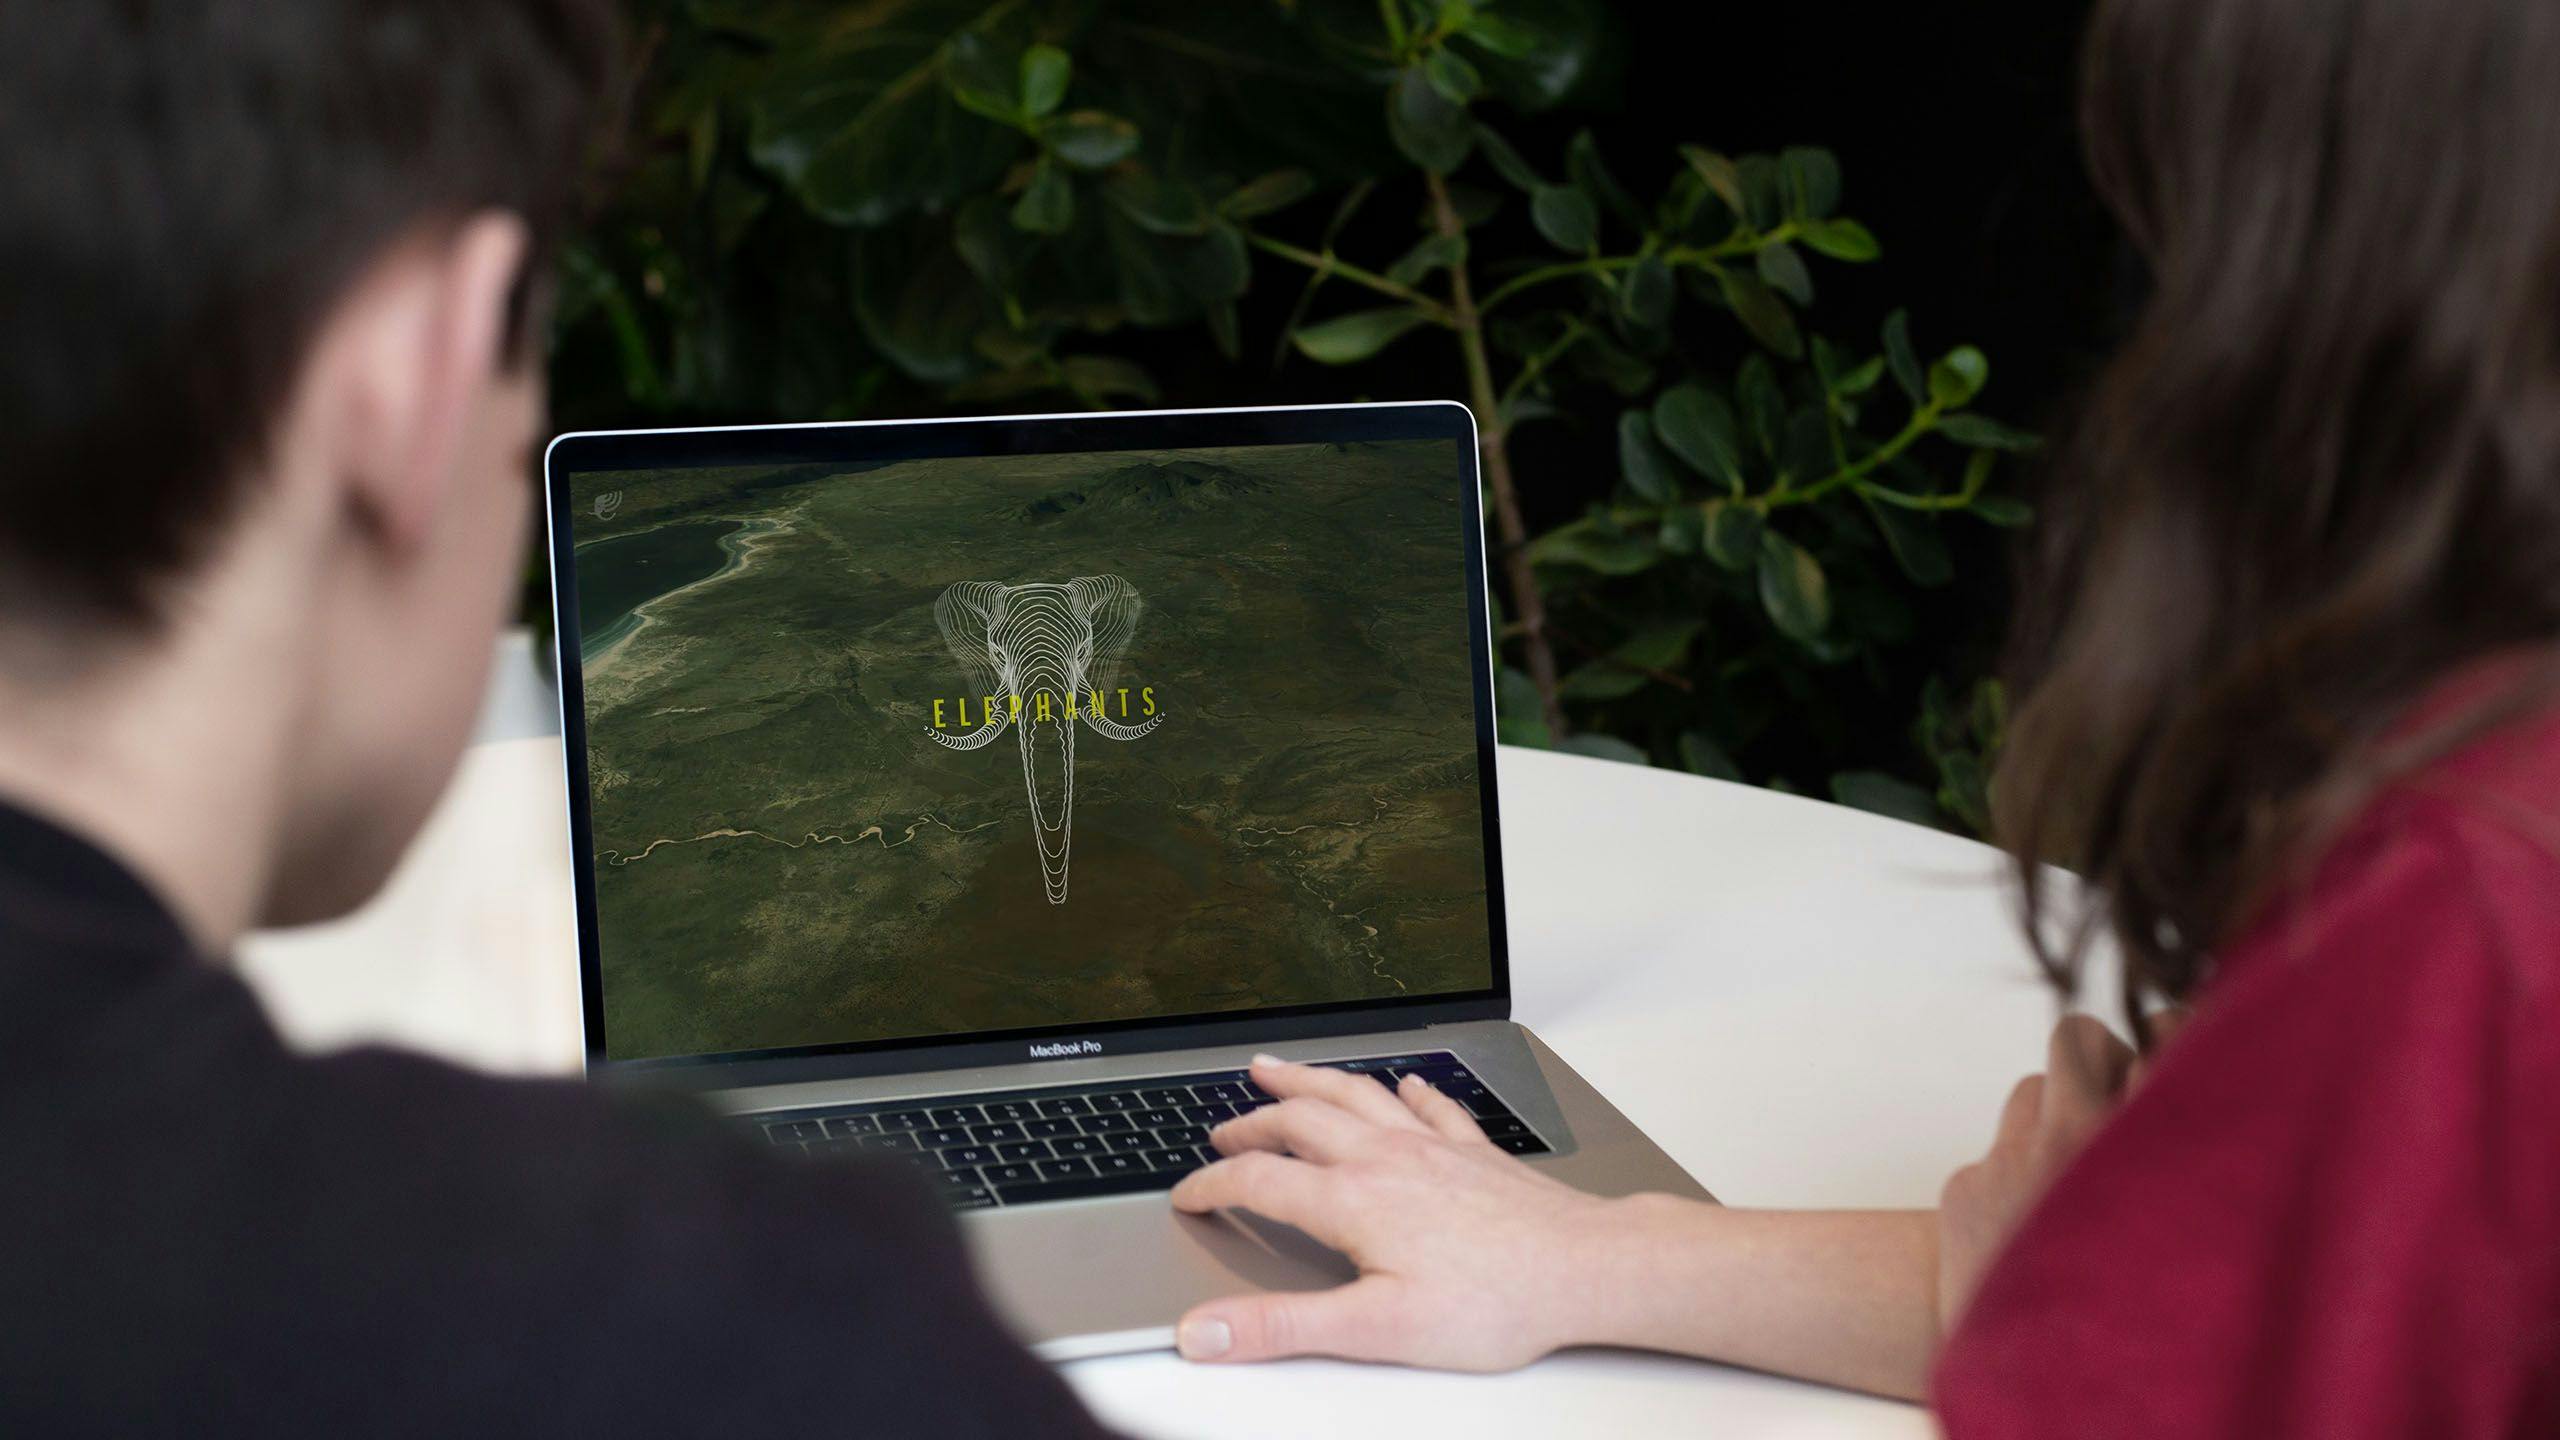
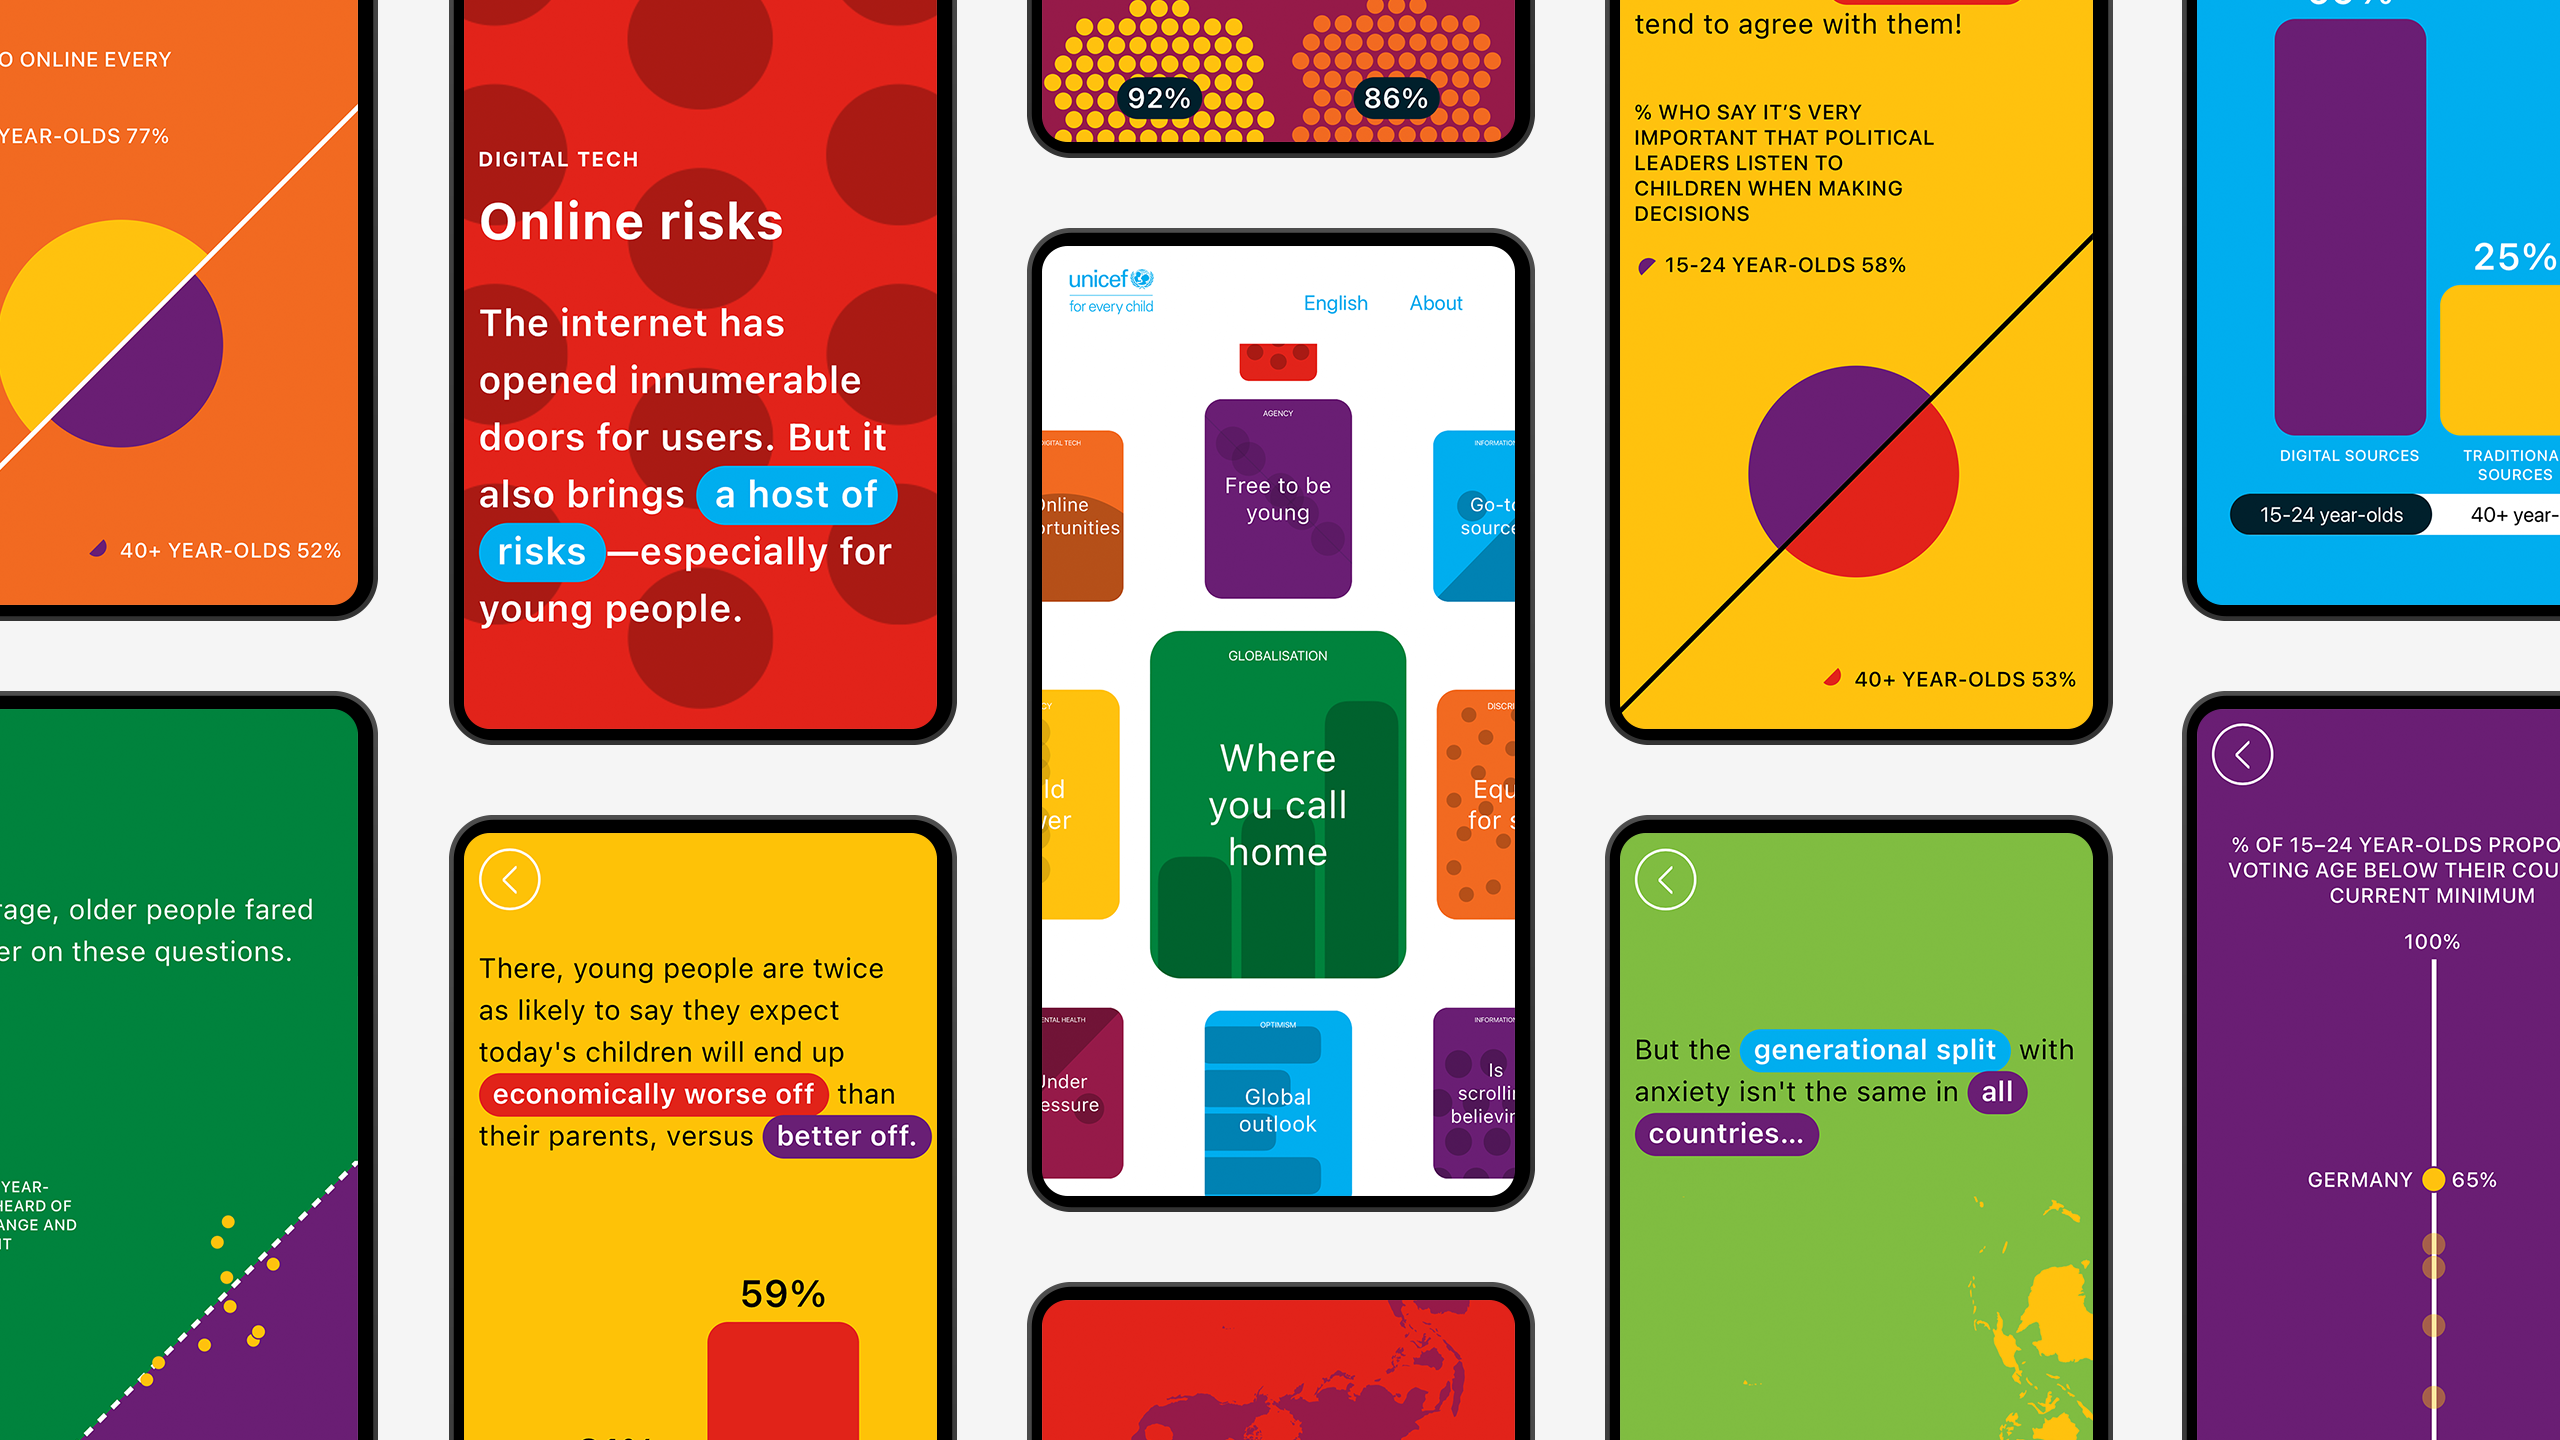
We set the design principles by looking into today’s internet usage trends. For many teenagers, the use of the internet often consists of browsing and scrolling through fun, engaging, easy-to-digest content.
For this reason, our solution was a platform that narrates survey results in a light, appealing and inspiring way.
We chose playful visual elements to give a hopeful and optimistic feel to the project.
Roel de Jonge / Lead Visual Designer at CLEVER°FRANKE
Datavisualization—thematicexploration
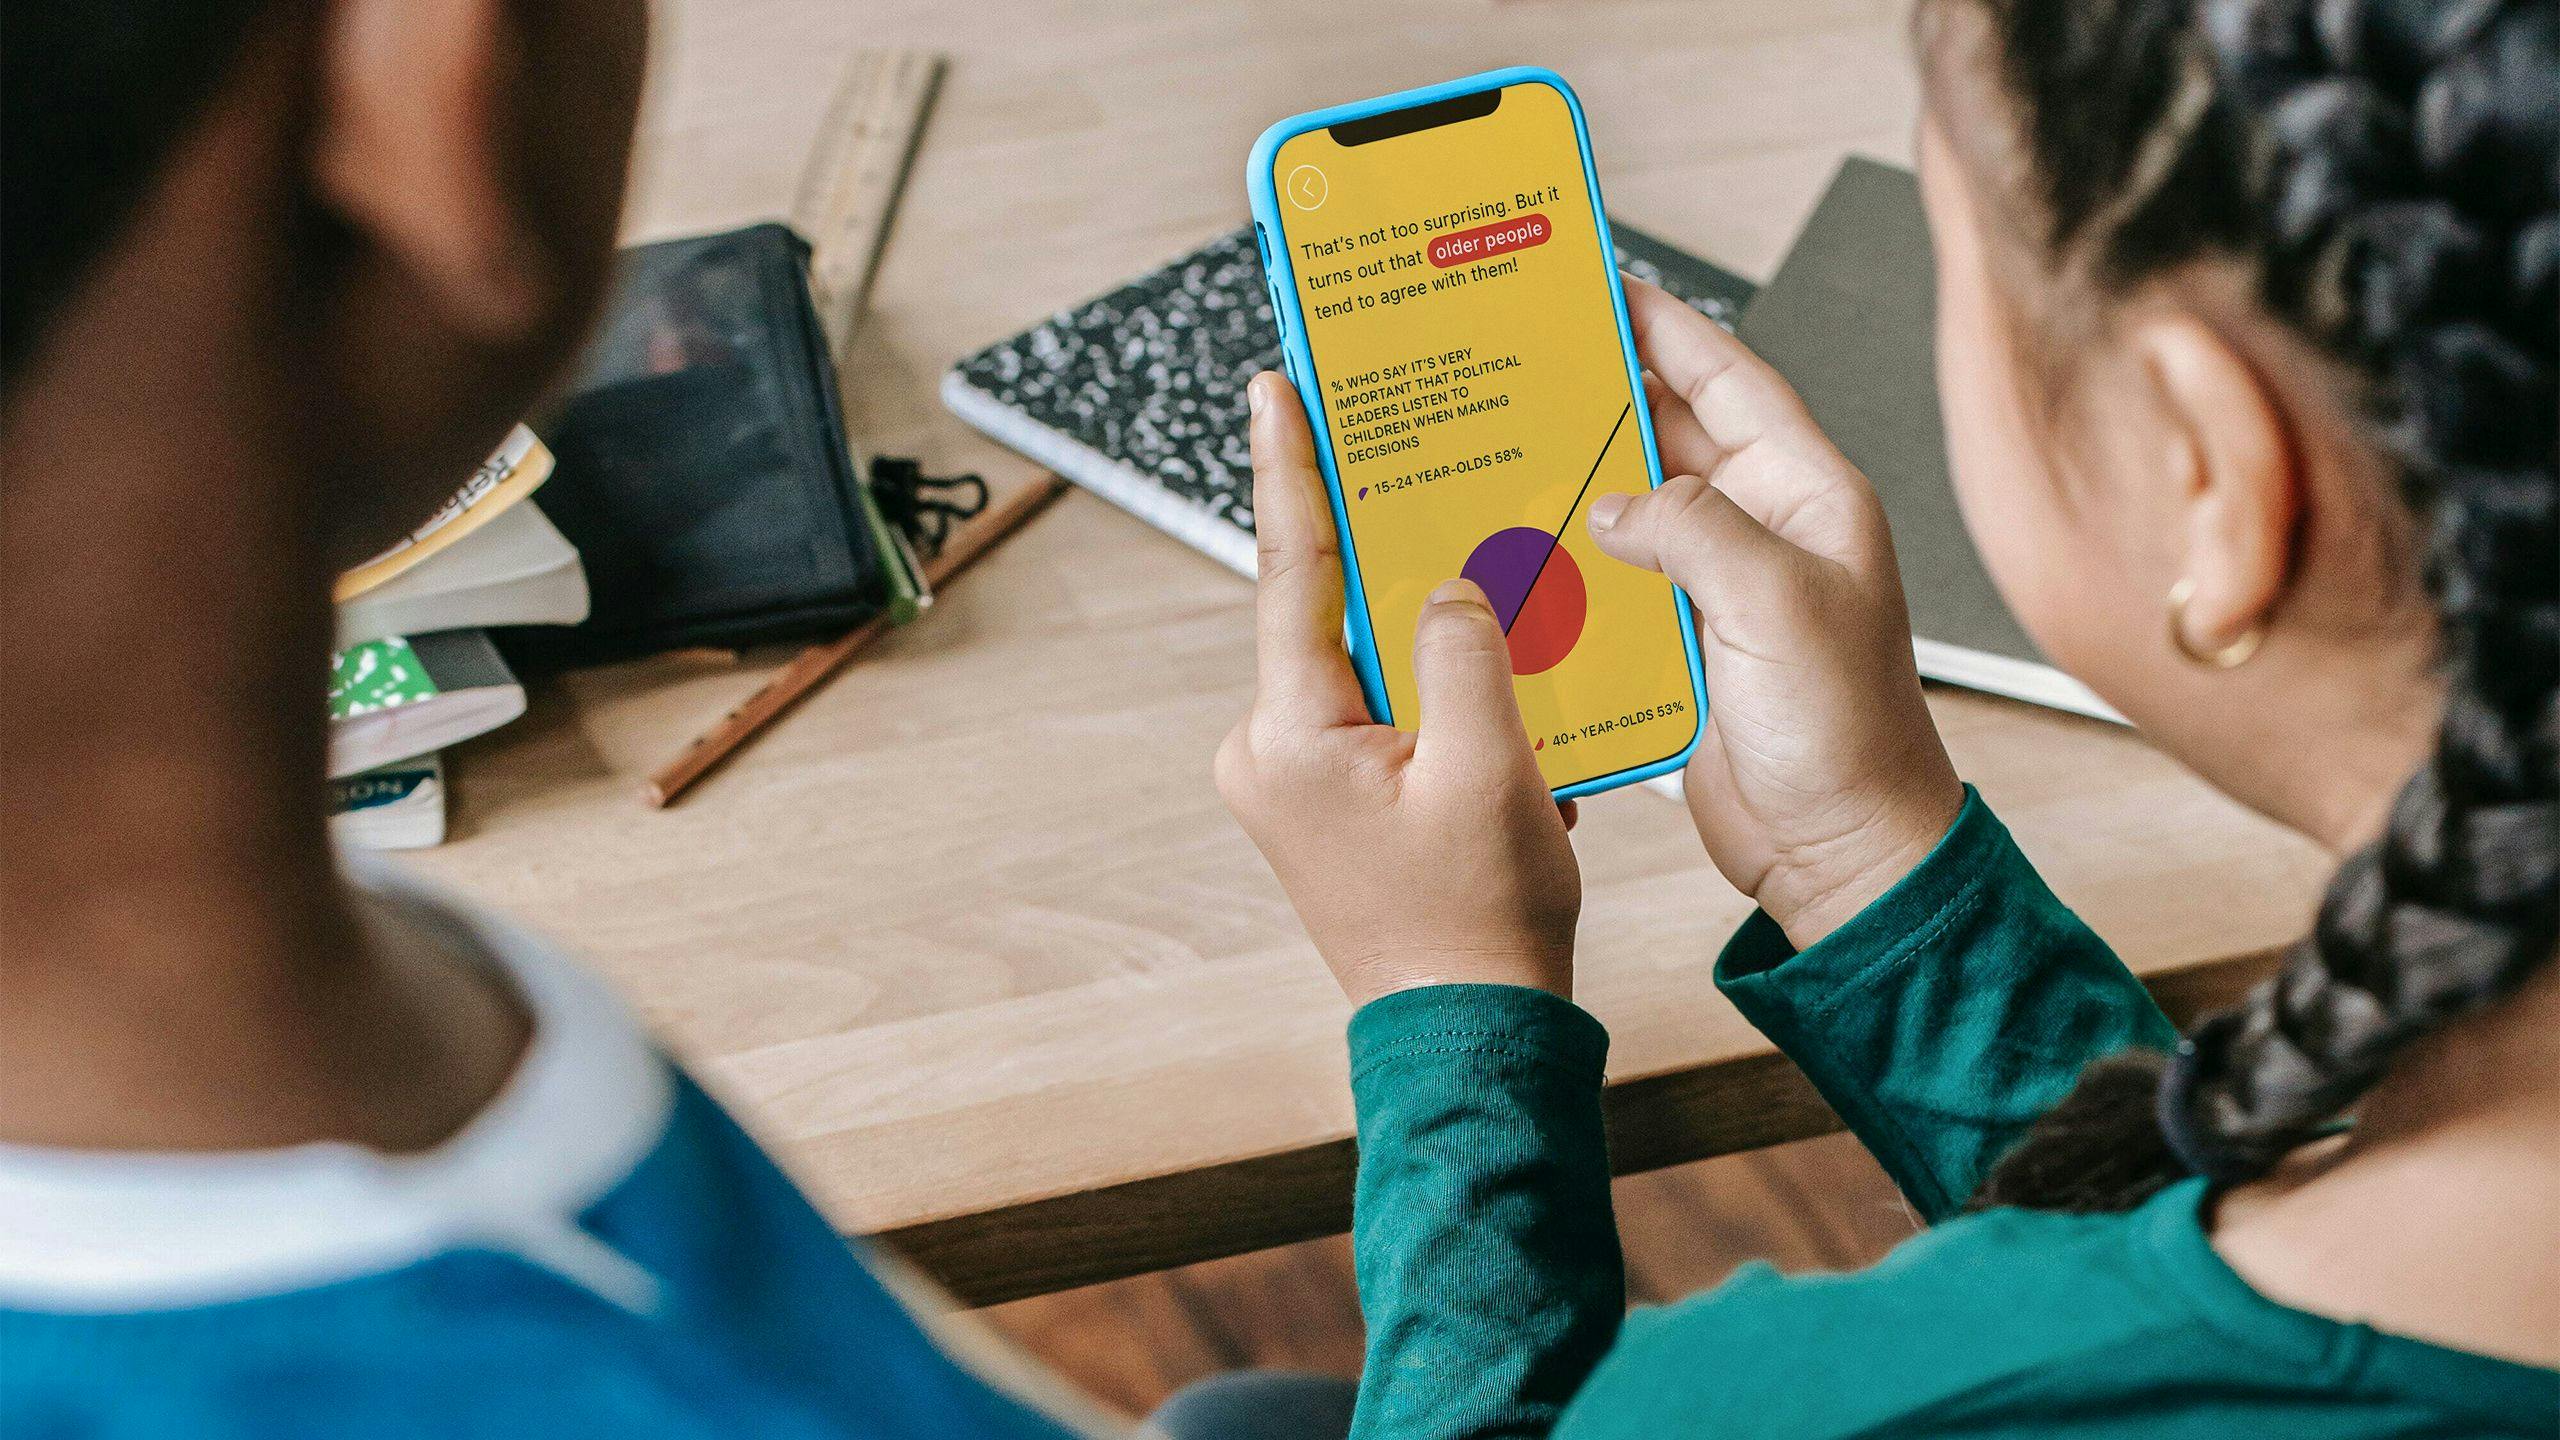
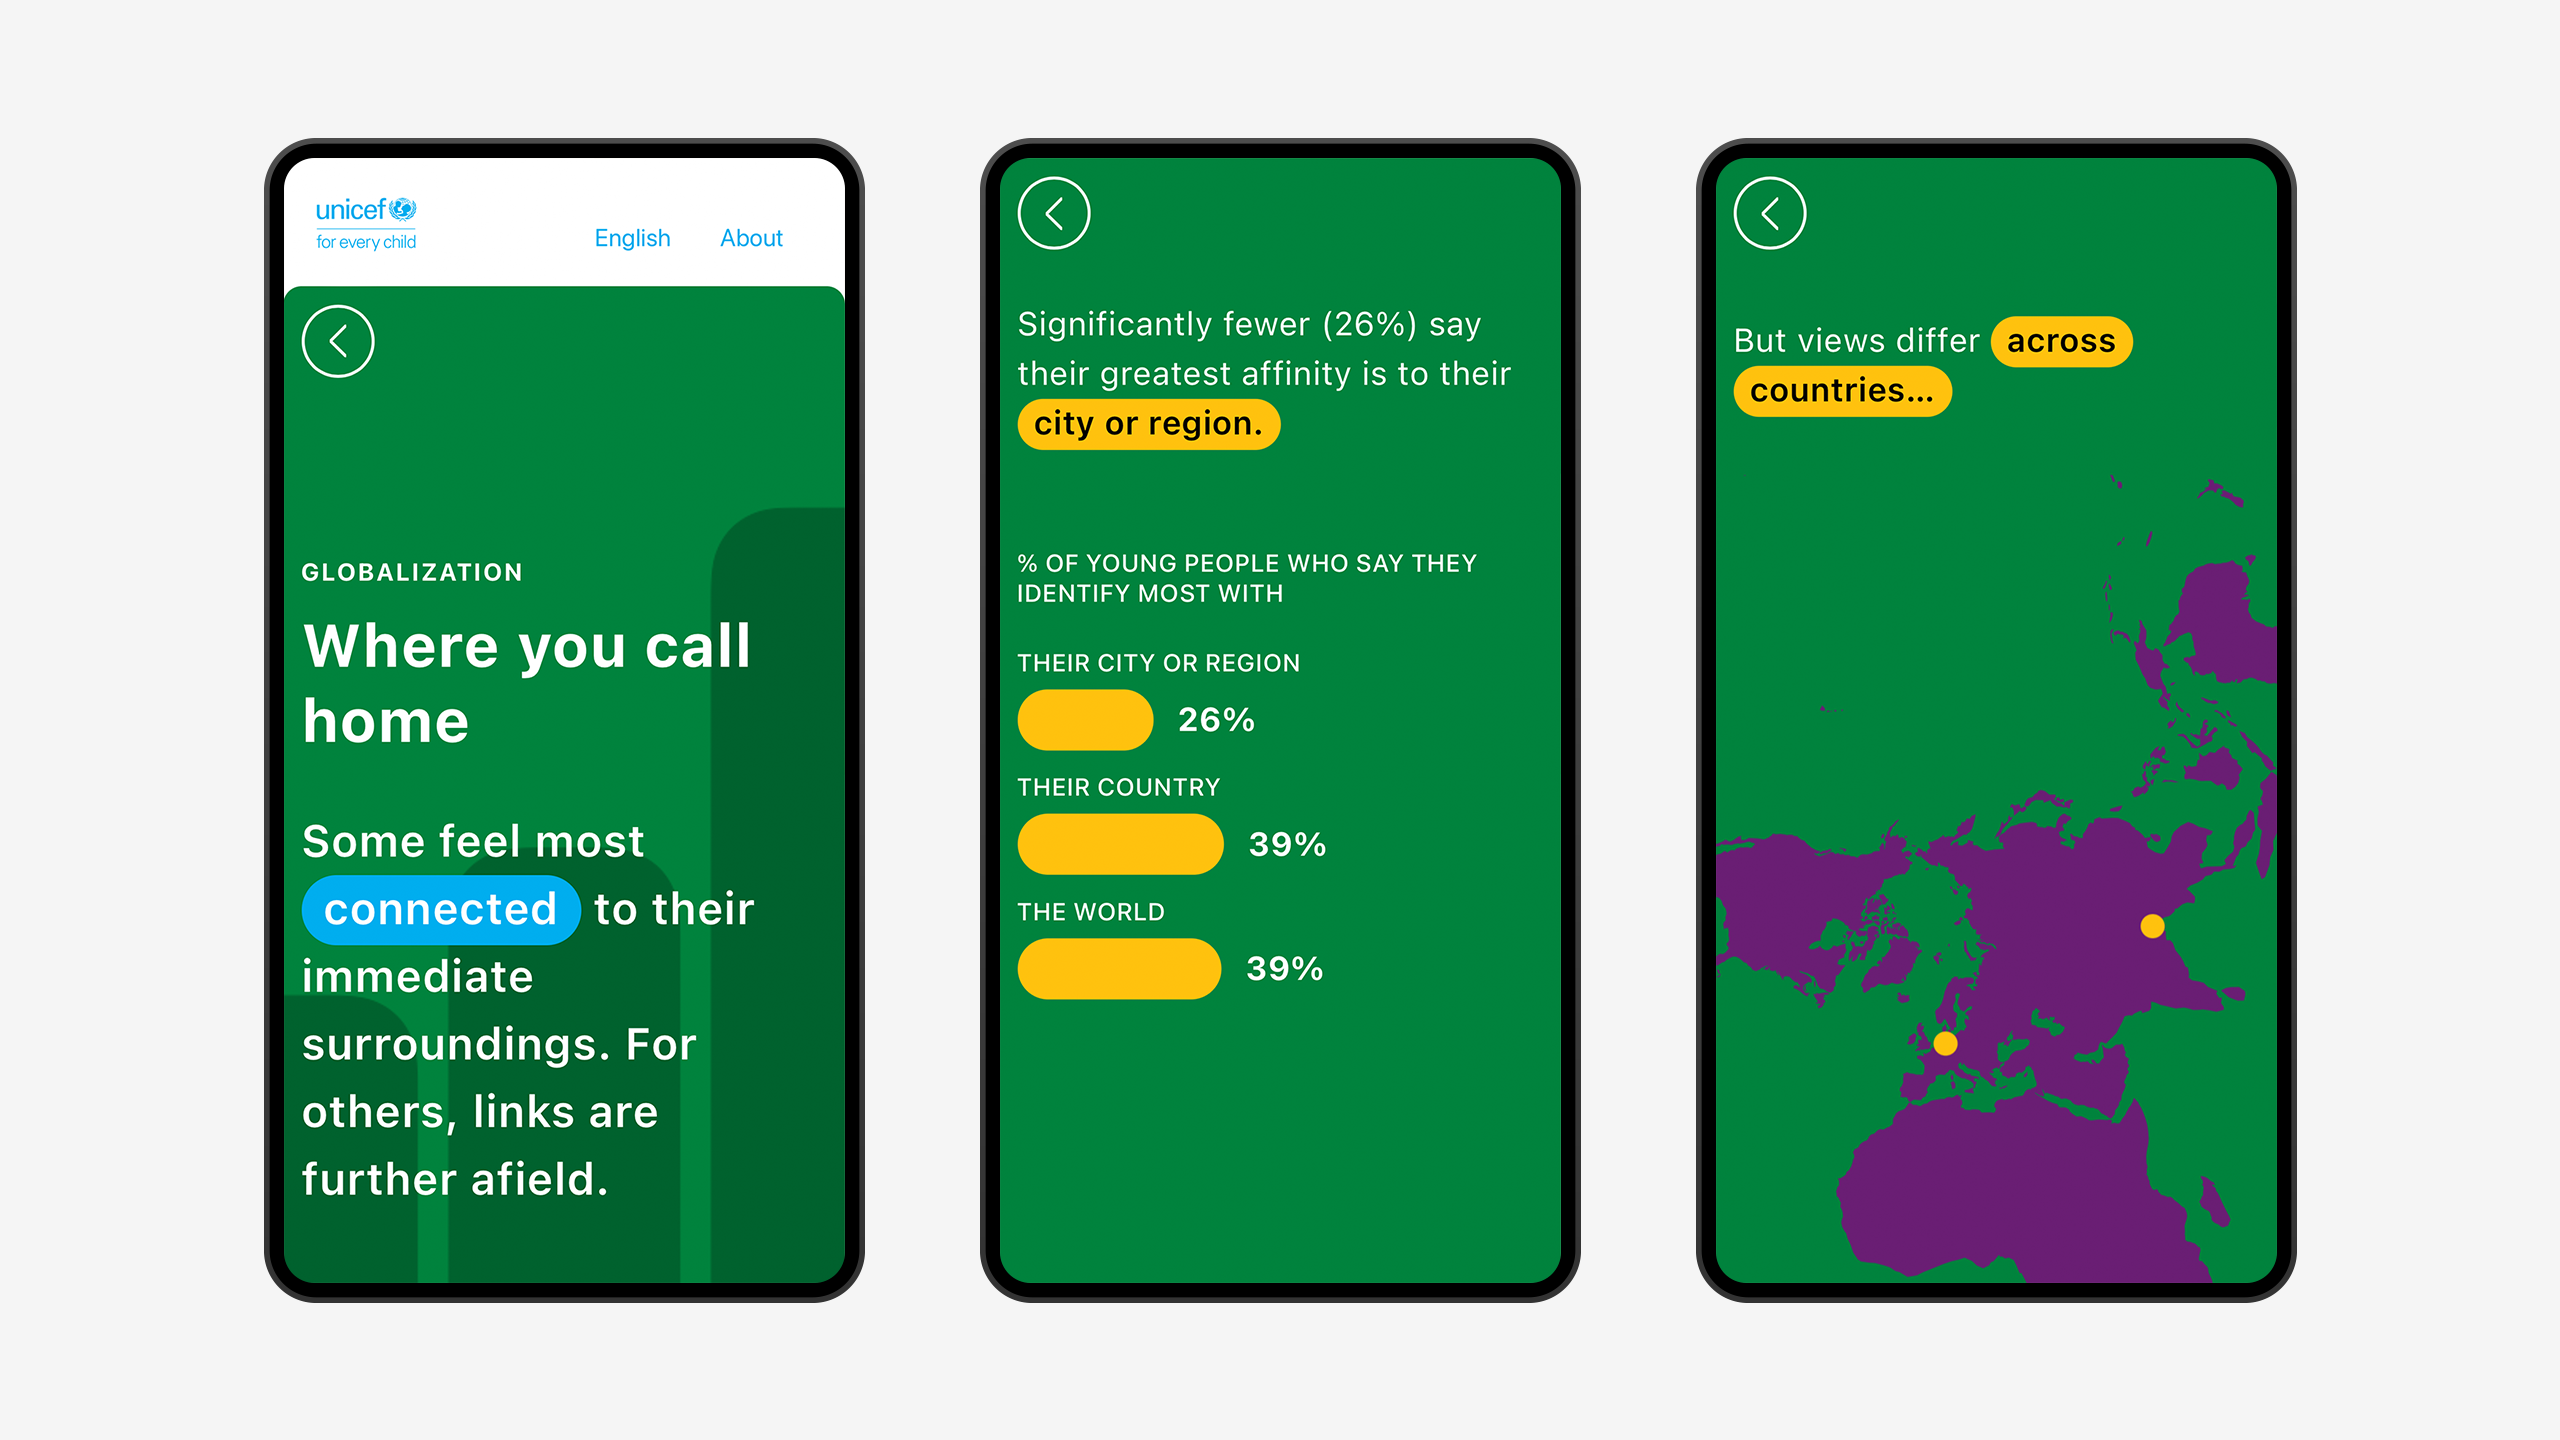
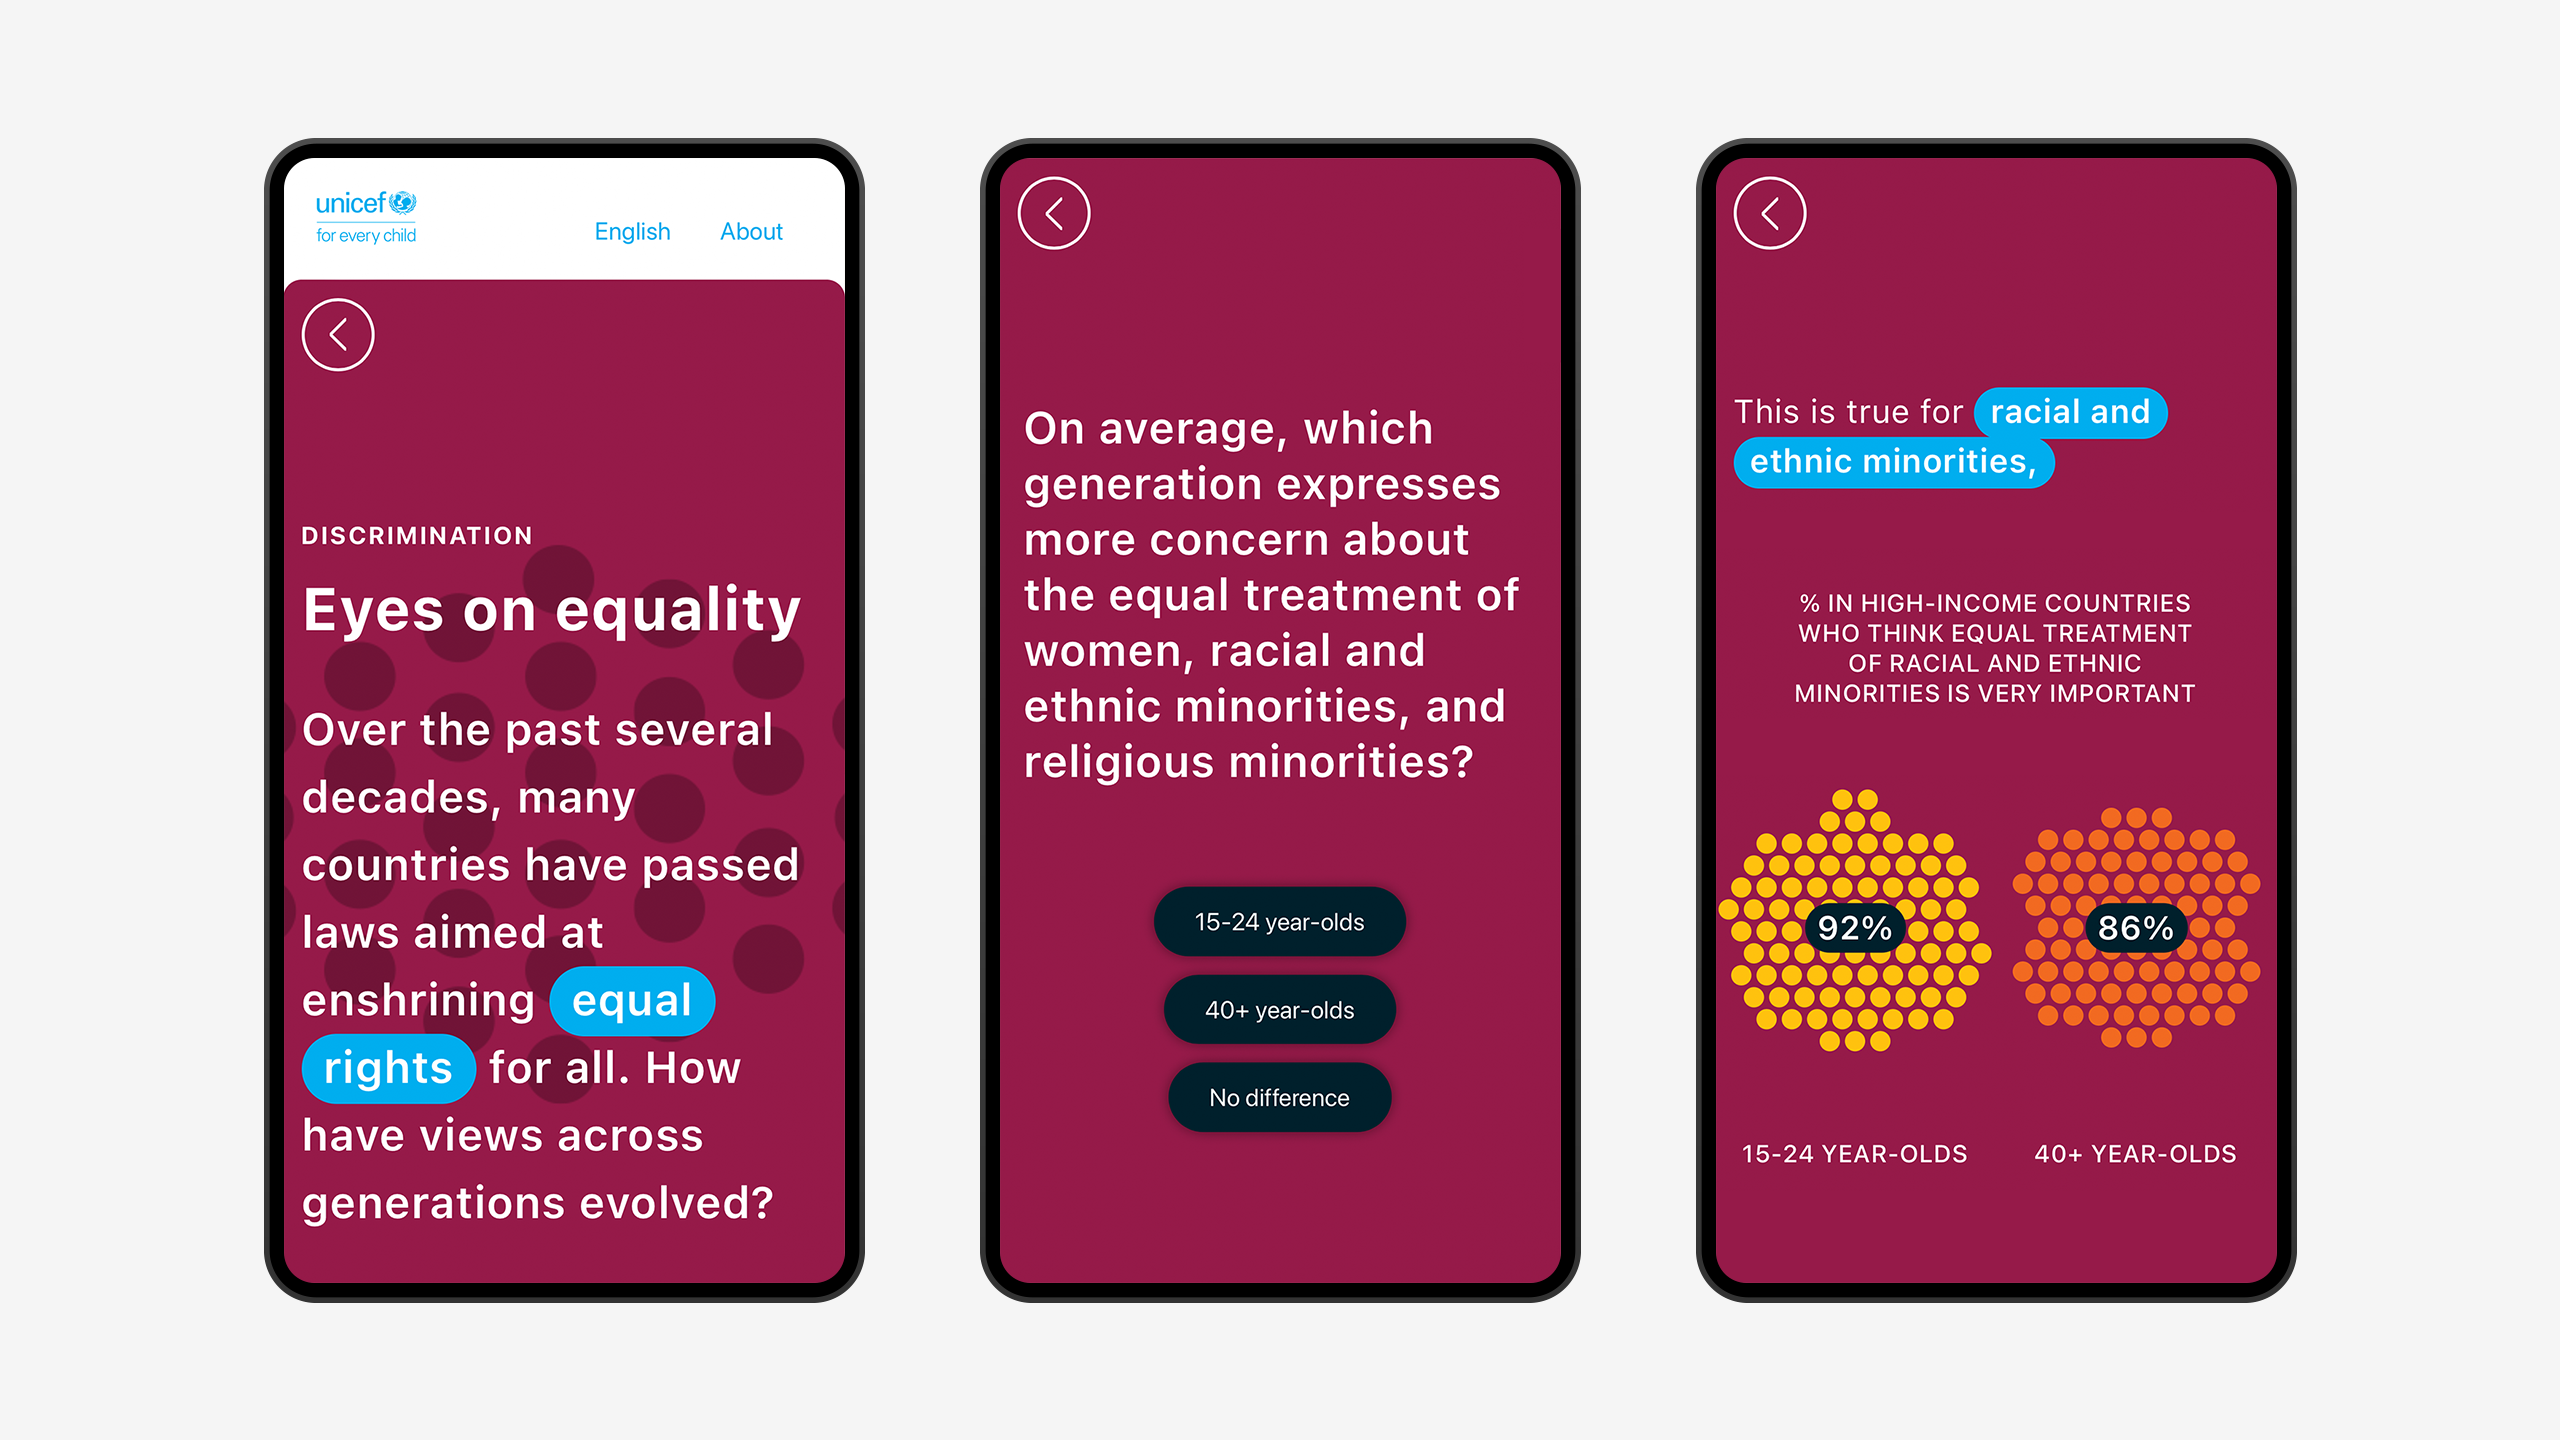
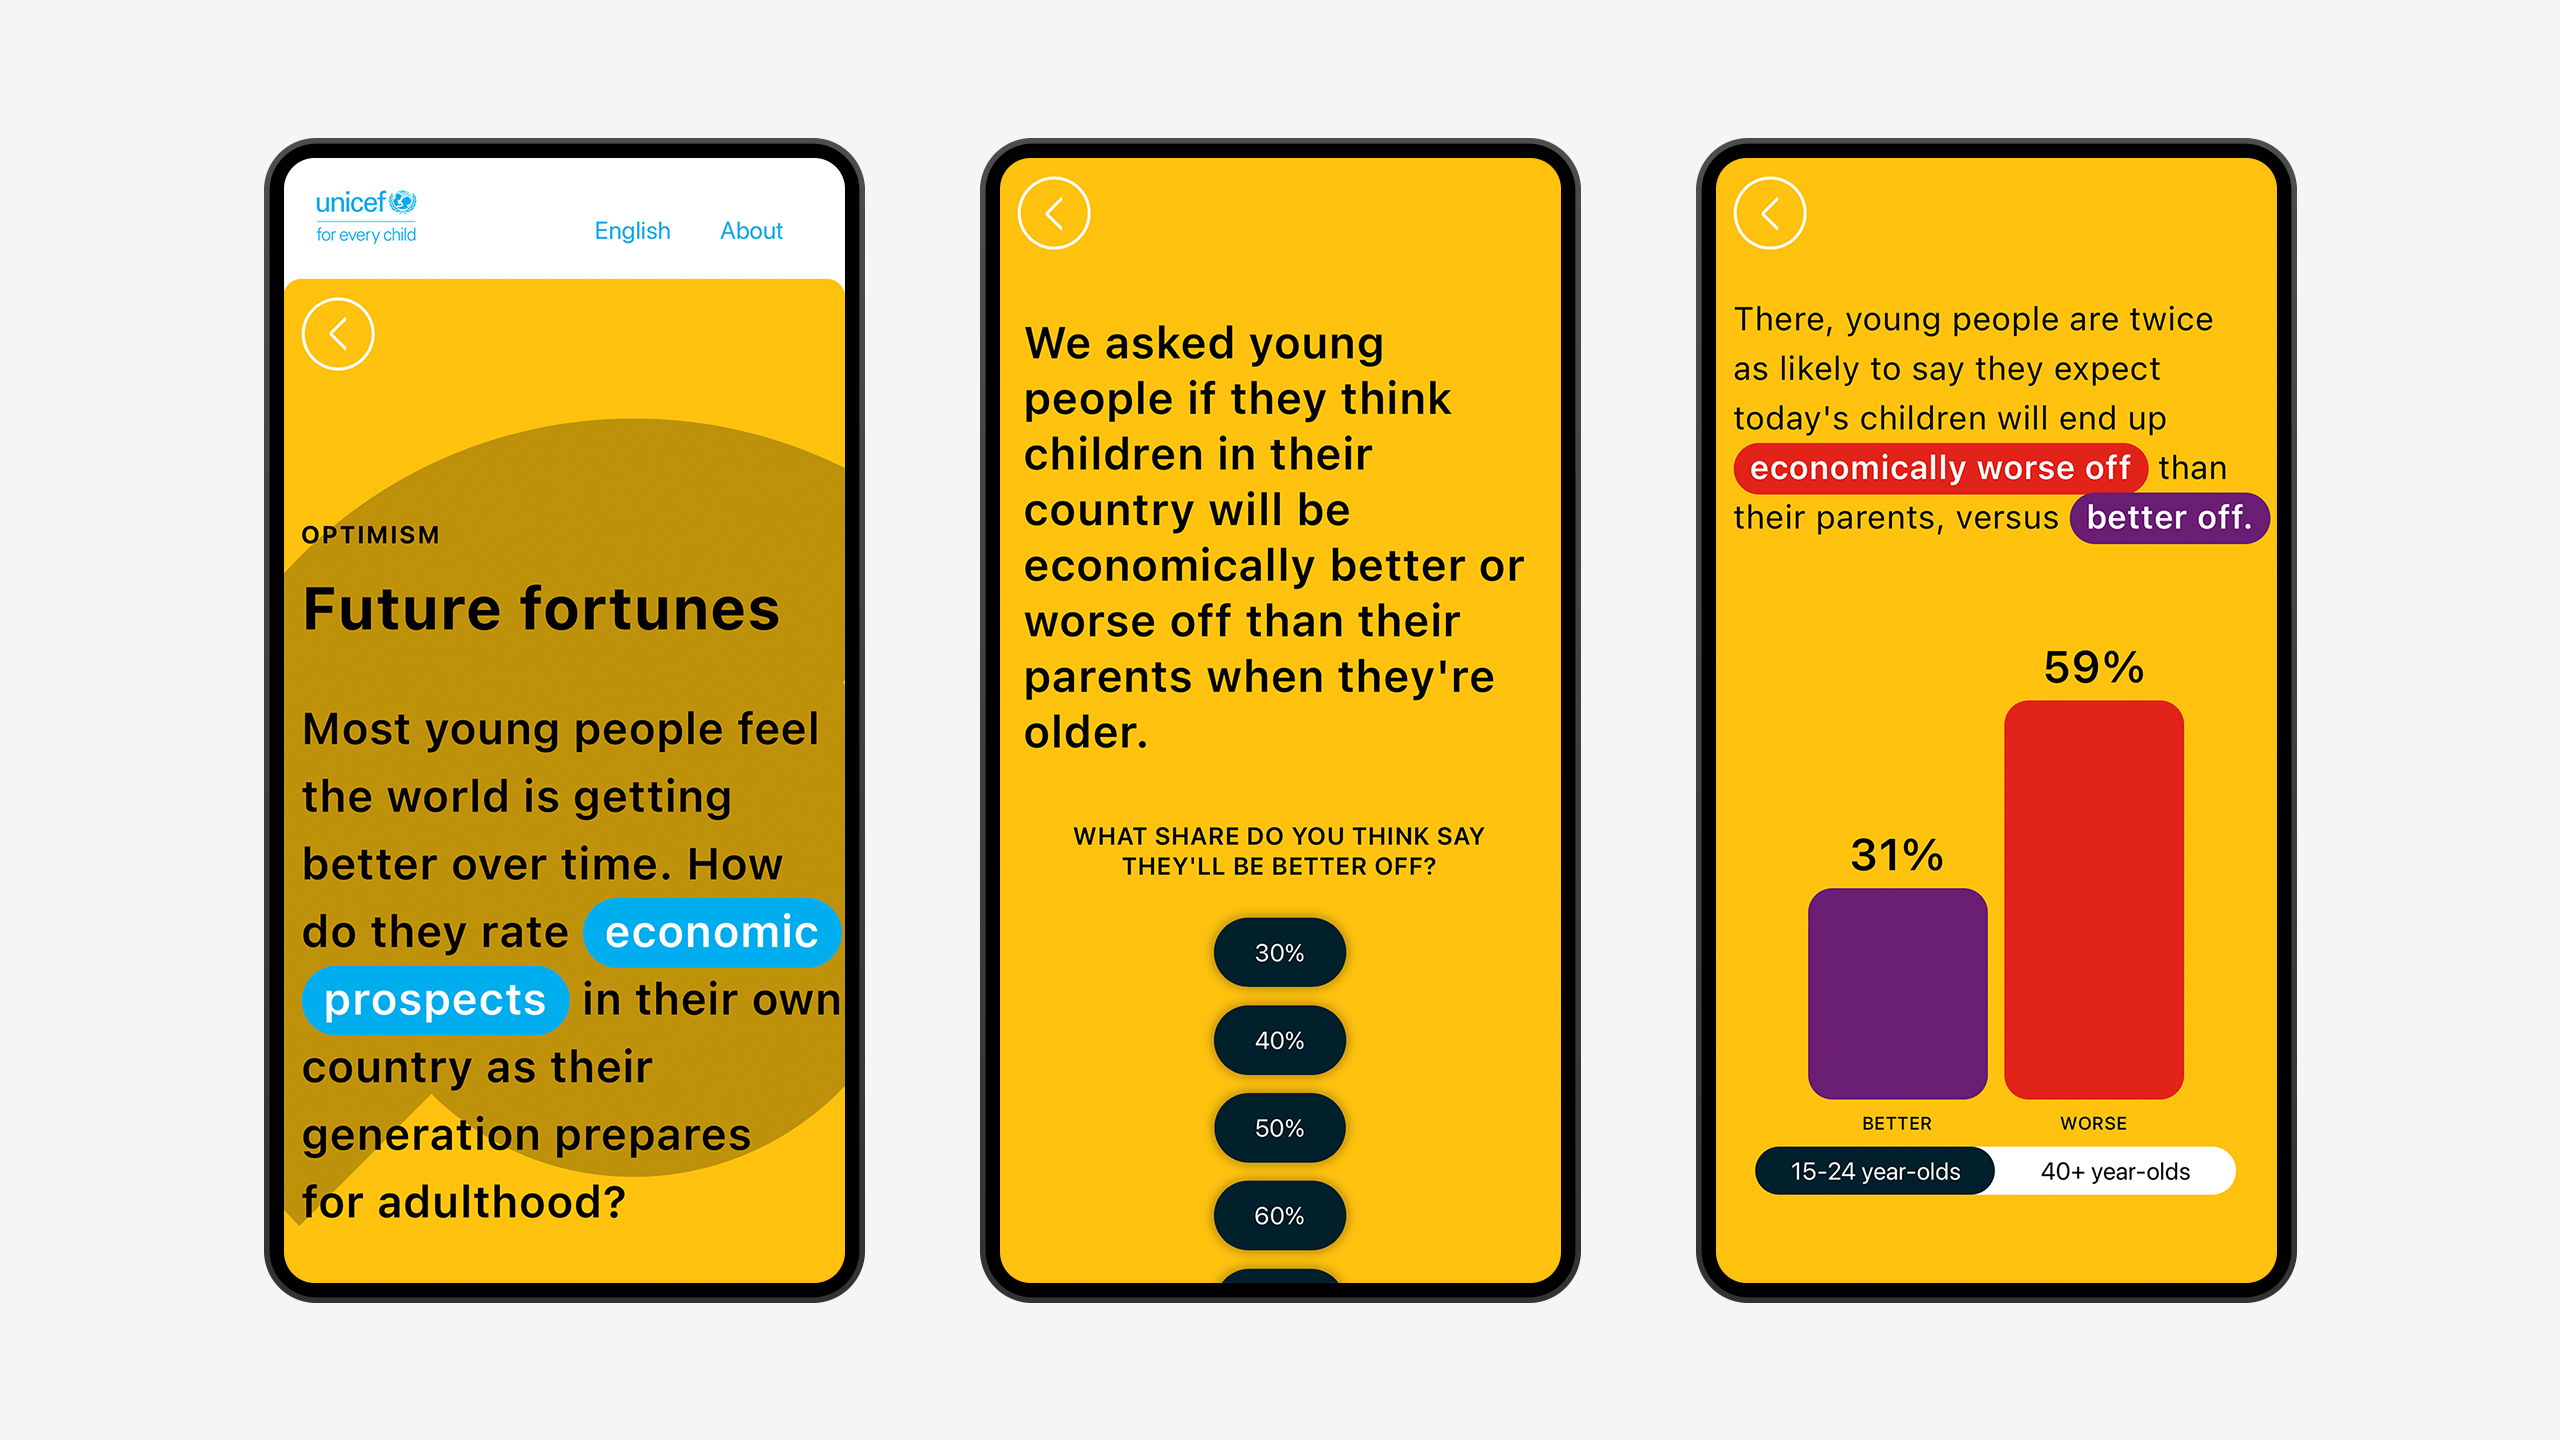
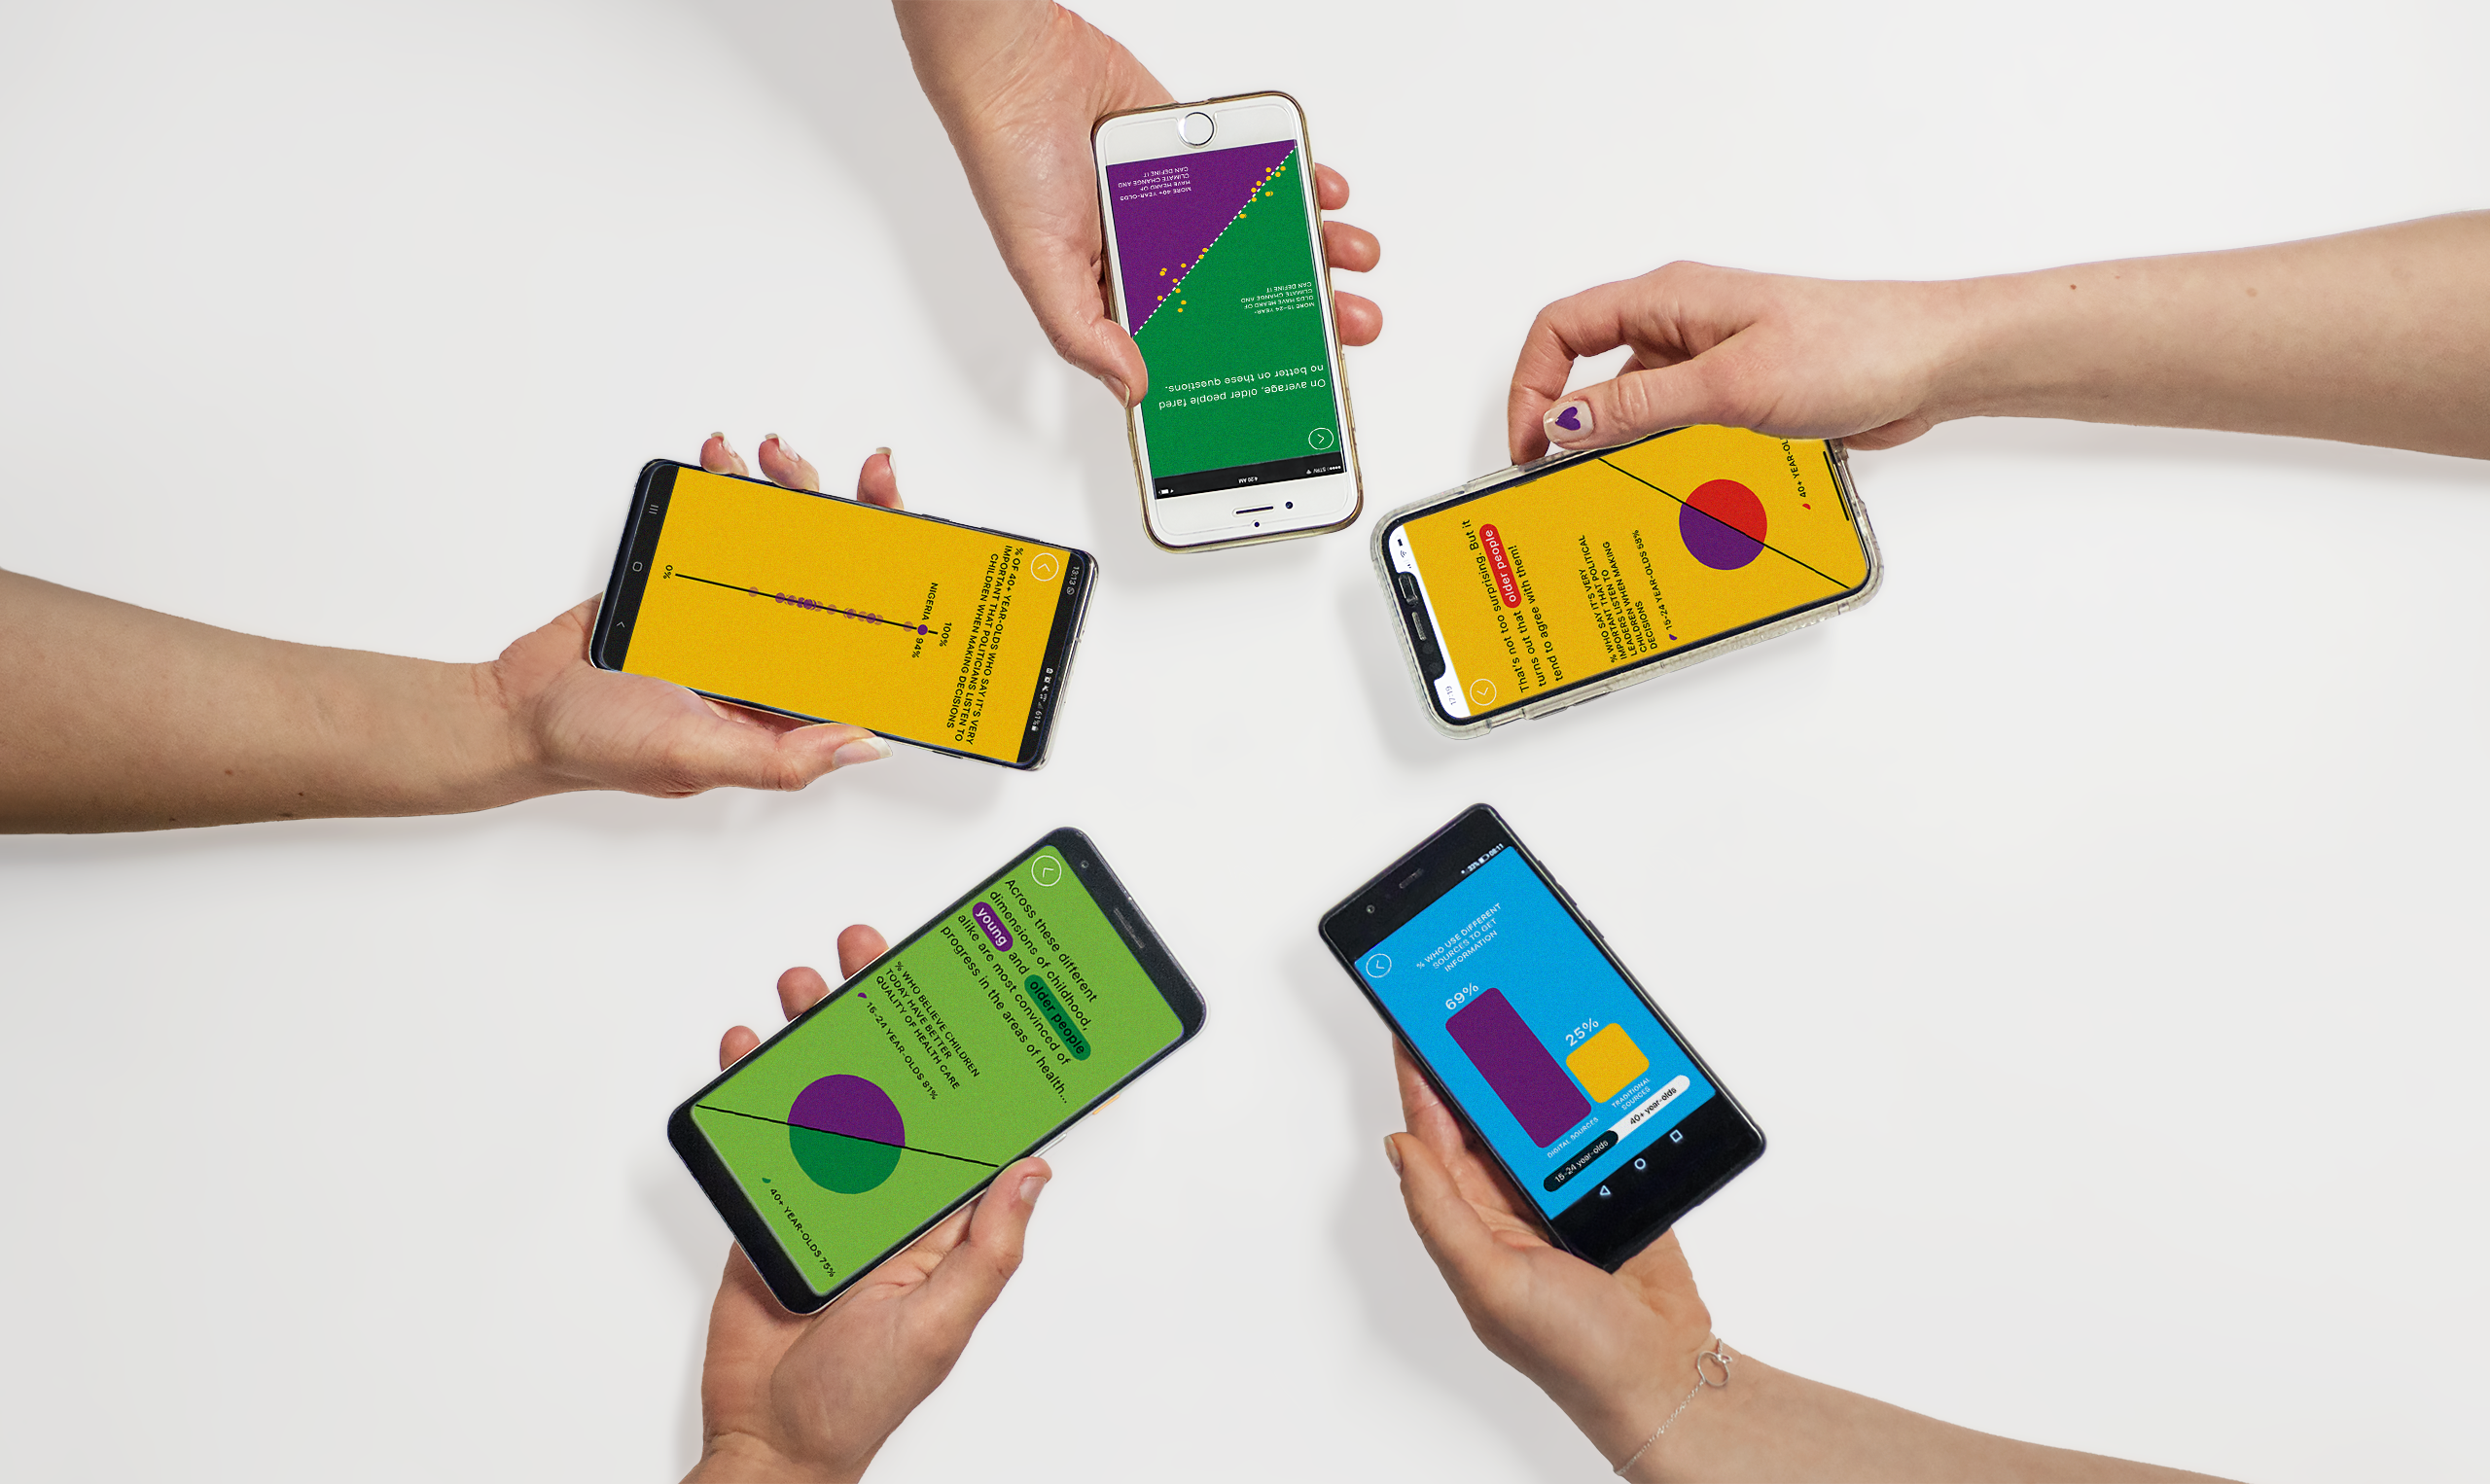
To visualize survey data, survey results were grouped into different themes. Each theme is presented in a form of a short, snappy and engaging microstory, which allows for independent exploration based on the user’s interests.
Encouragingengagement
An important aspect of the platform is that it encourages engagement. The user is able to compare and explore the data through interactive visualizations and in turn reflect and relate to survey results.
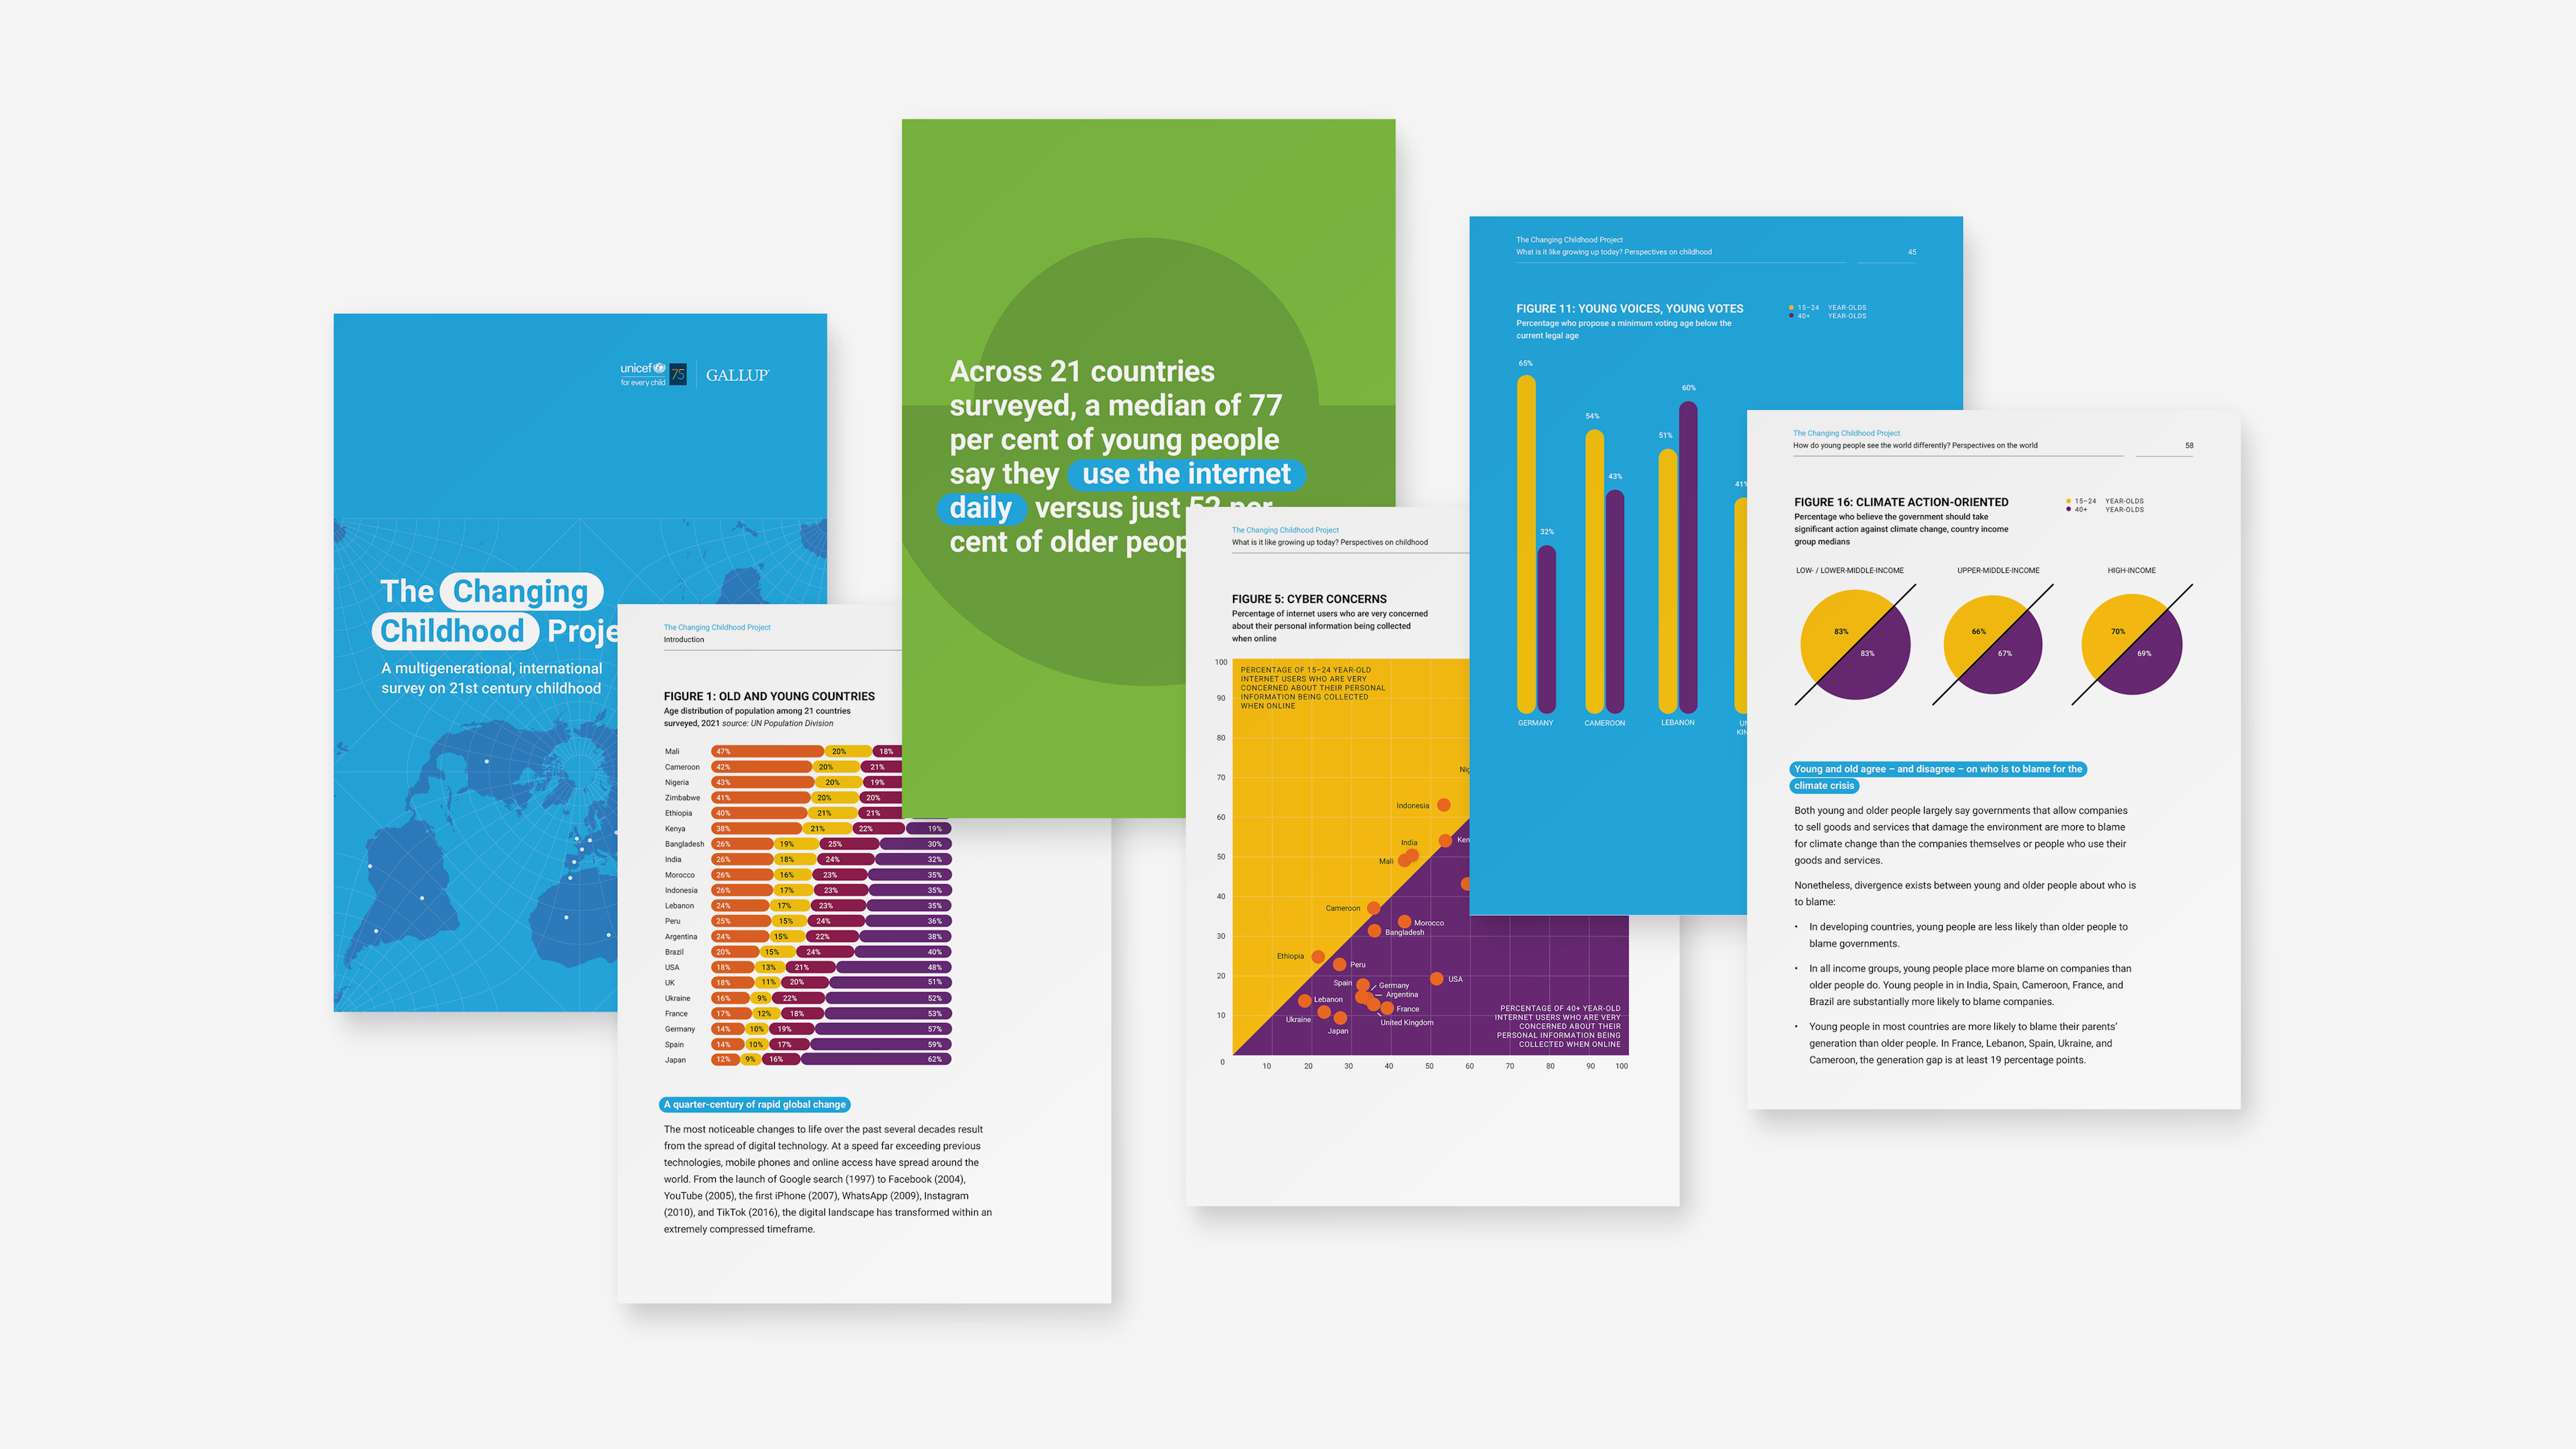
Report
Besides the microsite, we have also delivered a designed report. It dives even deeper into the subject and provides more detailed information for policymakers and journalists in decision-making.
Accessibility
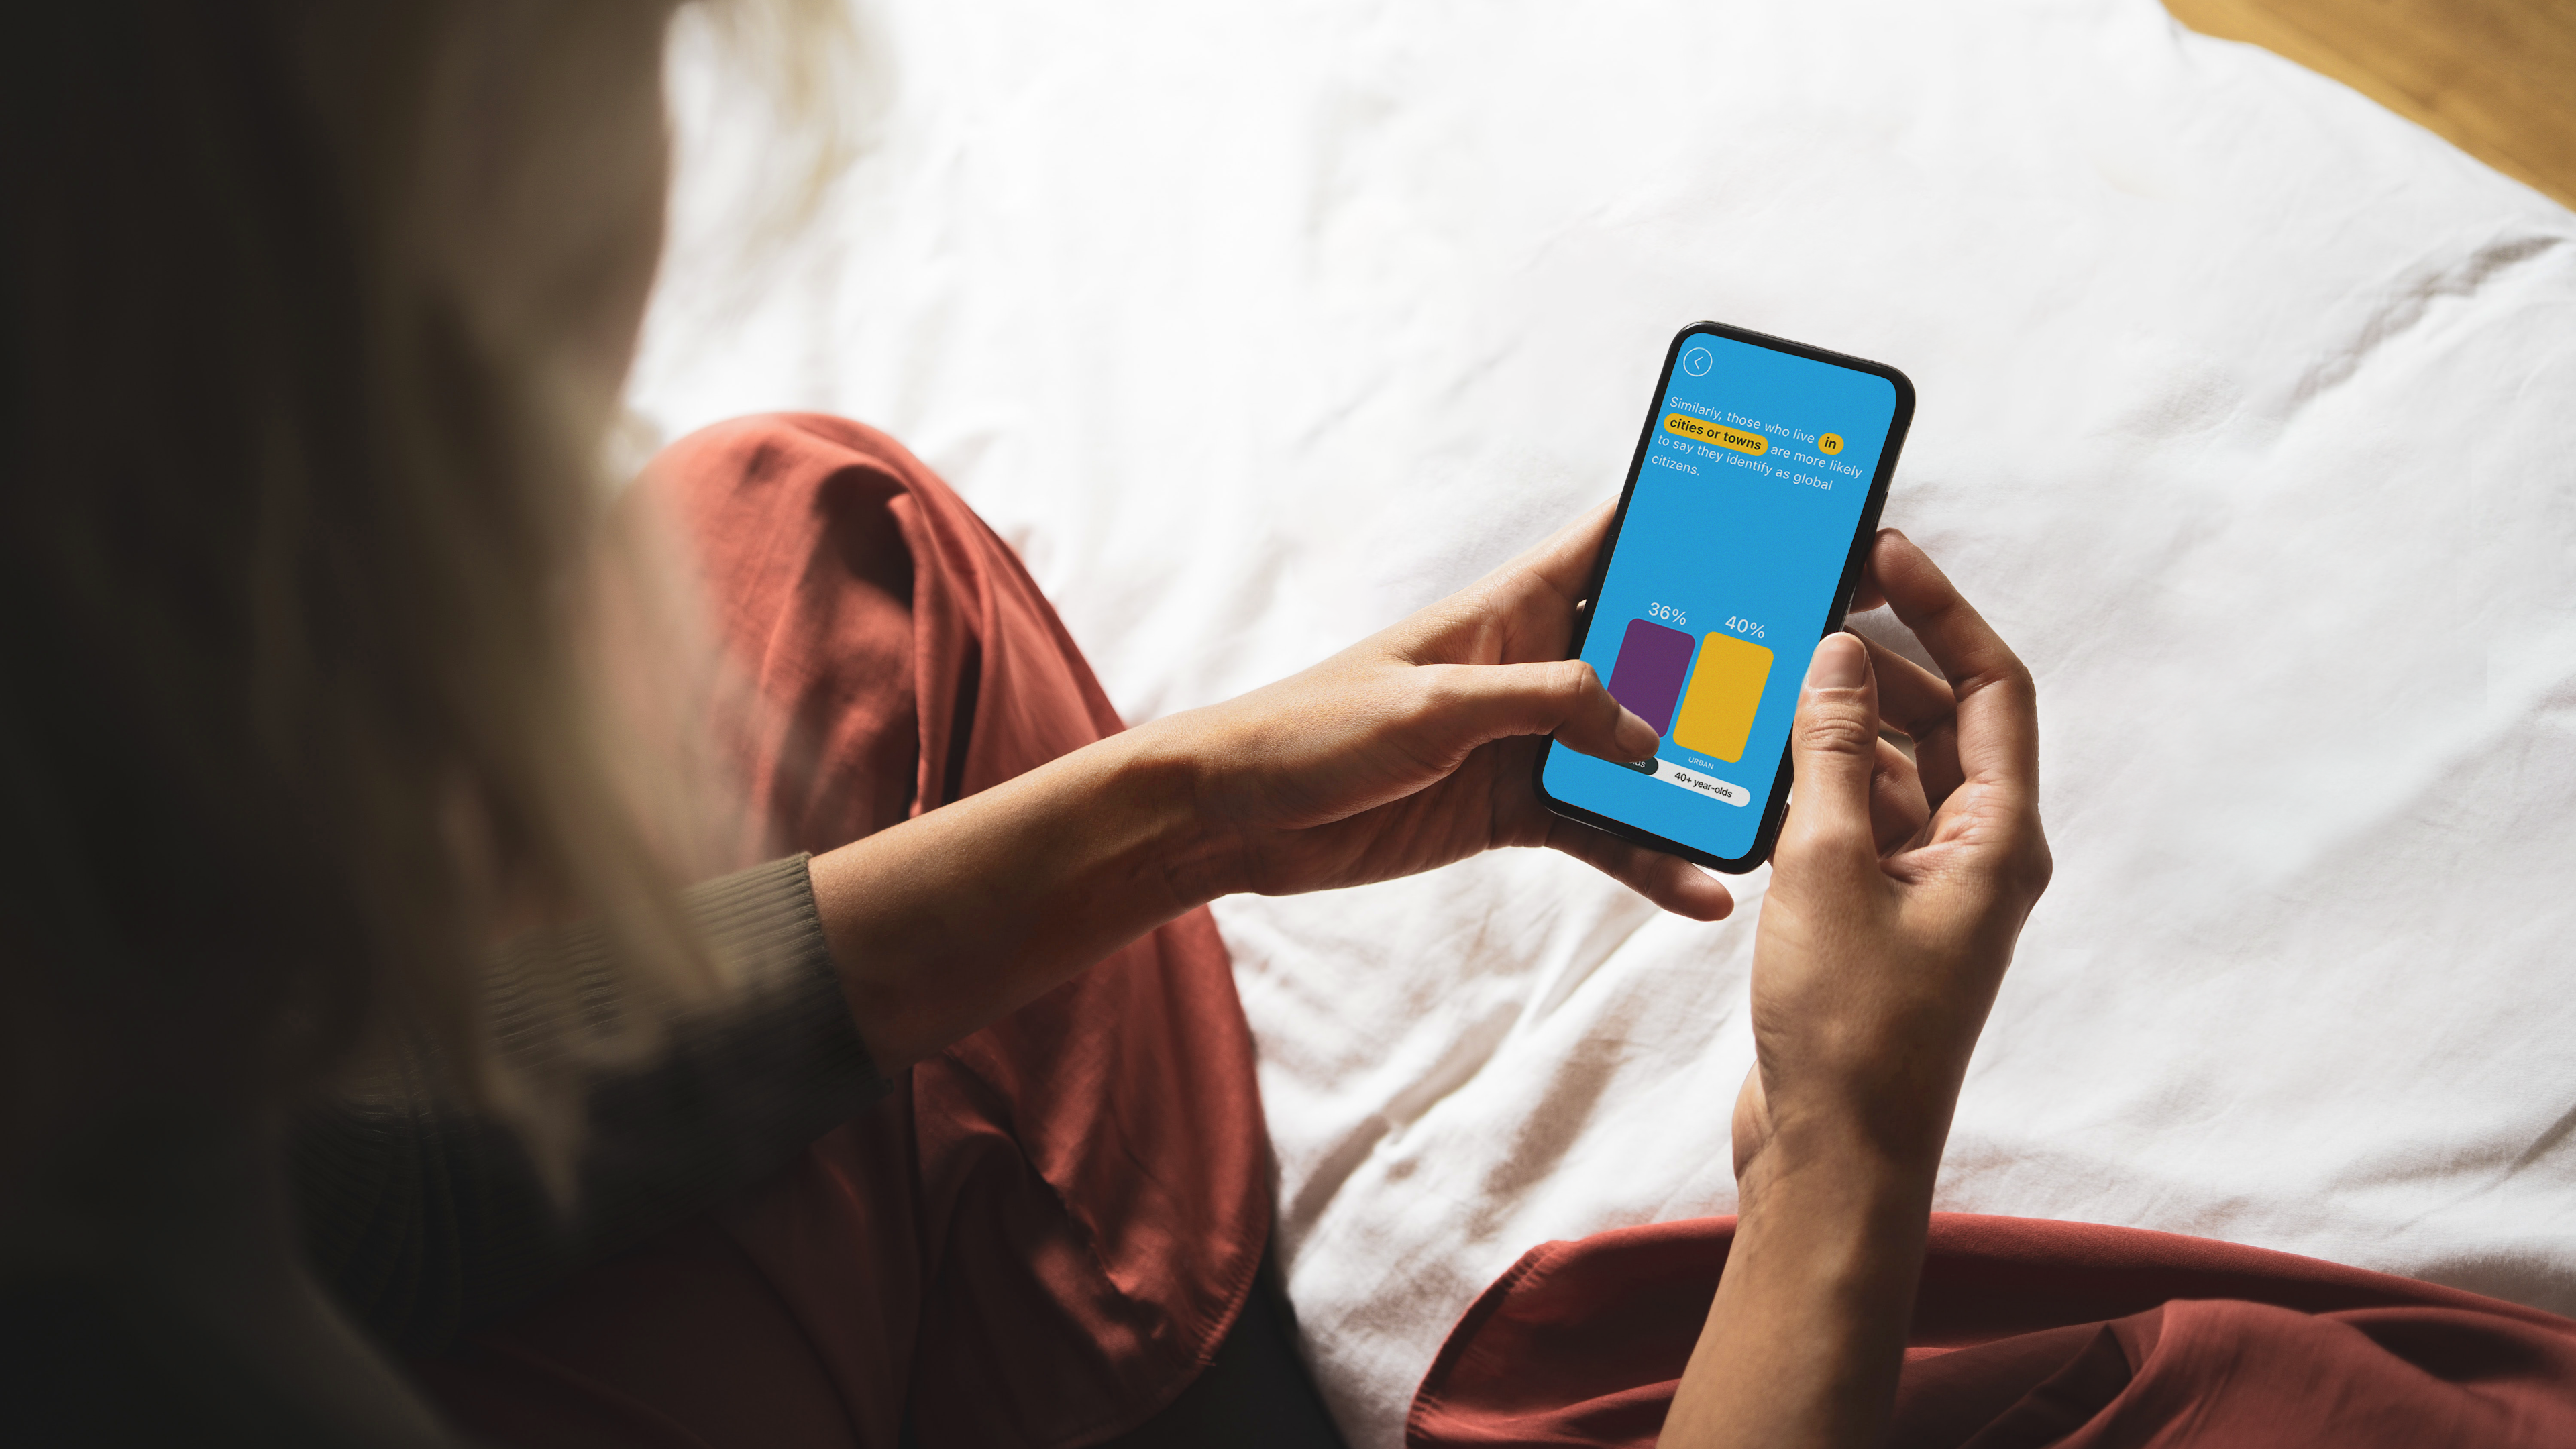
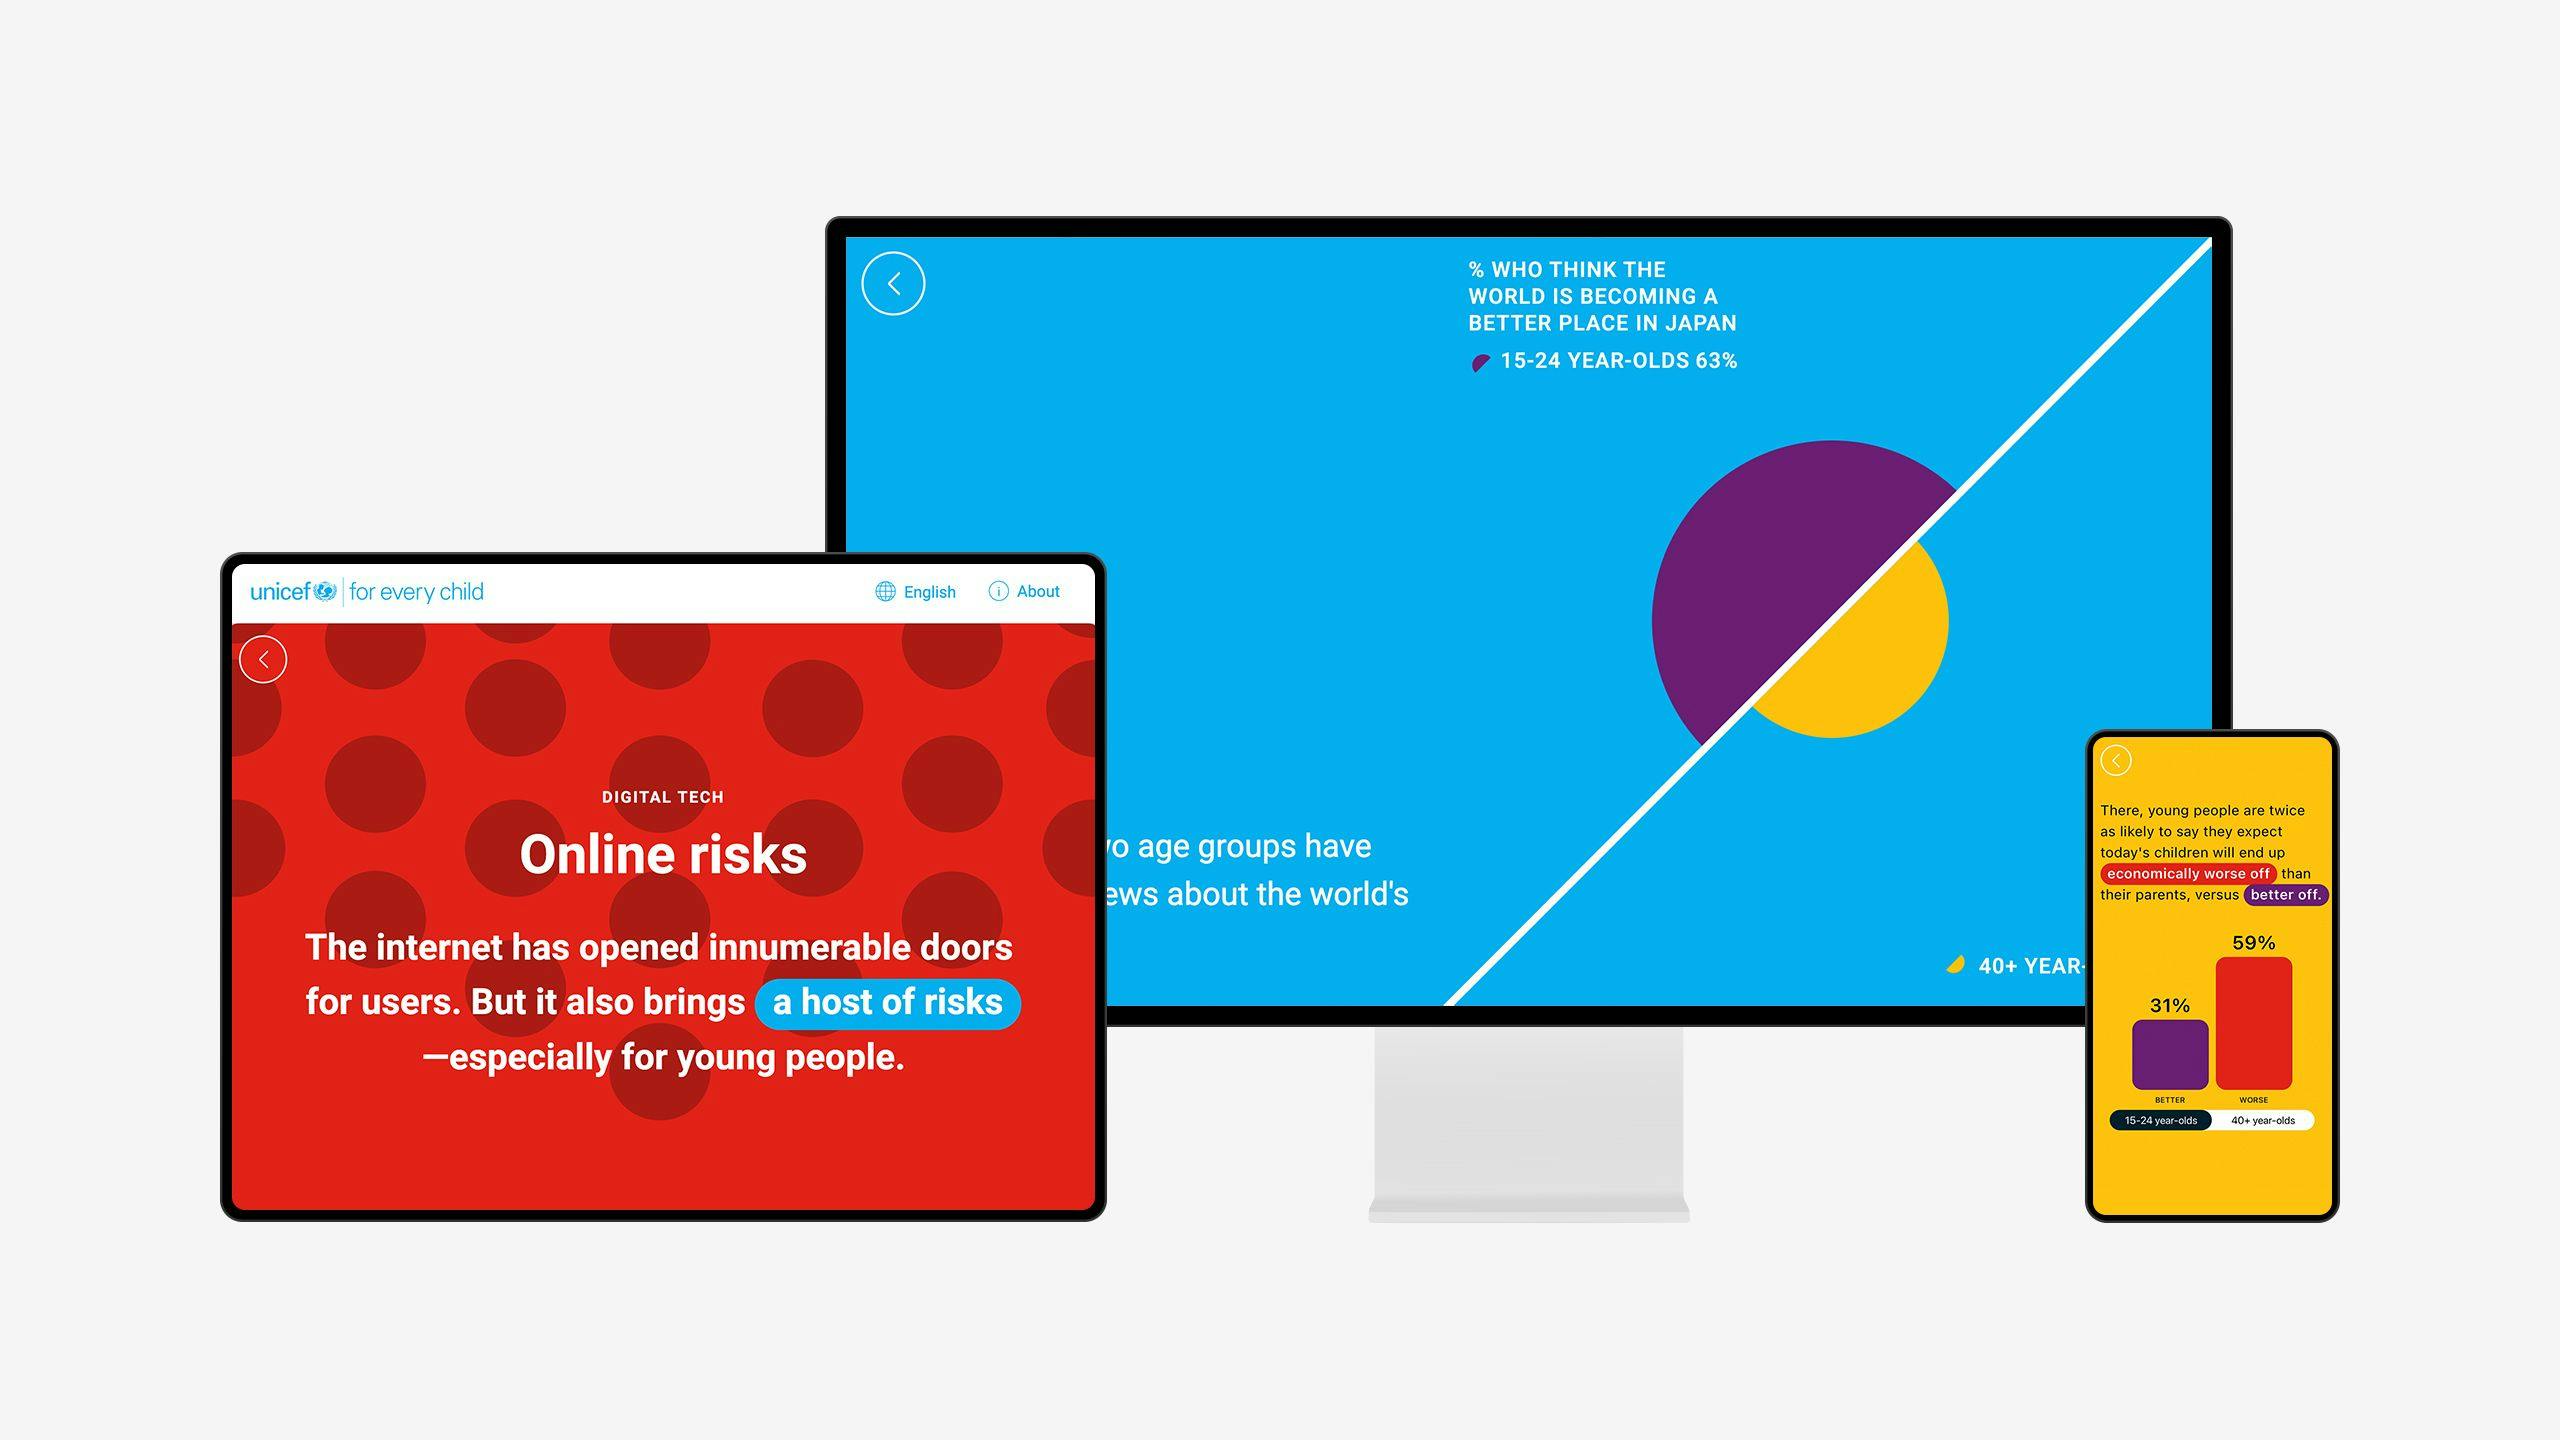
Mobile-firstapproach
The Changing Childhood project was primarily targeted at young people, and the majority of the young use phones to discover information. For this reason, we decided to take a mobile-first approach, which enables the younger generation to easily access and engage with the microsite.
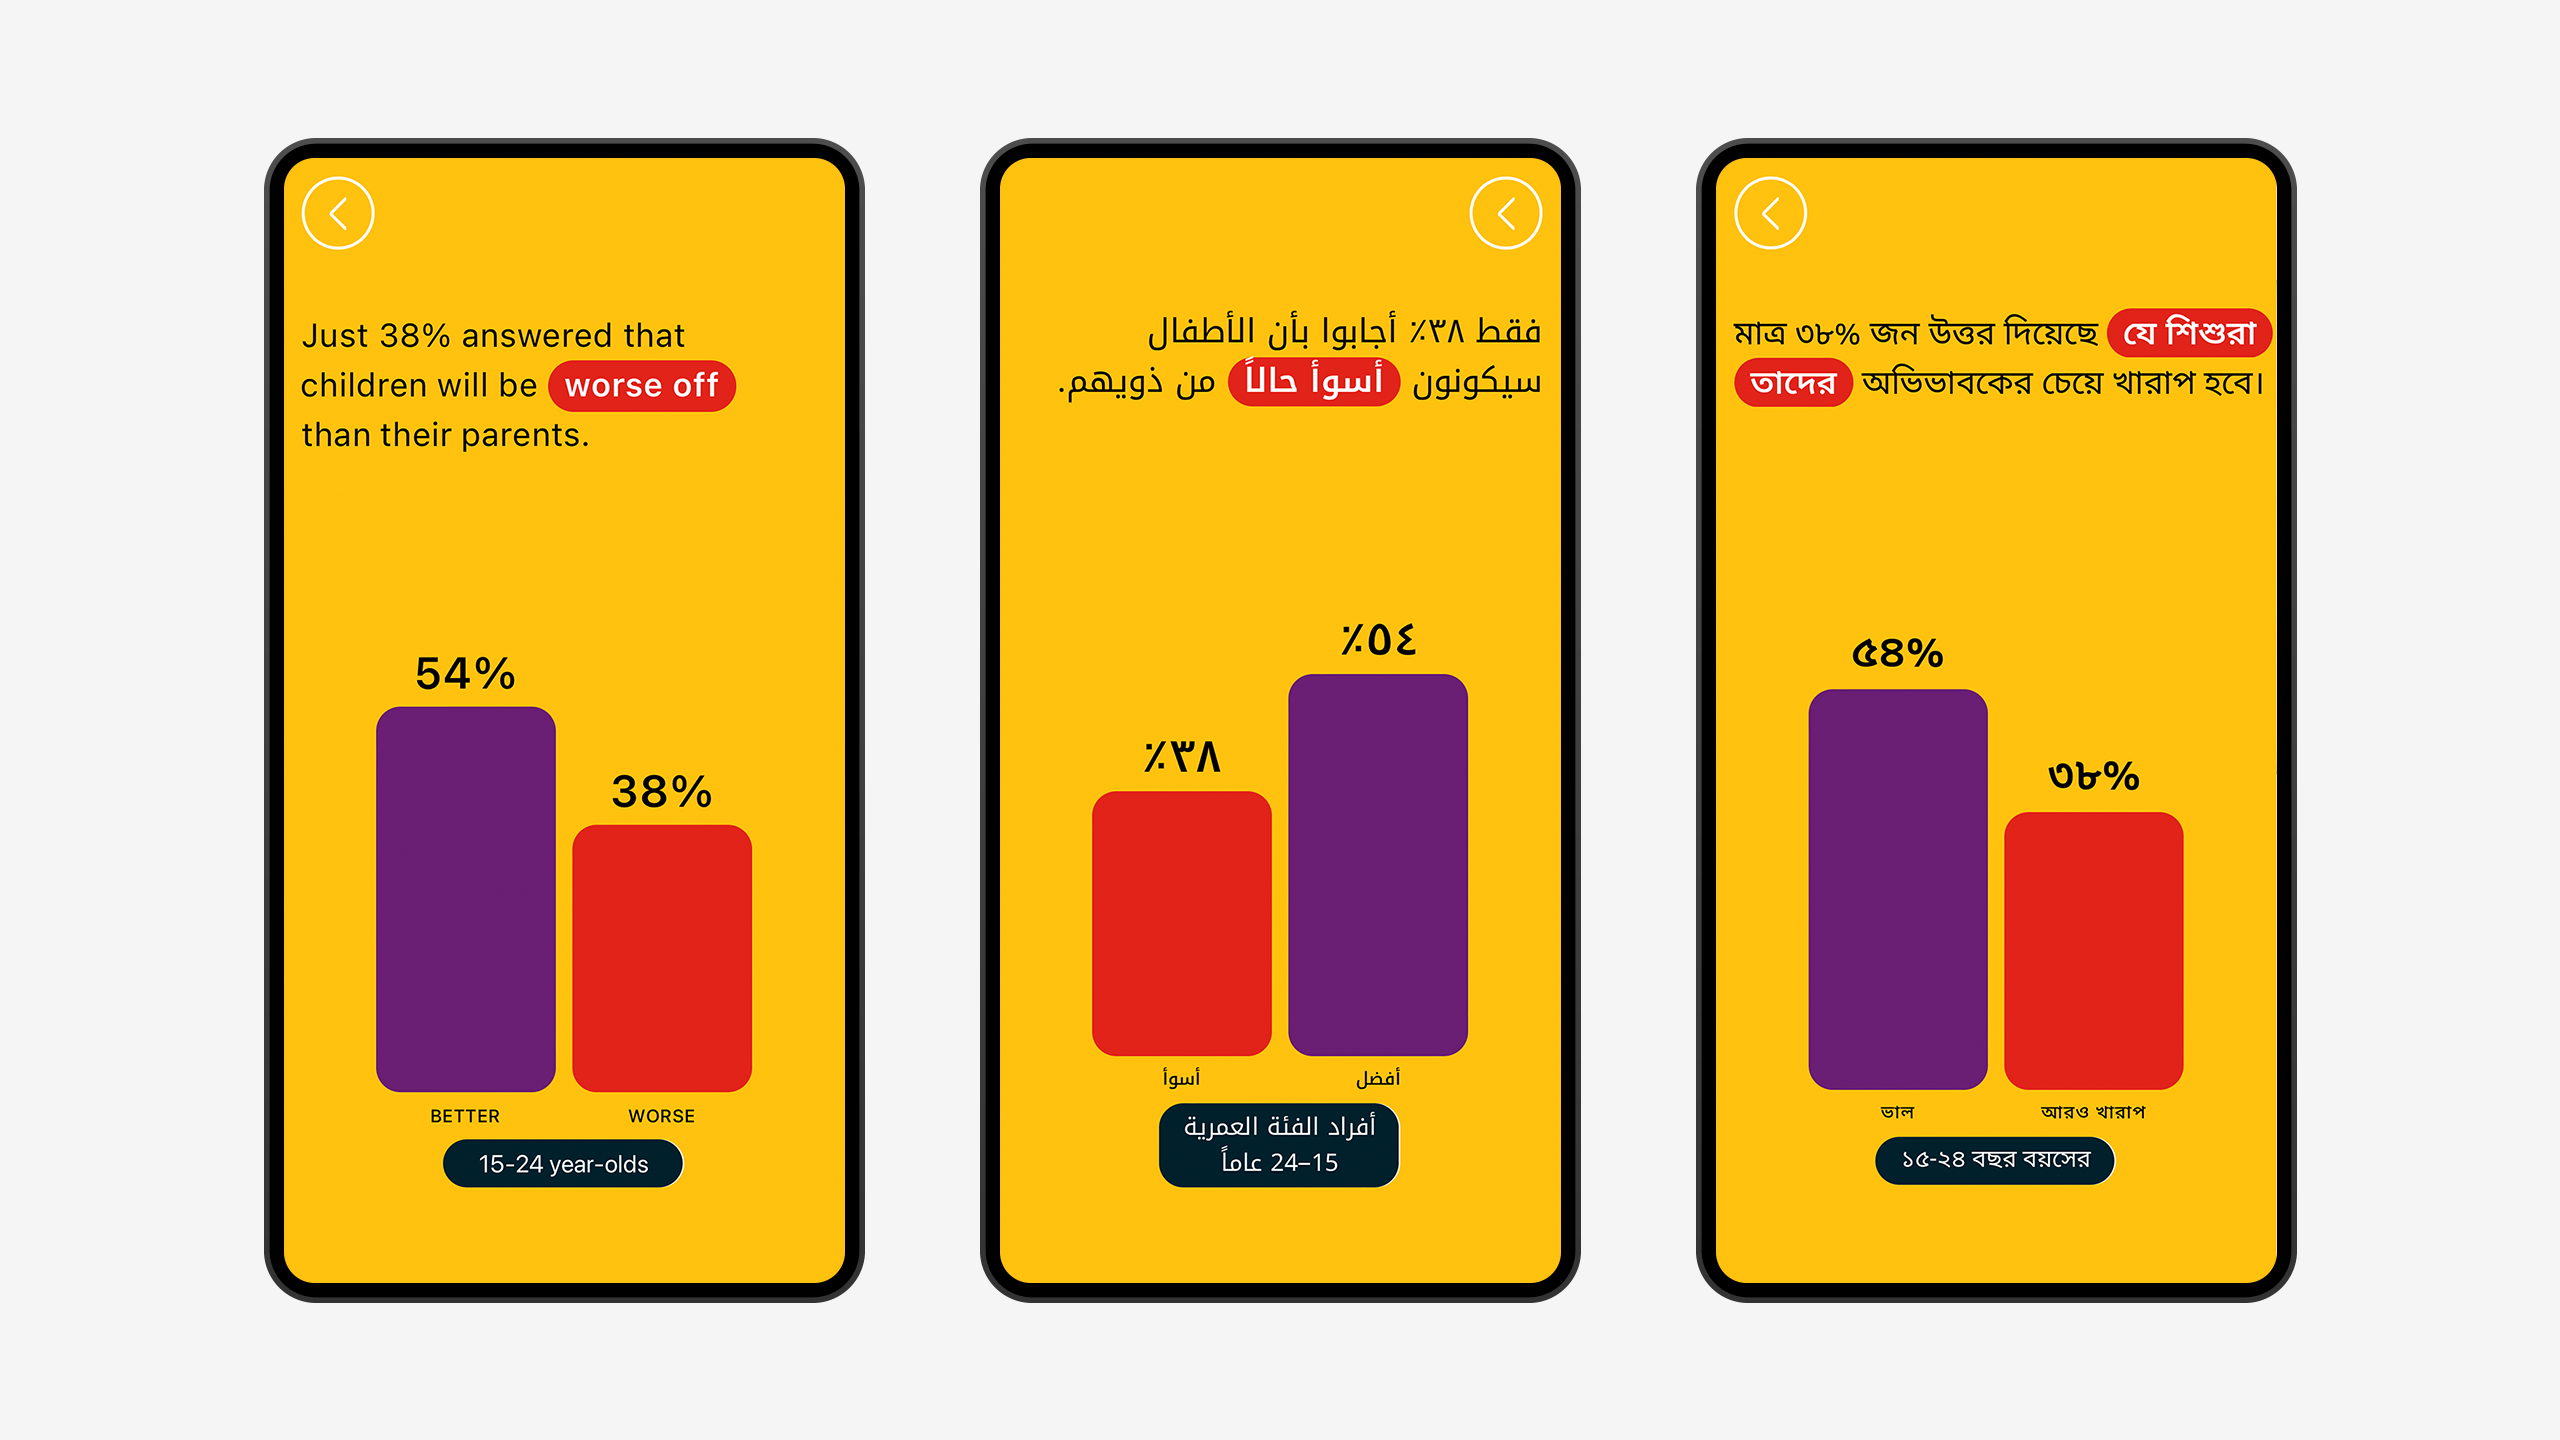
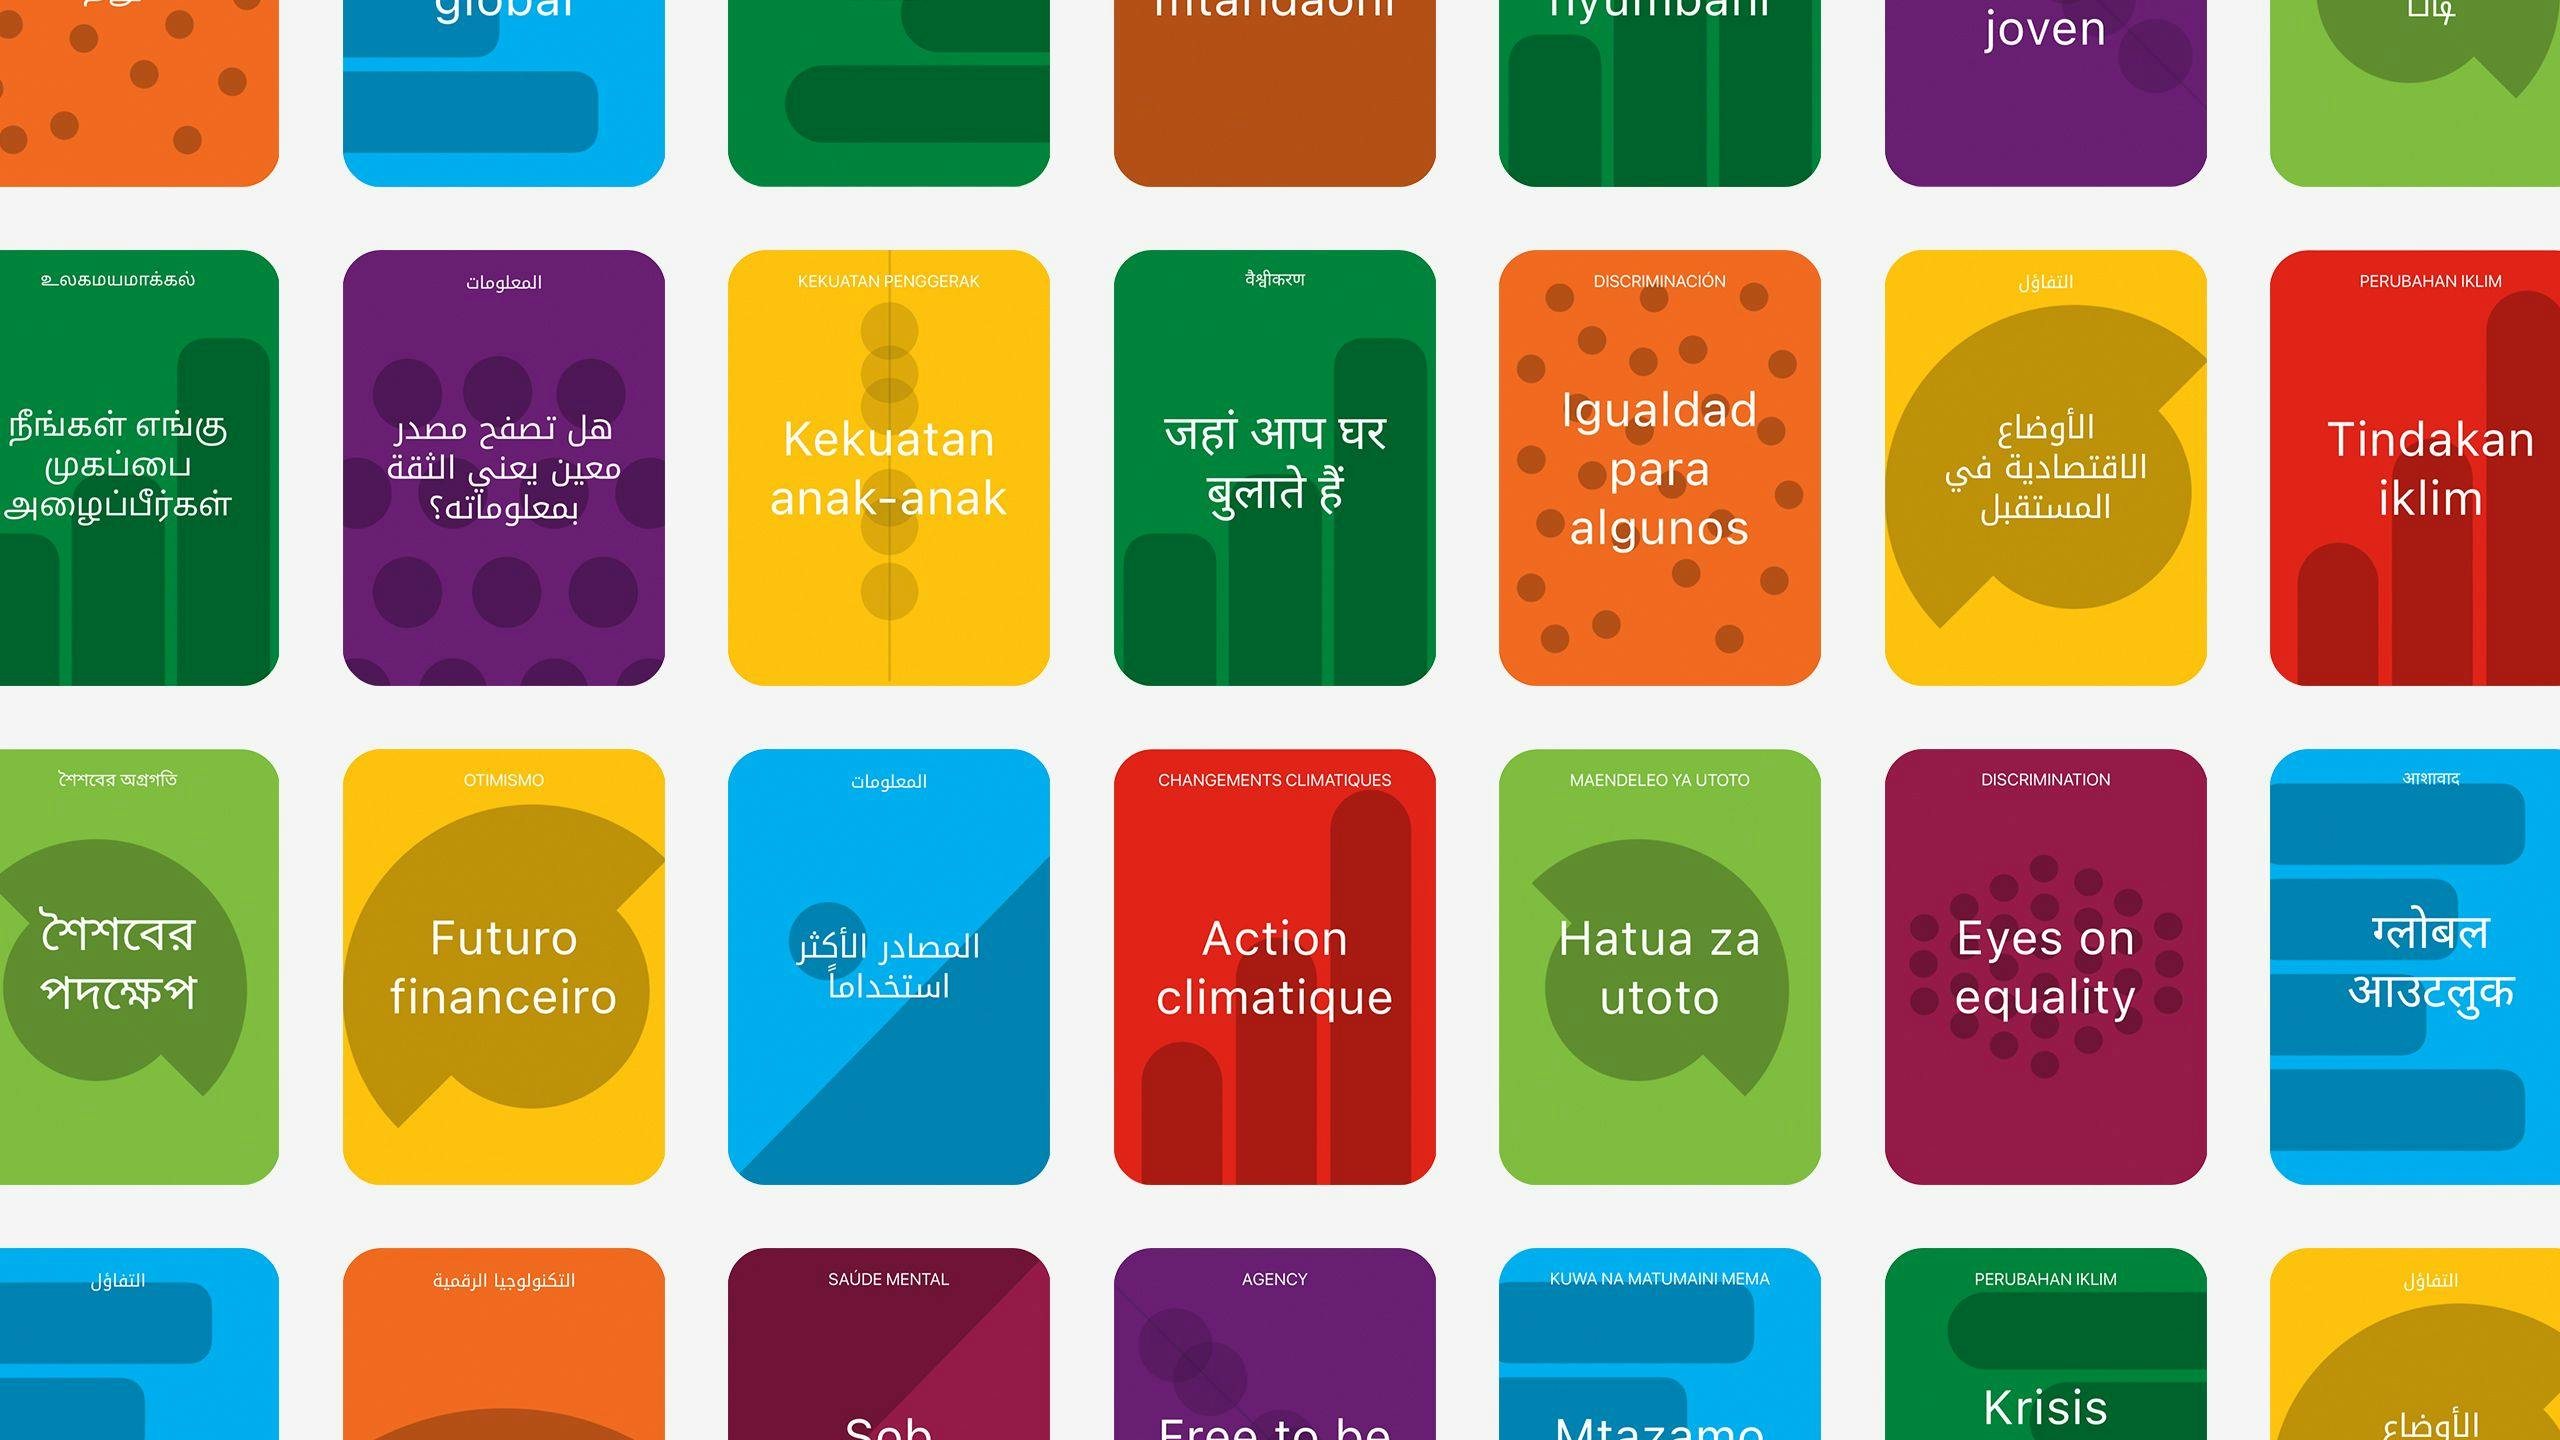
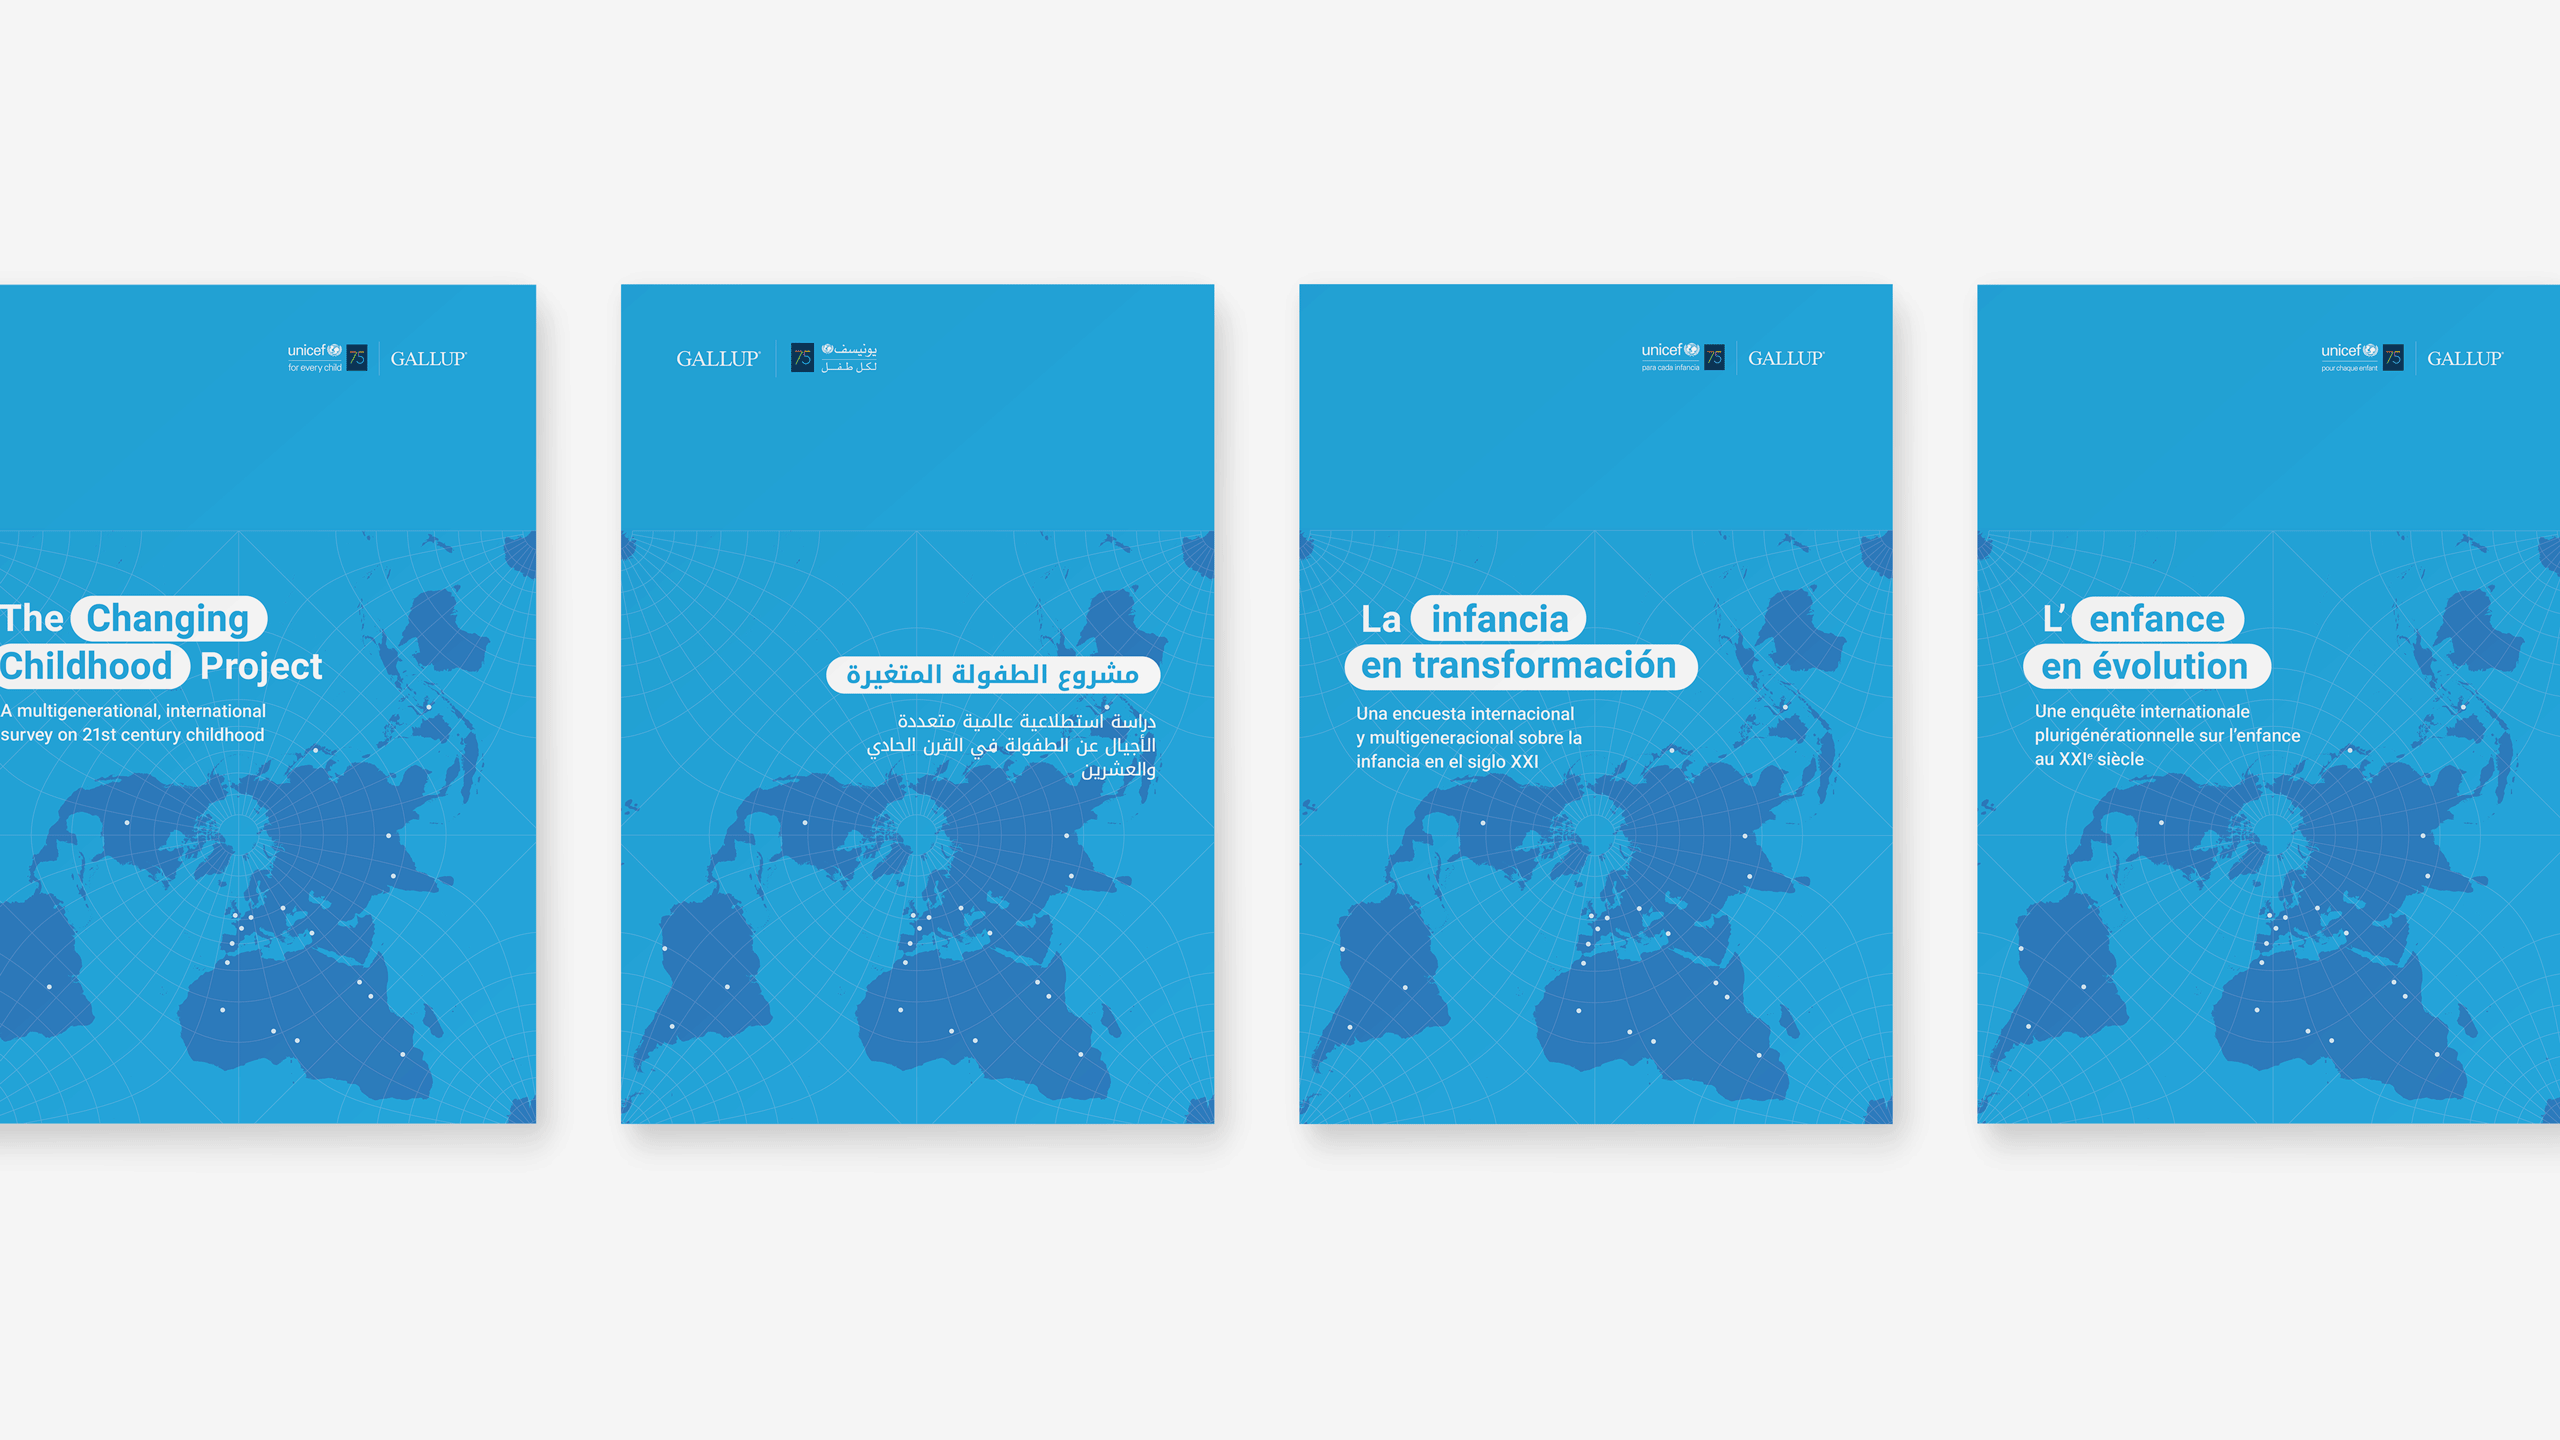
Multilingualplatform
The platform also supports 10 different languages to make it more accessible around the globe.
Optimization
One of the biggest technical goals we wanted to achieve was the optimization of the platform performance. As the project talks about childhood and mostly targets young people, we aimed to make the platform accessible to every child and make it run on a wide scale of devices. Through extensive checks, we enforced bundle sizes to always stay under 50-55 KB to allow accessing the platform on even slower and older phones.
Technology
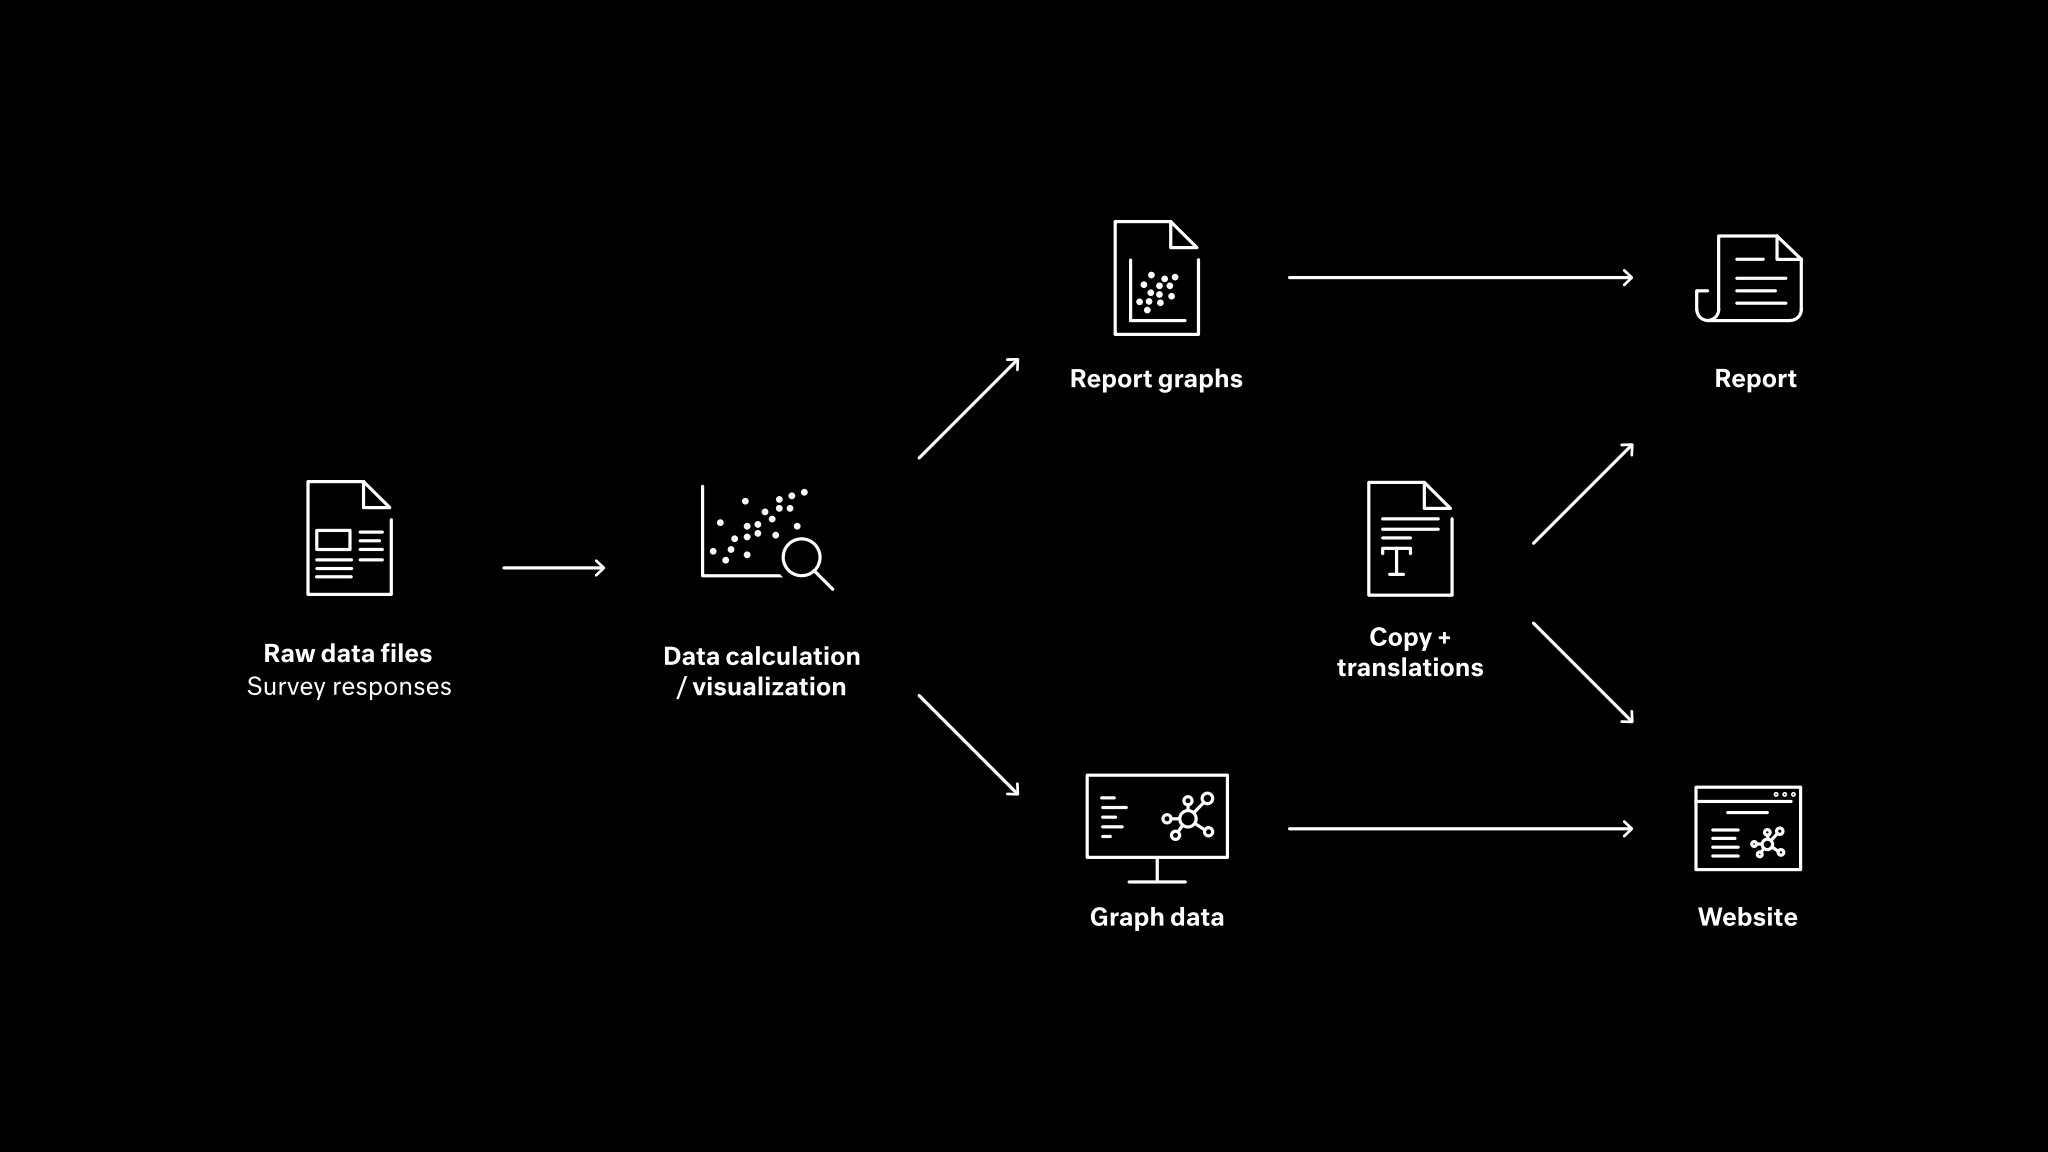
All data per country is acquired from CSV files. This data is grouped based on percentages per question and other relevant dimensions (e.g. age, country, etc). The results are then arranged into efficient data structures for the microsite to use, which in turn uses its own graphing libraries to create interactive visualizations. The same aggregation methods are used to render the data to graphs that appear in the report.
Both the report and the website are translated into several different languages. All the content for those languages is supplied to the website through a central translation system that translators can use directly.
Results
Building an interactive microsite was a new process for us, so it was crucial that we had the right partner. It’s been clear from the start of the project that we did. The CLEVER°FRANKE team listened carefully to our needs and ambition to find a unique way to present data from a 21-country UNICEF-Gallup poll on the changing nature of childhood. They infused the complex project with energy and creativity, communicated clearly and kept everything on track. The process has been collaborative, fun, and satisfying. We now have a beautiful, stimulating website that showcases our data and engages users.
Office of Global Insight and Policy, UNICEF