Exploring the data-rich world of water management and infrastructure data
Statistics
- Client
- Rijkswaterstaat
- Partners
- Jonas Wijtenburg
- Deliverables
- Digital Installation
The challenge
Rijkswaterstaat is the Dutch Ministry of Infrastructure and Water Management. They manage our water systems, roads, and waterways. However, in addition to this, they also collect a vast amount of data on everything related to the Dutch infrastructure and environment, from water levels and CO2 emissions to bird migration patterns. To celebrate their 225th anniversary, Rijkswaterstaat asked us to create an installation to draw attention to this advanced data and make it visible to their visitors.
Value delivered
The Netherlands is densely populated, with much land below sea level. This means efficient road infrastructure and water management are vital to reduce congestion and protect the country against flooding by sea and rivers. So, accurate and extensive data for adequately managing the water and infrastructures is crucial.
Rijkswaterstaat's work takes on heightened importance in the face of climate change, which entails alarming situations like rising sea levels, extreme temperatures, and threats to biodiversity. Beyond managing infrastructure, the extensive data collected and shared by Rijkswaterstaat plays a critical role nationwide in governing the country. This installation showcases the otherwise invisible "data landscape" that Rijkswaterstaat maintains by creating a unique and tangible visualization. The installation emphasizes the value of the data and reinforces Rijkswaterstaat's leadership in the mission to safeguard the habitat of the Netherlands.
Background
Essentially, Rijkswaterstaat had this vast amount of data they wanted to make more visible. Their usual work involving building and maintaining dams, polders, and roadways is visually eminent, but their collected data had no appealing visual representation. We saw this data and wanted to create something that would give a clear presence to this data and draw attention to the information Rijkswaterstaat has.
Phases and toolkit items used
Solution
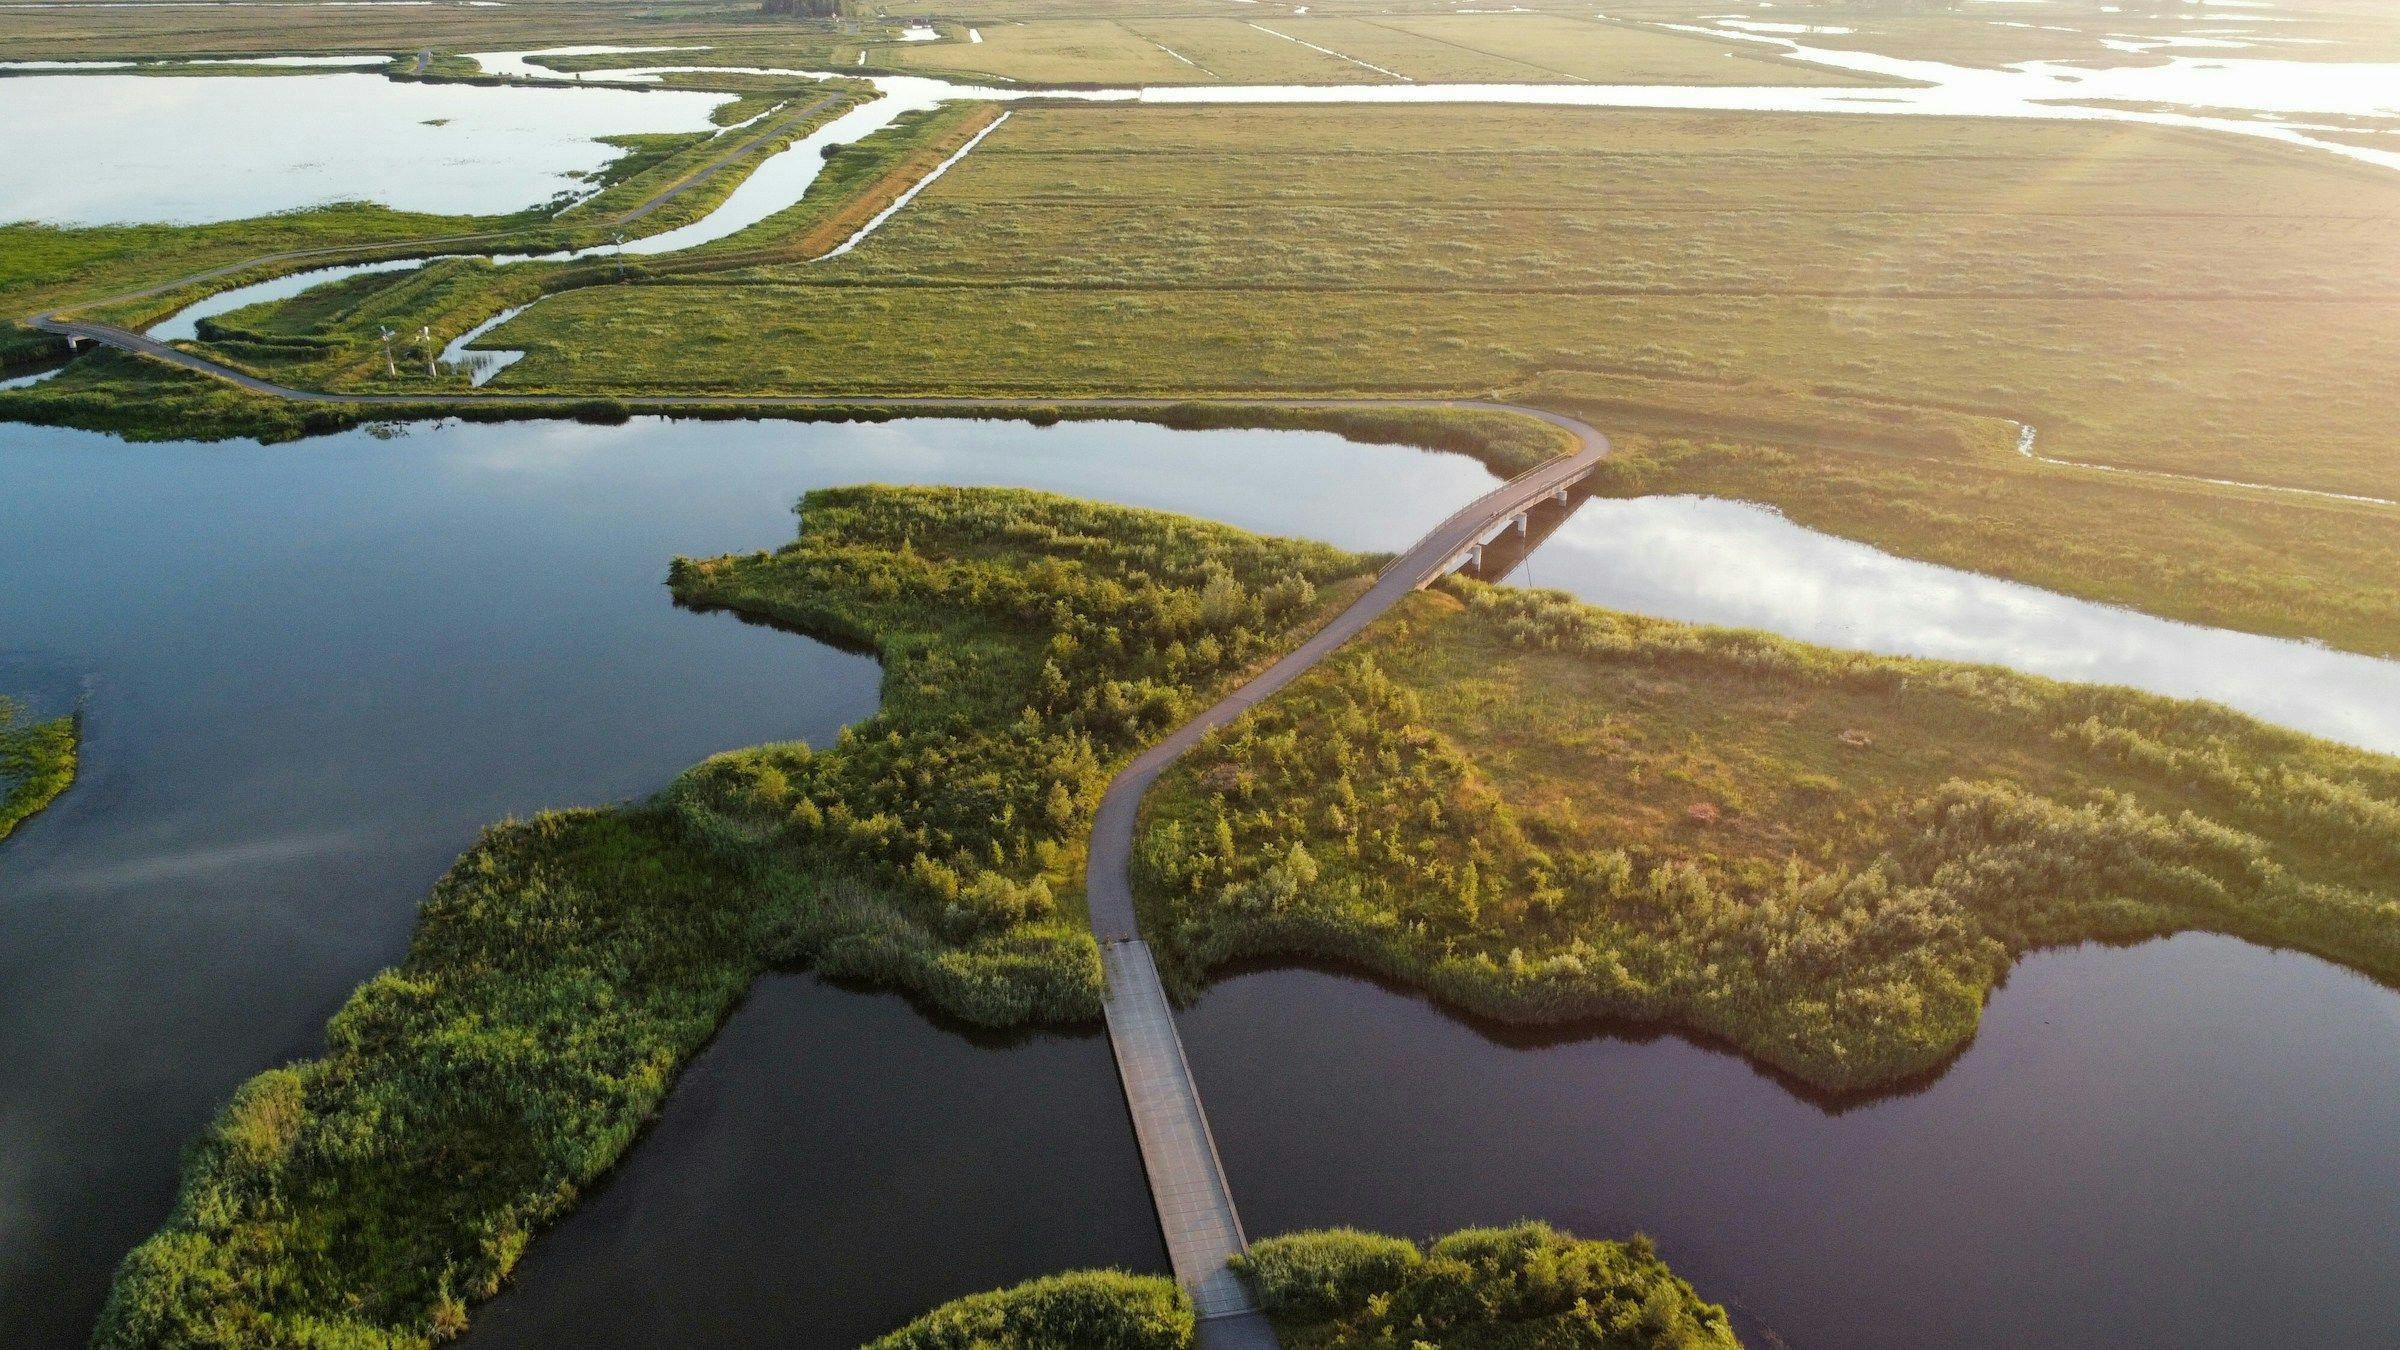
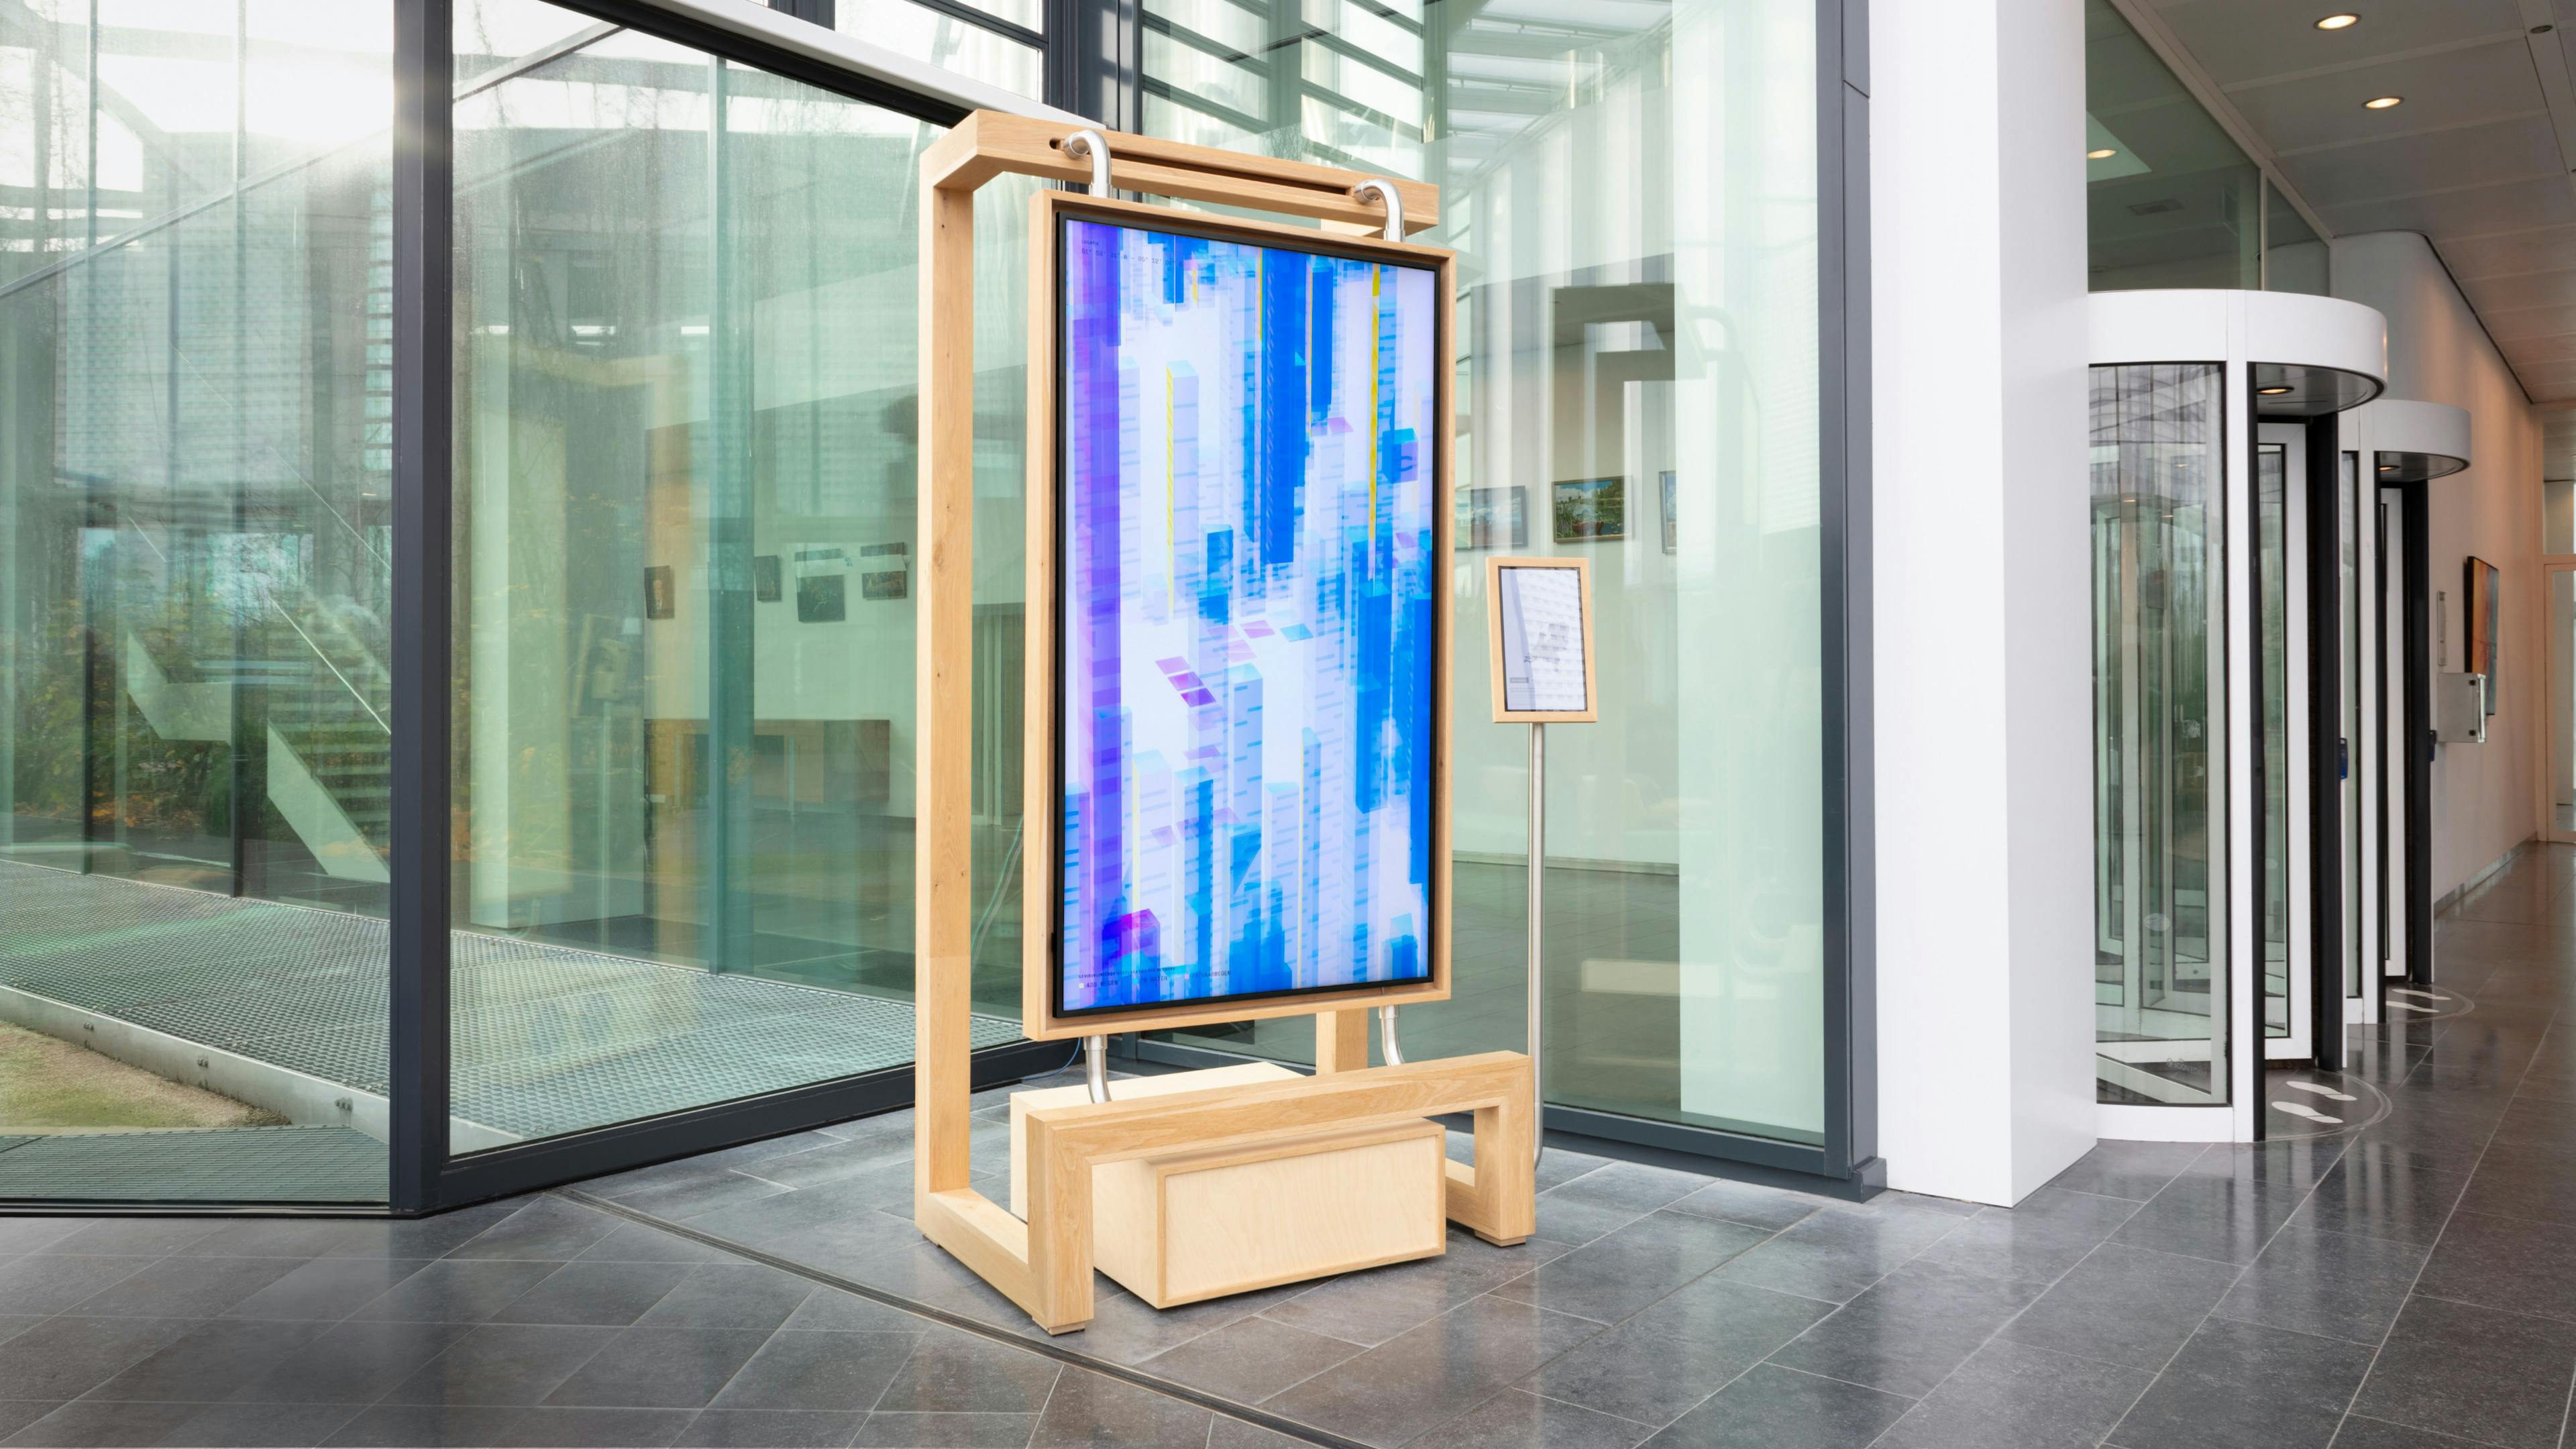
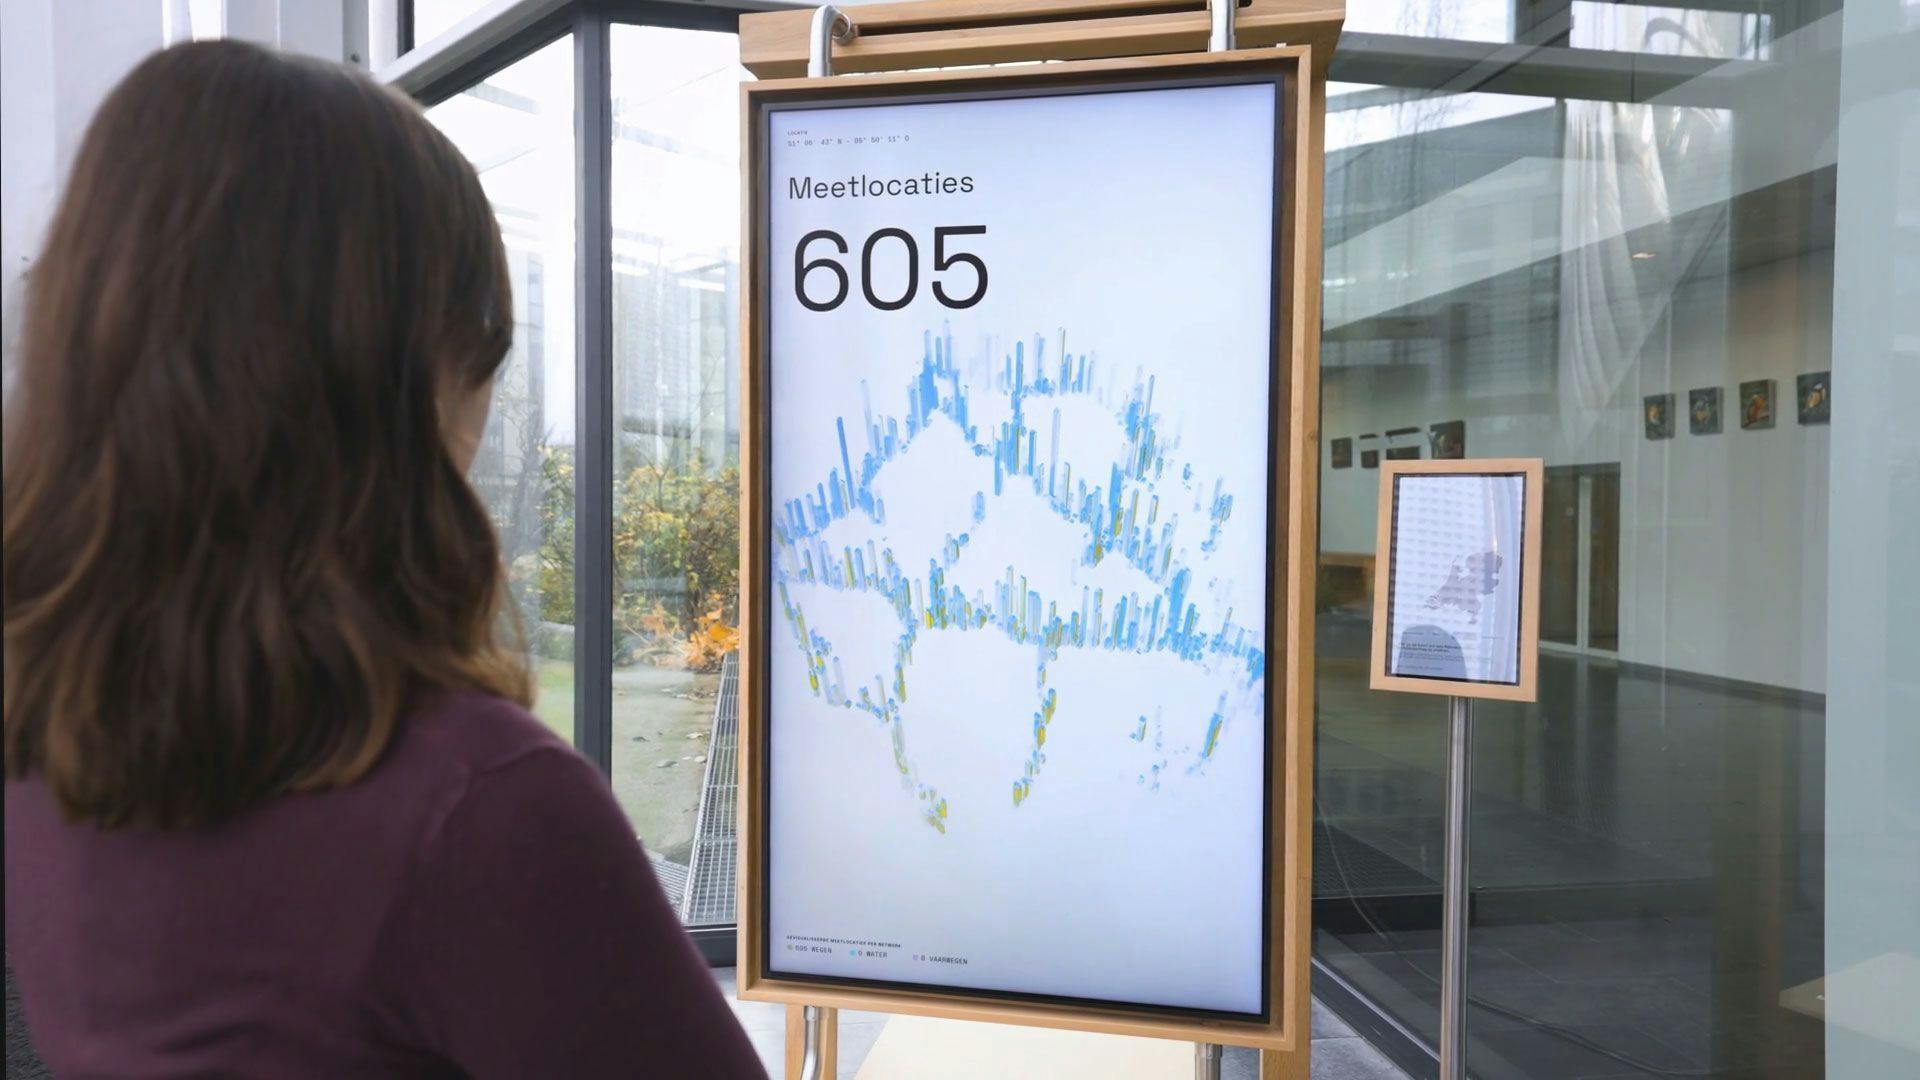
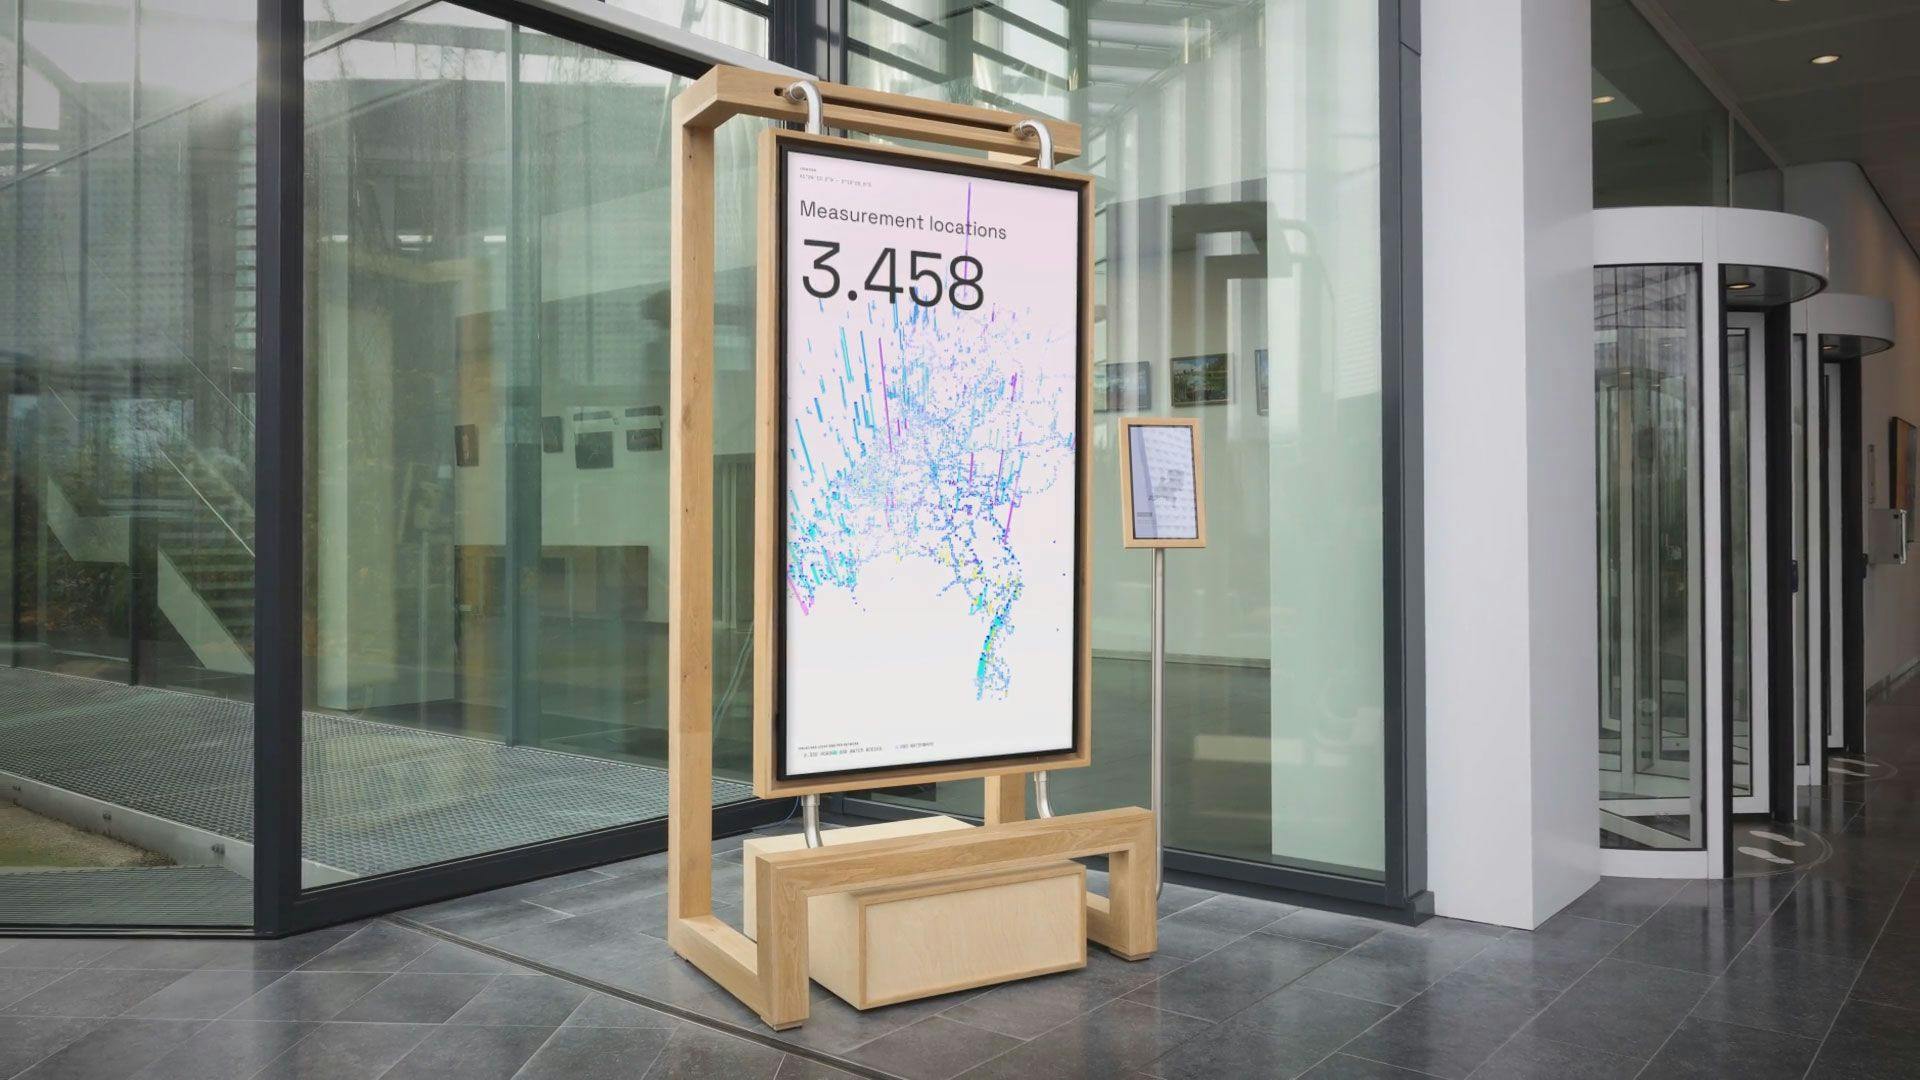
To bring the data to life, we wanted to create a unique "data landscape" where people could "fly" and get a bird's-eye view of what is collected and where. We wanted to let people immerse themselves in these vast amounts of data on a big screen and navigate their "flight" through the data. This idea resulted in an installation with a two-meter tall screen, and a touch screen that allows visitors to select locations.
Located in the lobby of the Rijkswaterstaat headquarters, the installation helps people who work for and with Rijkswaterstaat to be better informed about this historic institution’s extensive efforts in data collection.
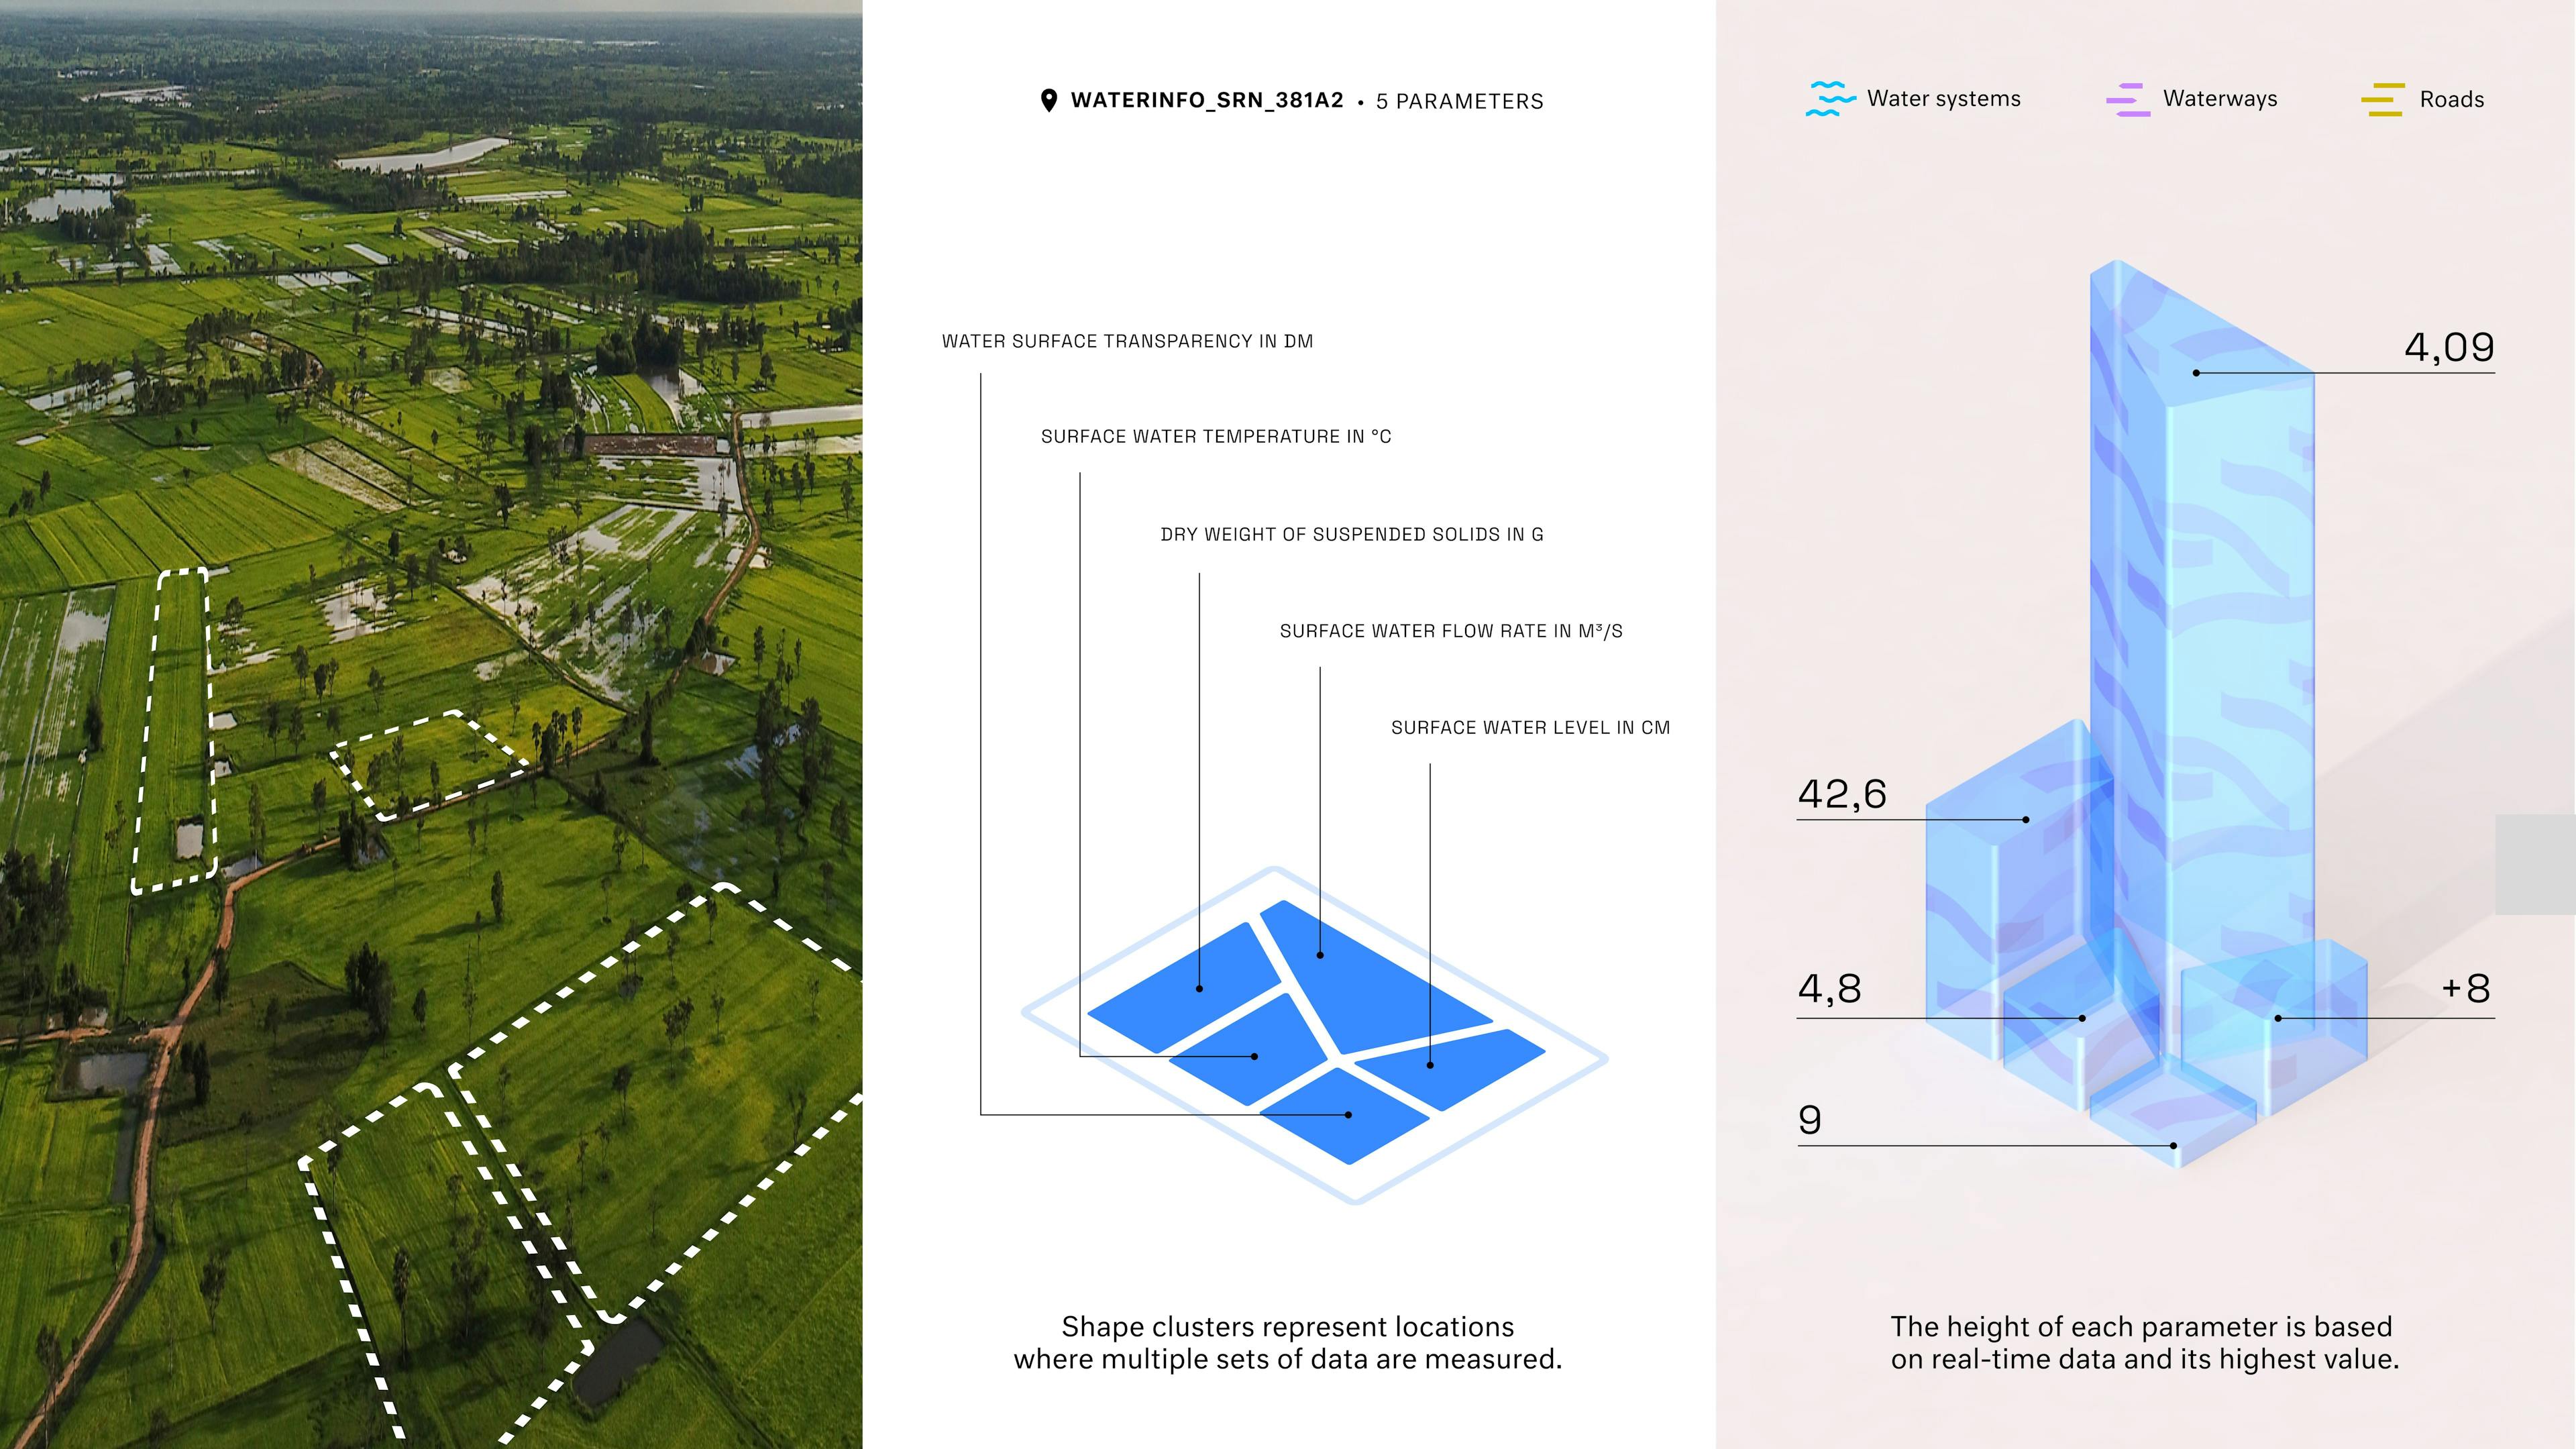
Parameterview
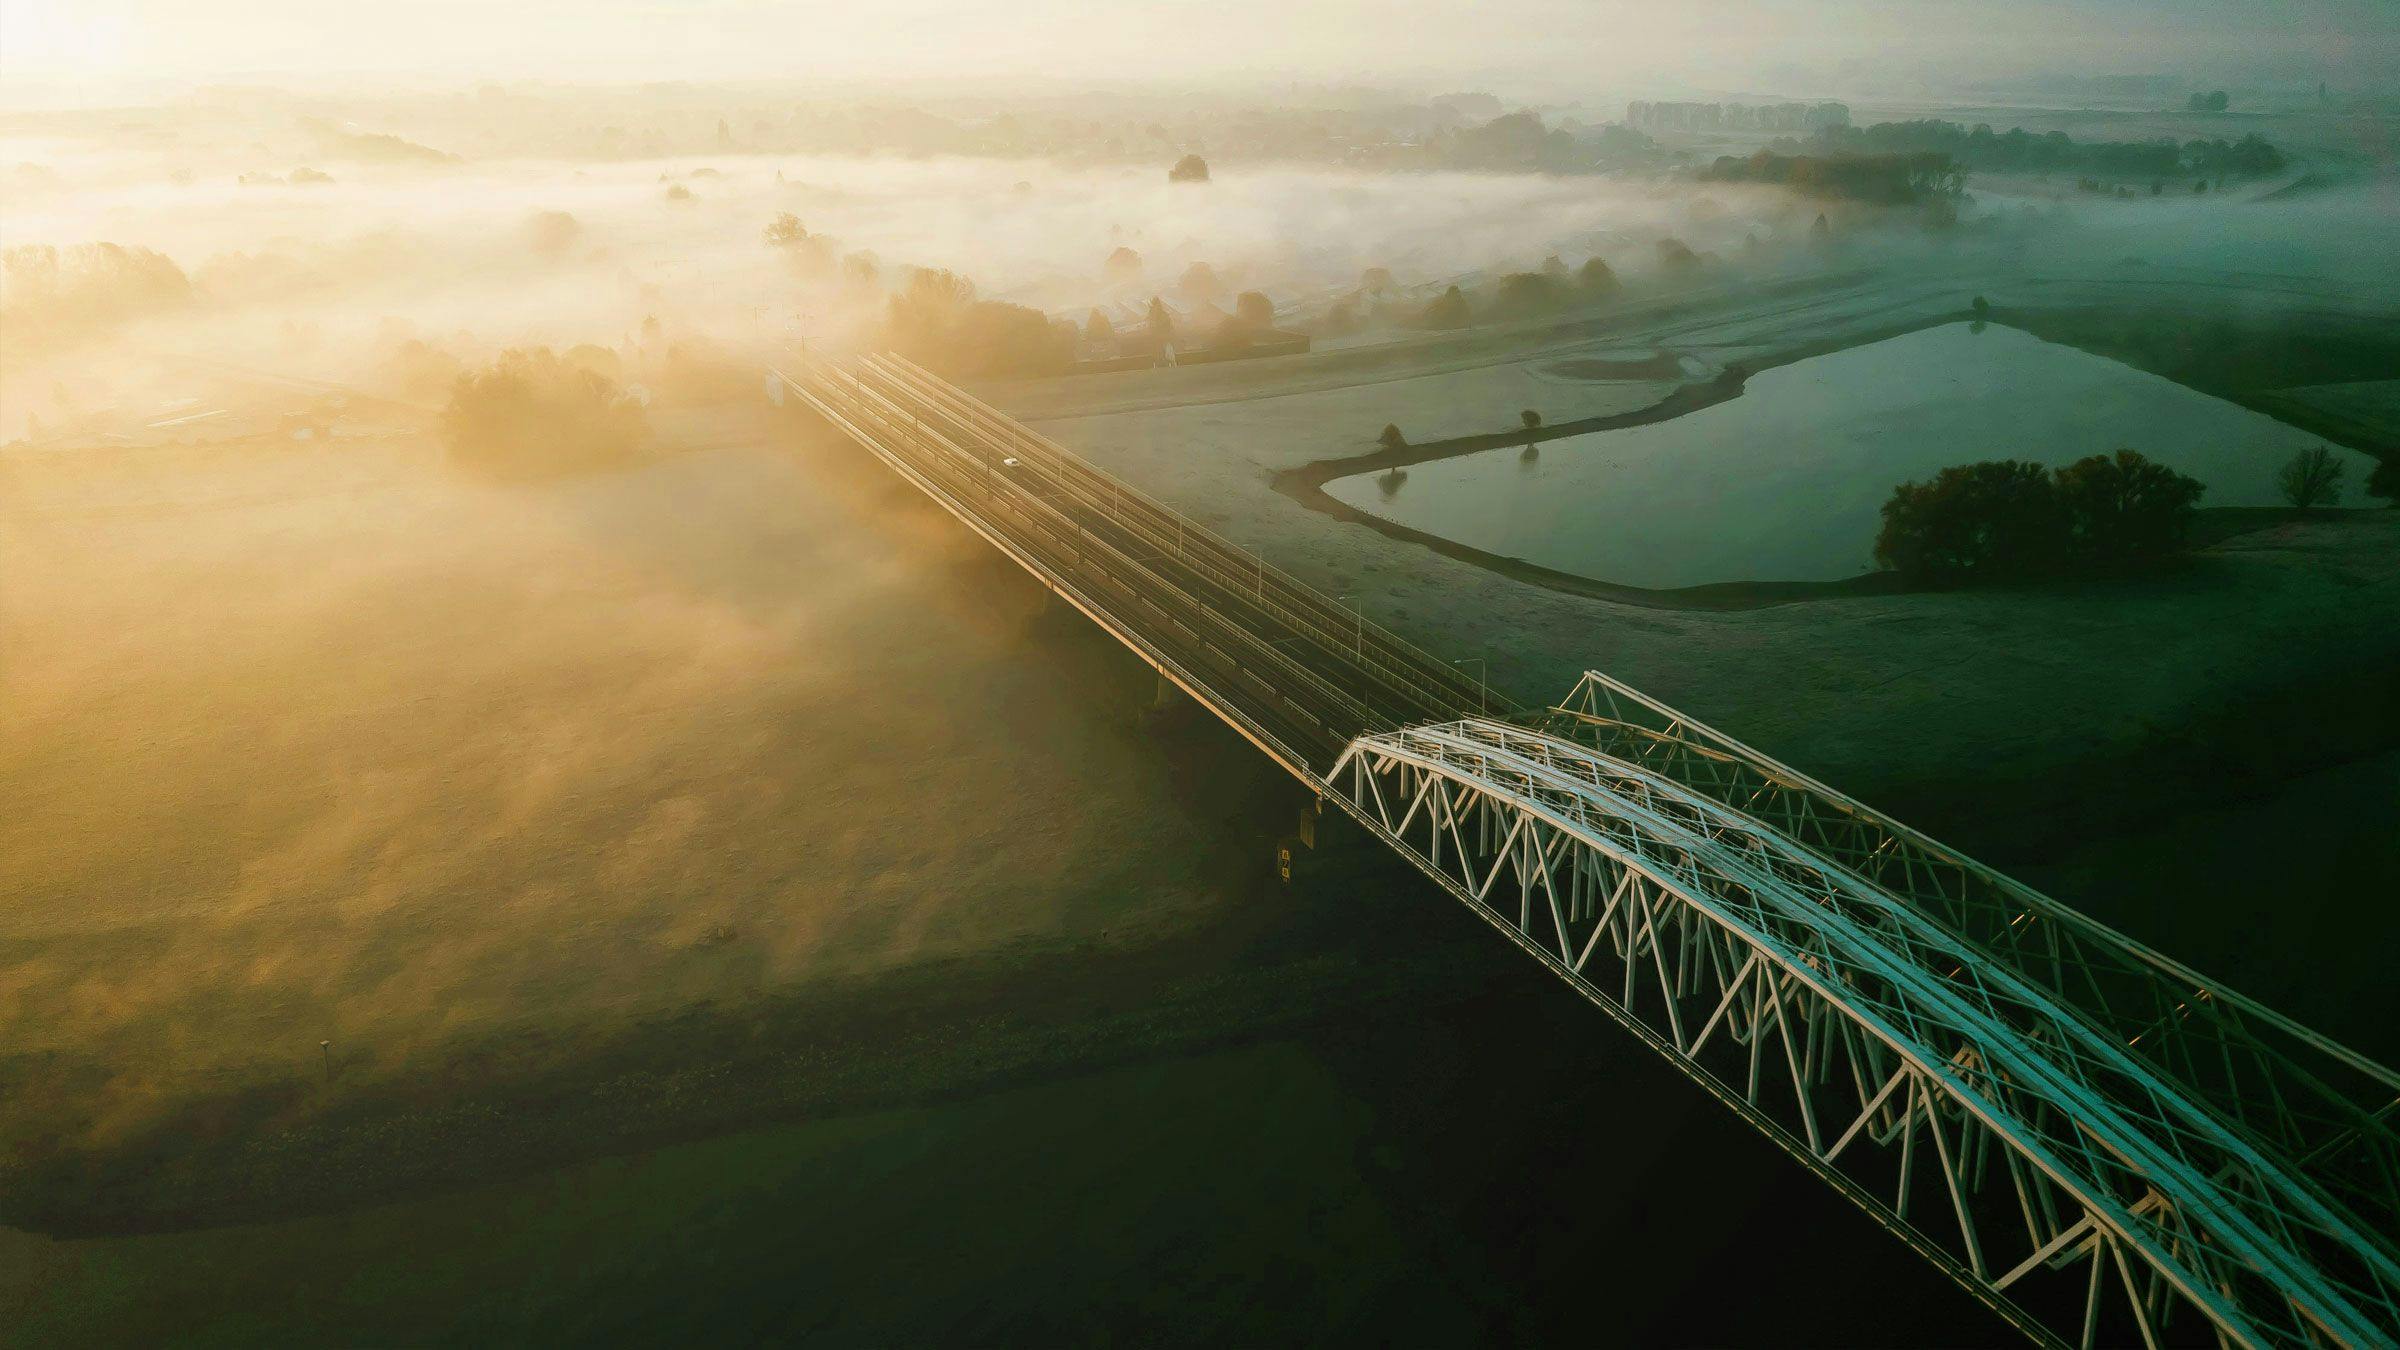
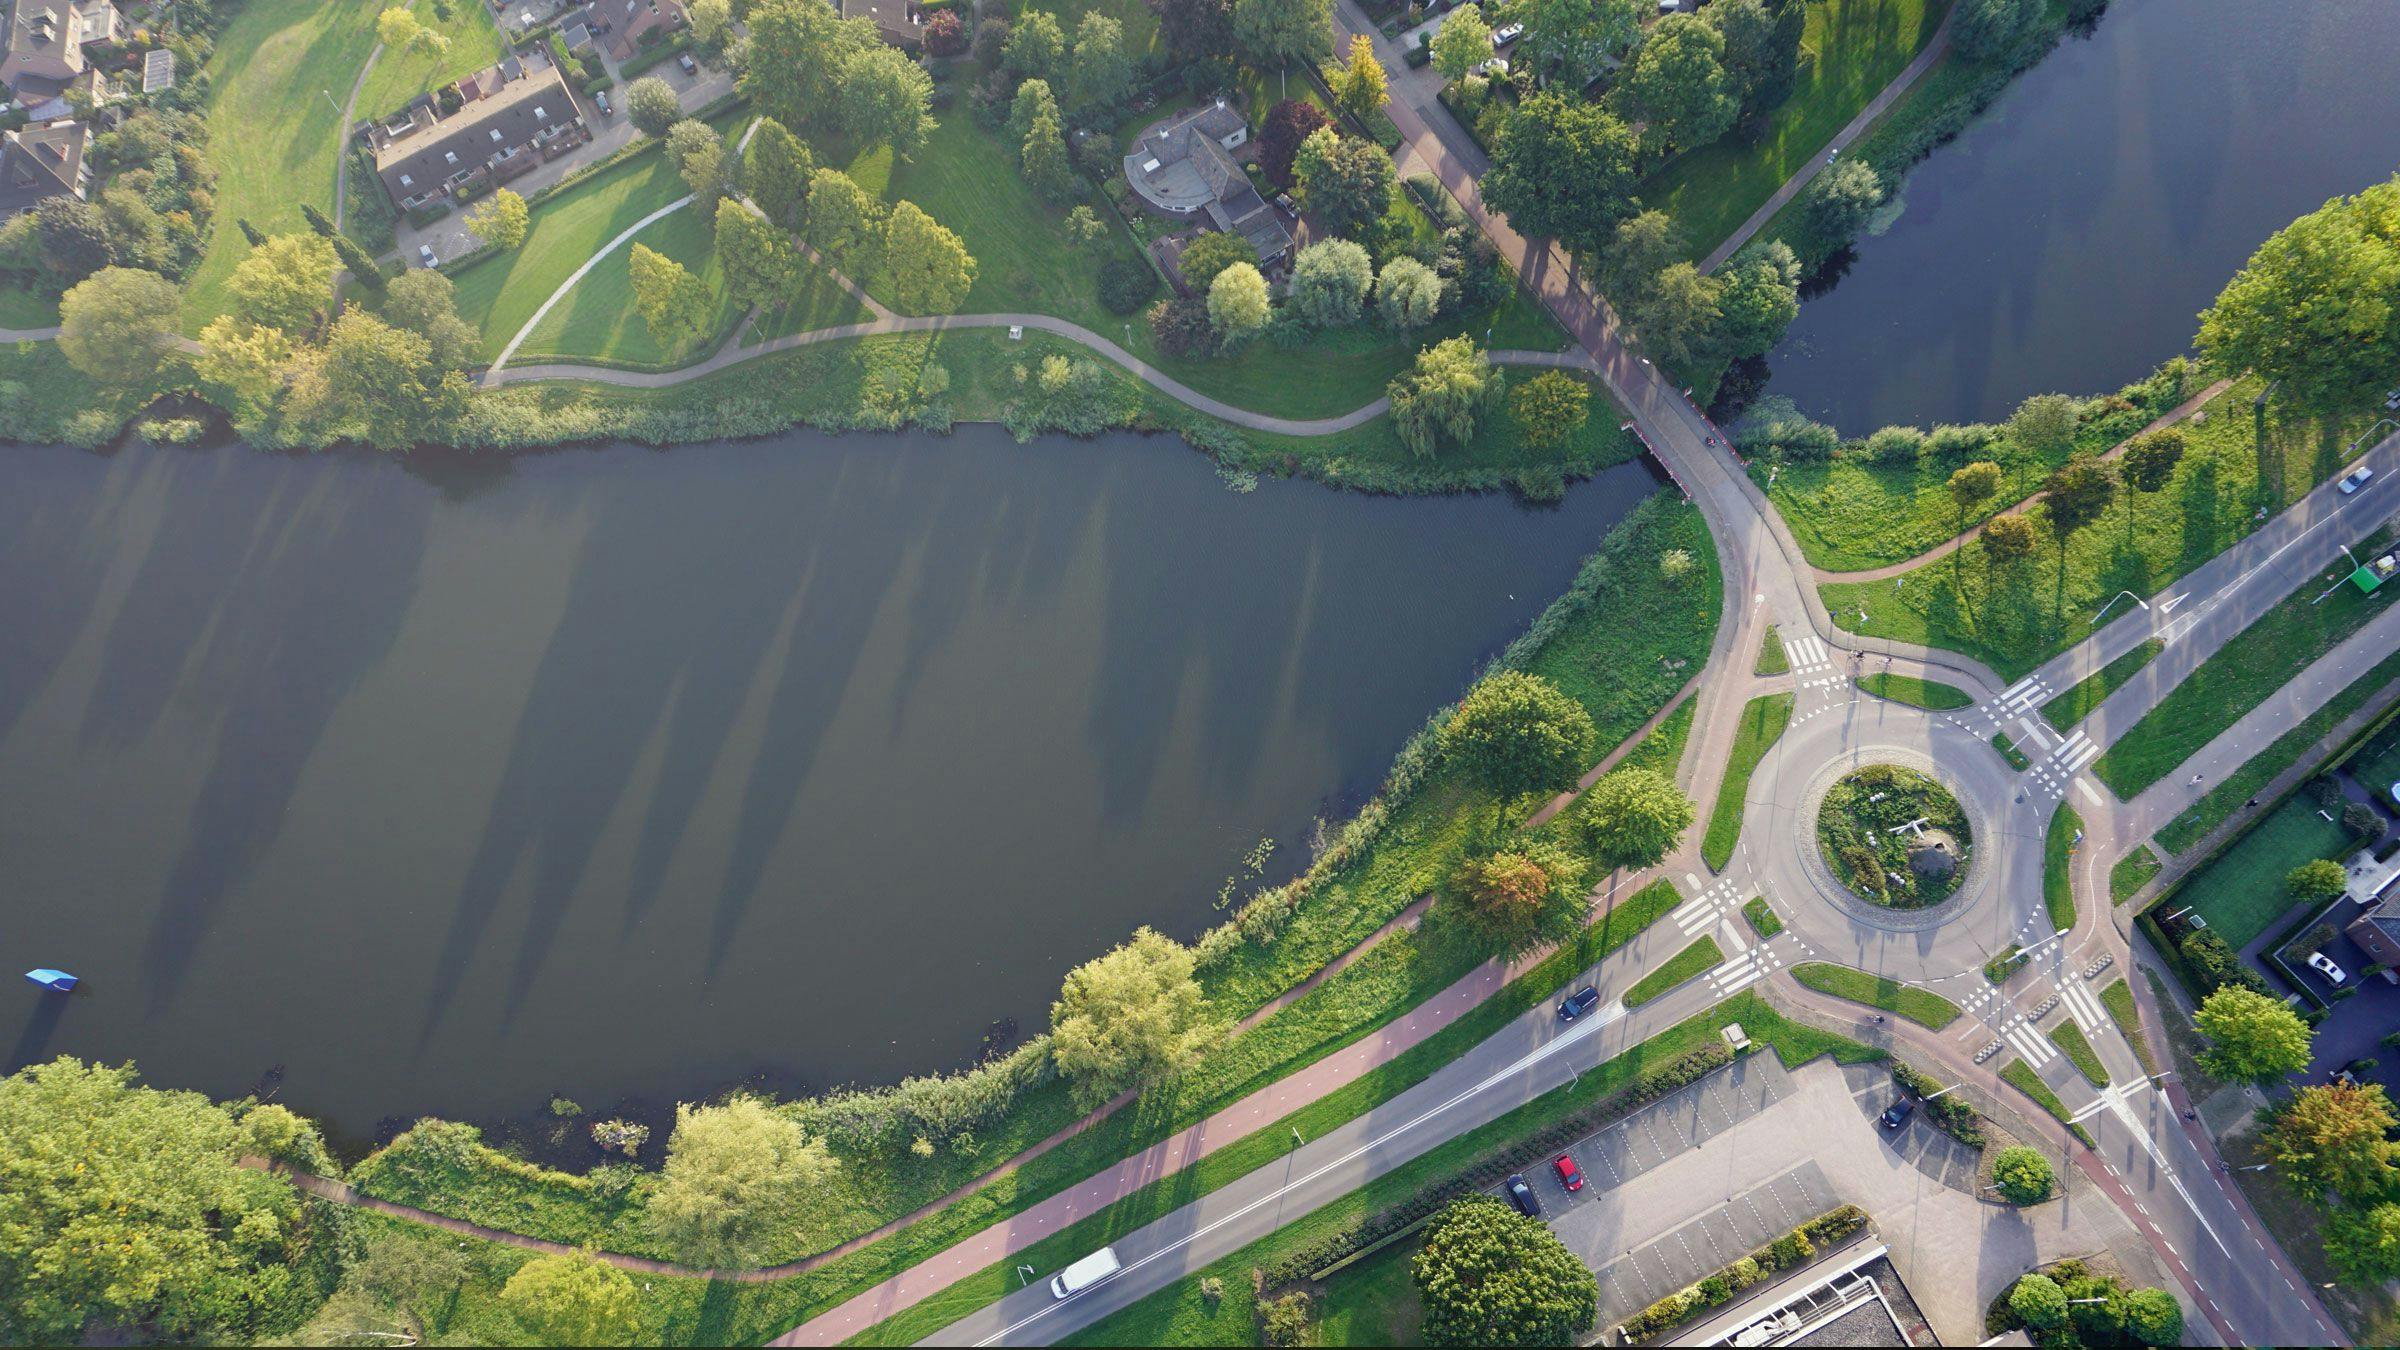
Designing the visualizations, we looked to Dutch landscape for inspiration. The Netherlands is divided into grids of farmlands, polders, and canals, and we took this grid structure as a basis for intricate animated visualizations. The result, while aesthetically intriguing, also ensures that data remains at the core of our project.
For the visualization, each location consists of a rectangular shape containing several tiles, representing a location where sensors collect data. Each tile represents a parameter in that location dataset. The higher the value, the taller the tile.
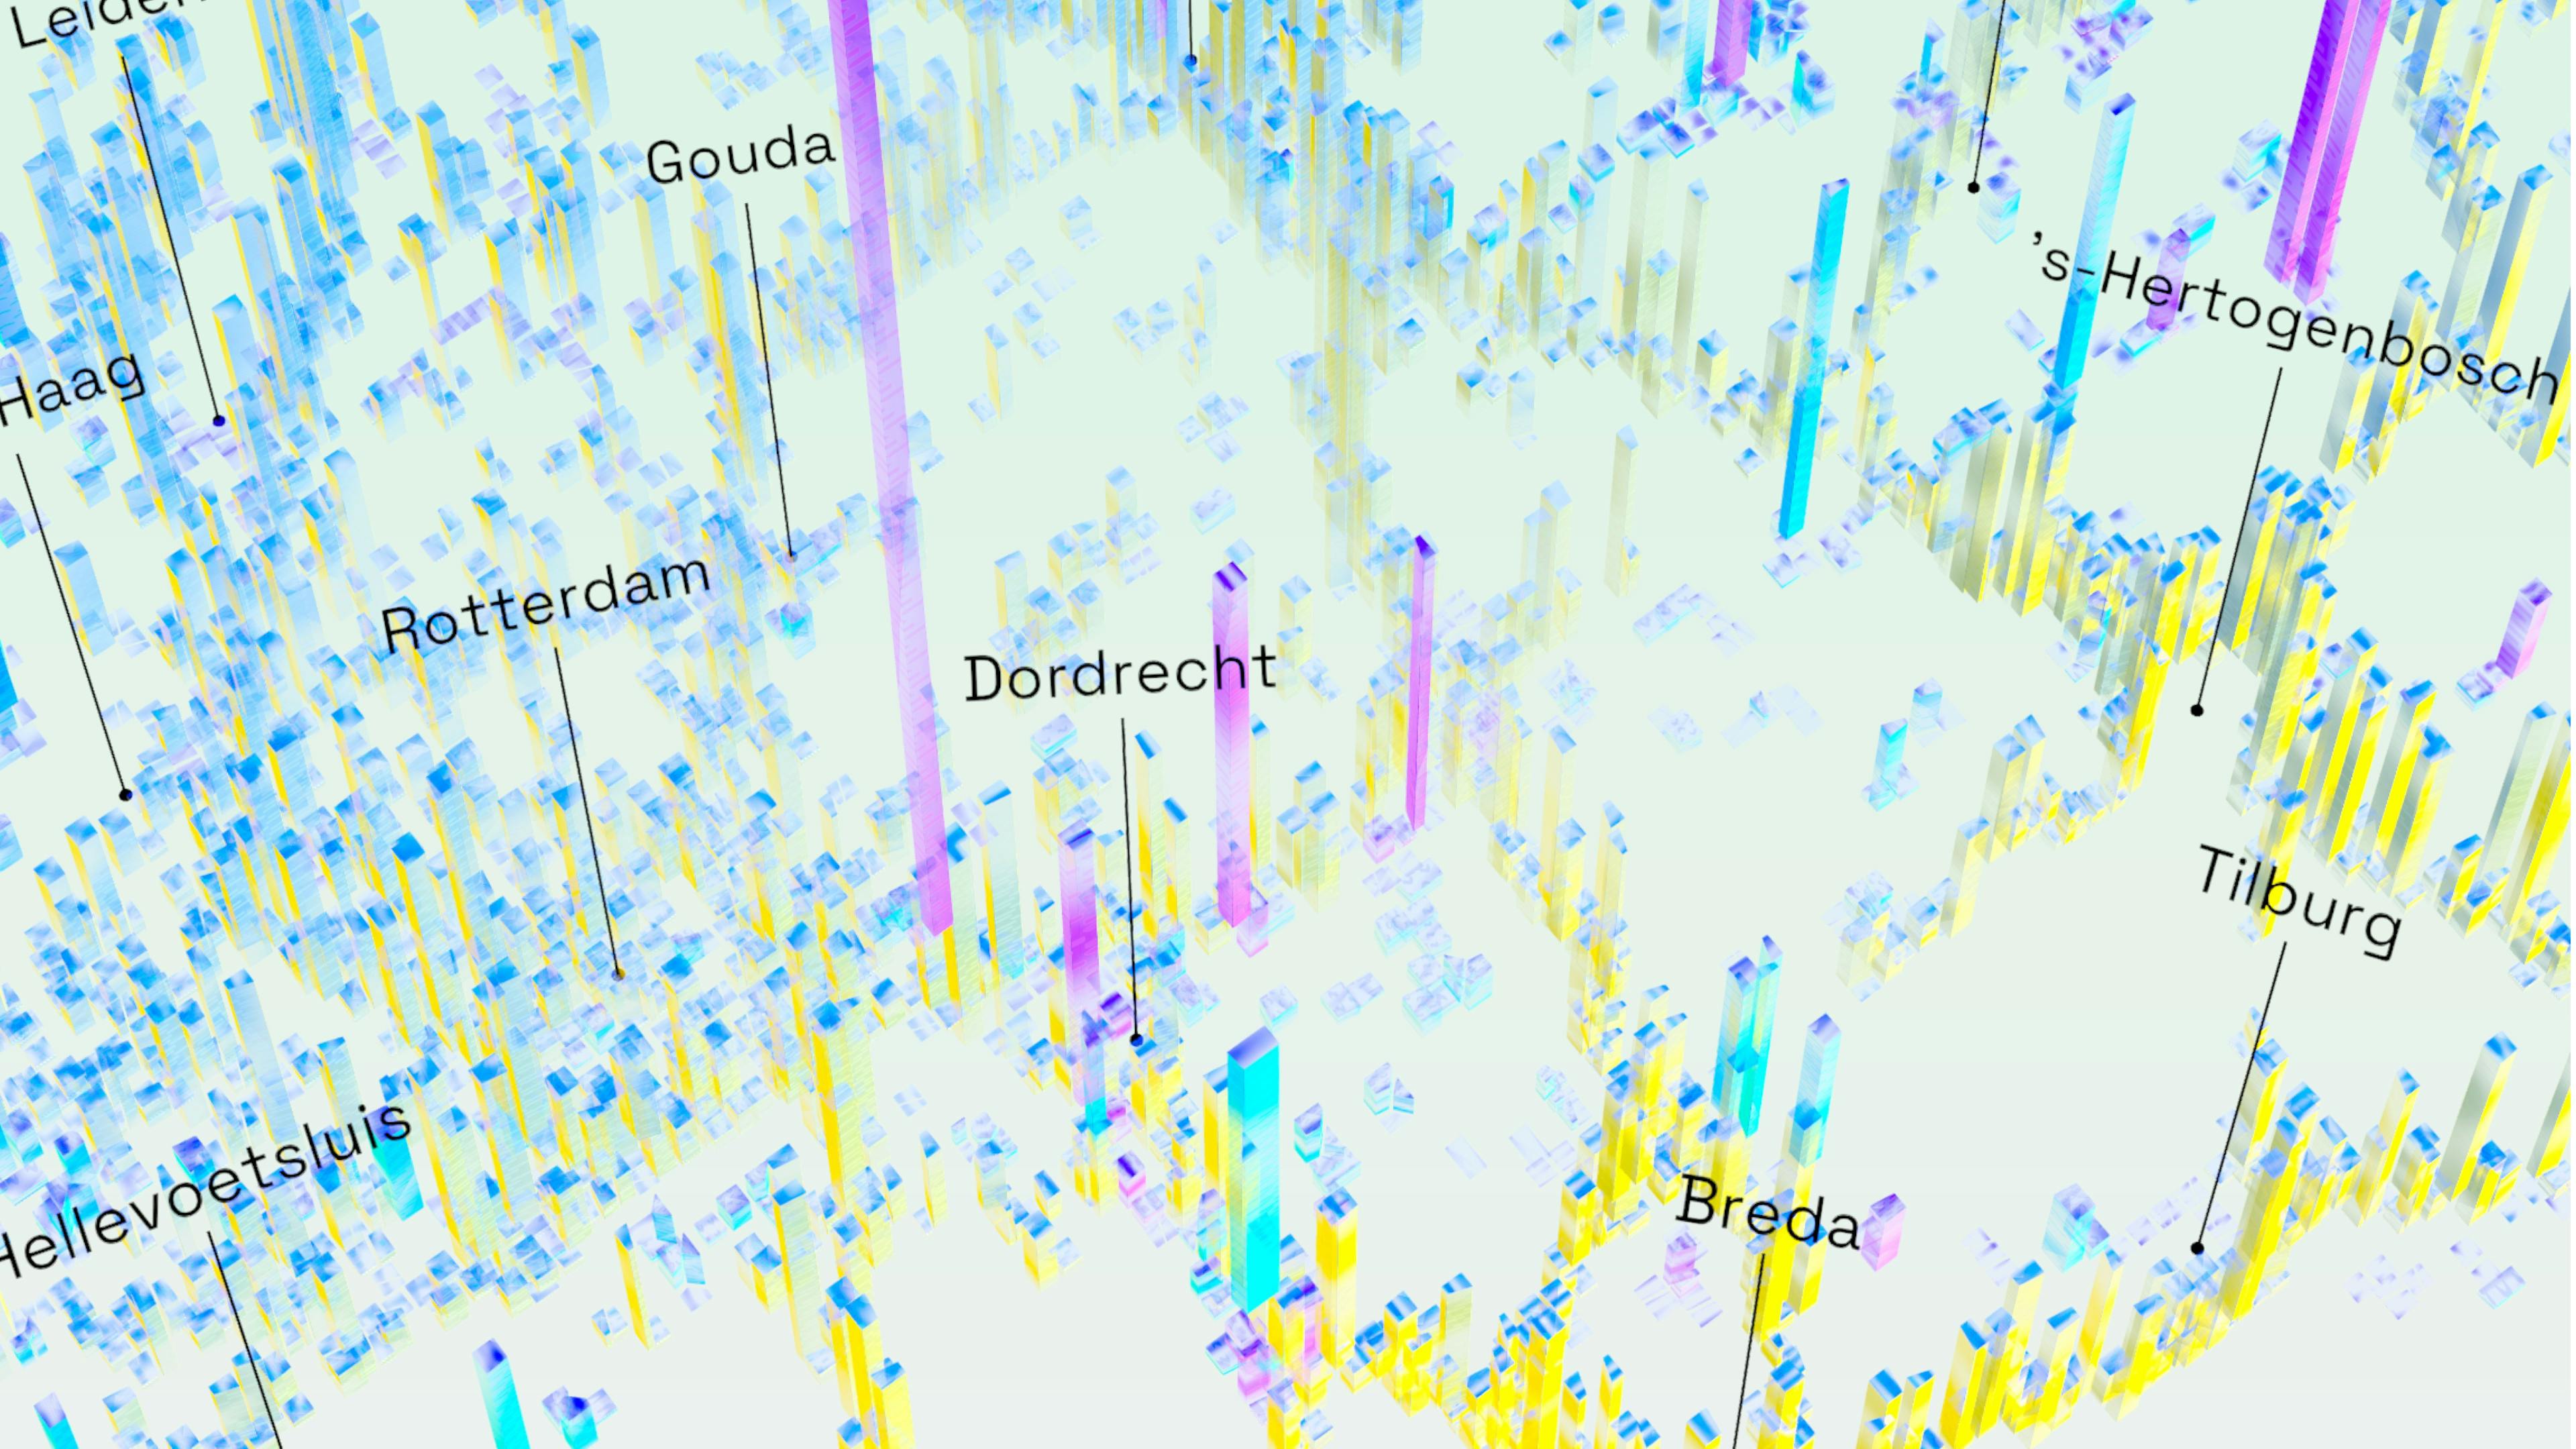
Landscapeview
When the tiles are grouped, the visualizations take the form of a data landscape over the Netherlands, making the data visible and tangible. For this, we used a game engine for real-time data rendering in 3D. We were able to show the real-time nature of the data: each parameter reflects the highest value for that data point, so its height changes every time the data is updated. Depending on the frequency of updates, the movement of the columns can be fast or slow. In addition, the color and pattern of each column changes in a reflective way, creating a dynamic and living display.
Thenetworks
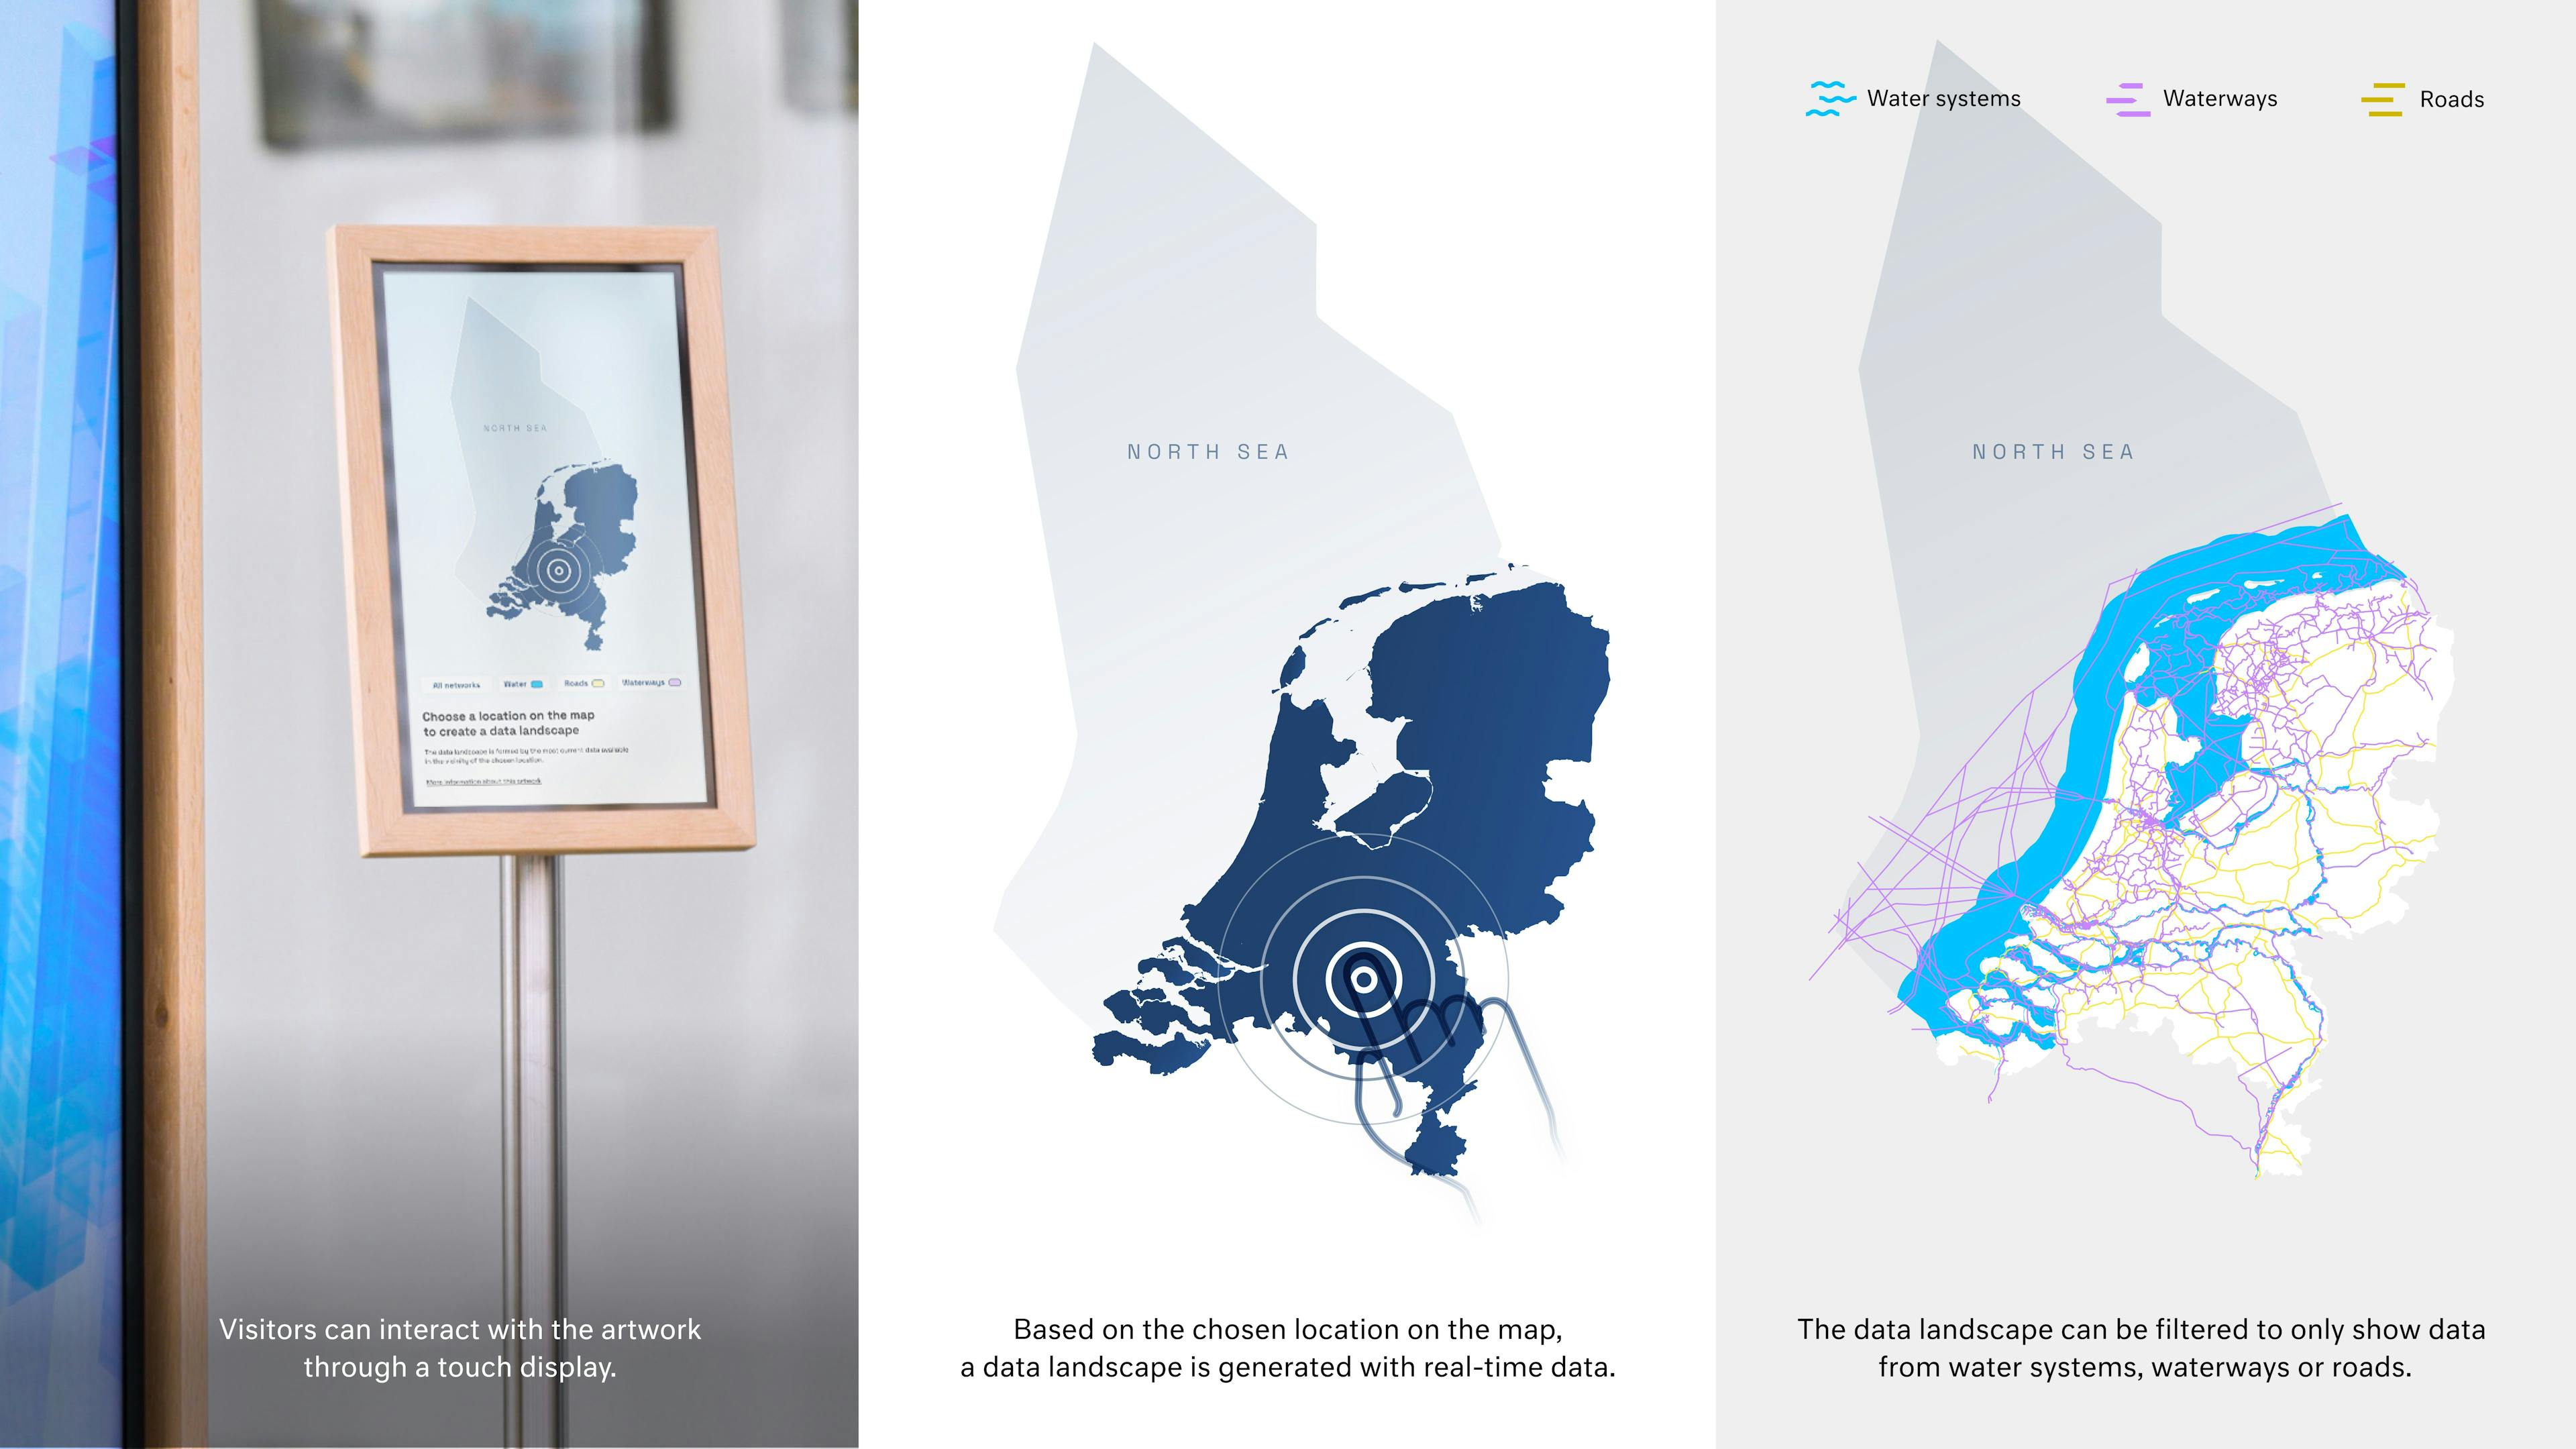
To let visitors engage with the data and learn more about Rijkswaterstaat, we made the installation interactive. The data is separated into three networks, modeled after Rijkswaterstaat’s own structure: water systems, roads, and waterways. On the second touchscreen display, the user can select a network and a location on the Dutch map, which results in the large display showing visualizations for whatever types of data are collected on that location.
Flexibledata
We set up the installation in such a way that Rijkswaterstaat can add other data sources later, keeping the installation active and dynamic. Whether it is updates on the existing data, new types of data, or temporary data sources, they can easily integrate these into the existing installation. For instance, on International Bird Migration Day, Rijkswaterstaat can showcase the yearly count of birds, or any other data they have related to birds.
Technology
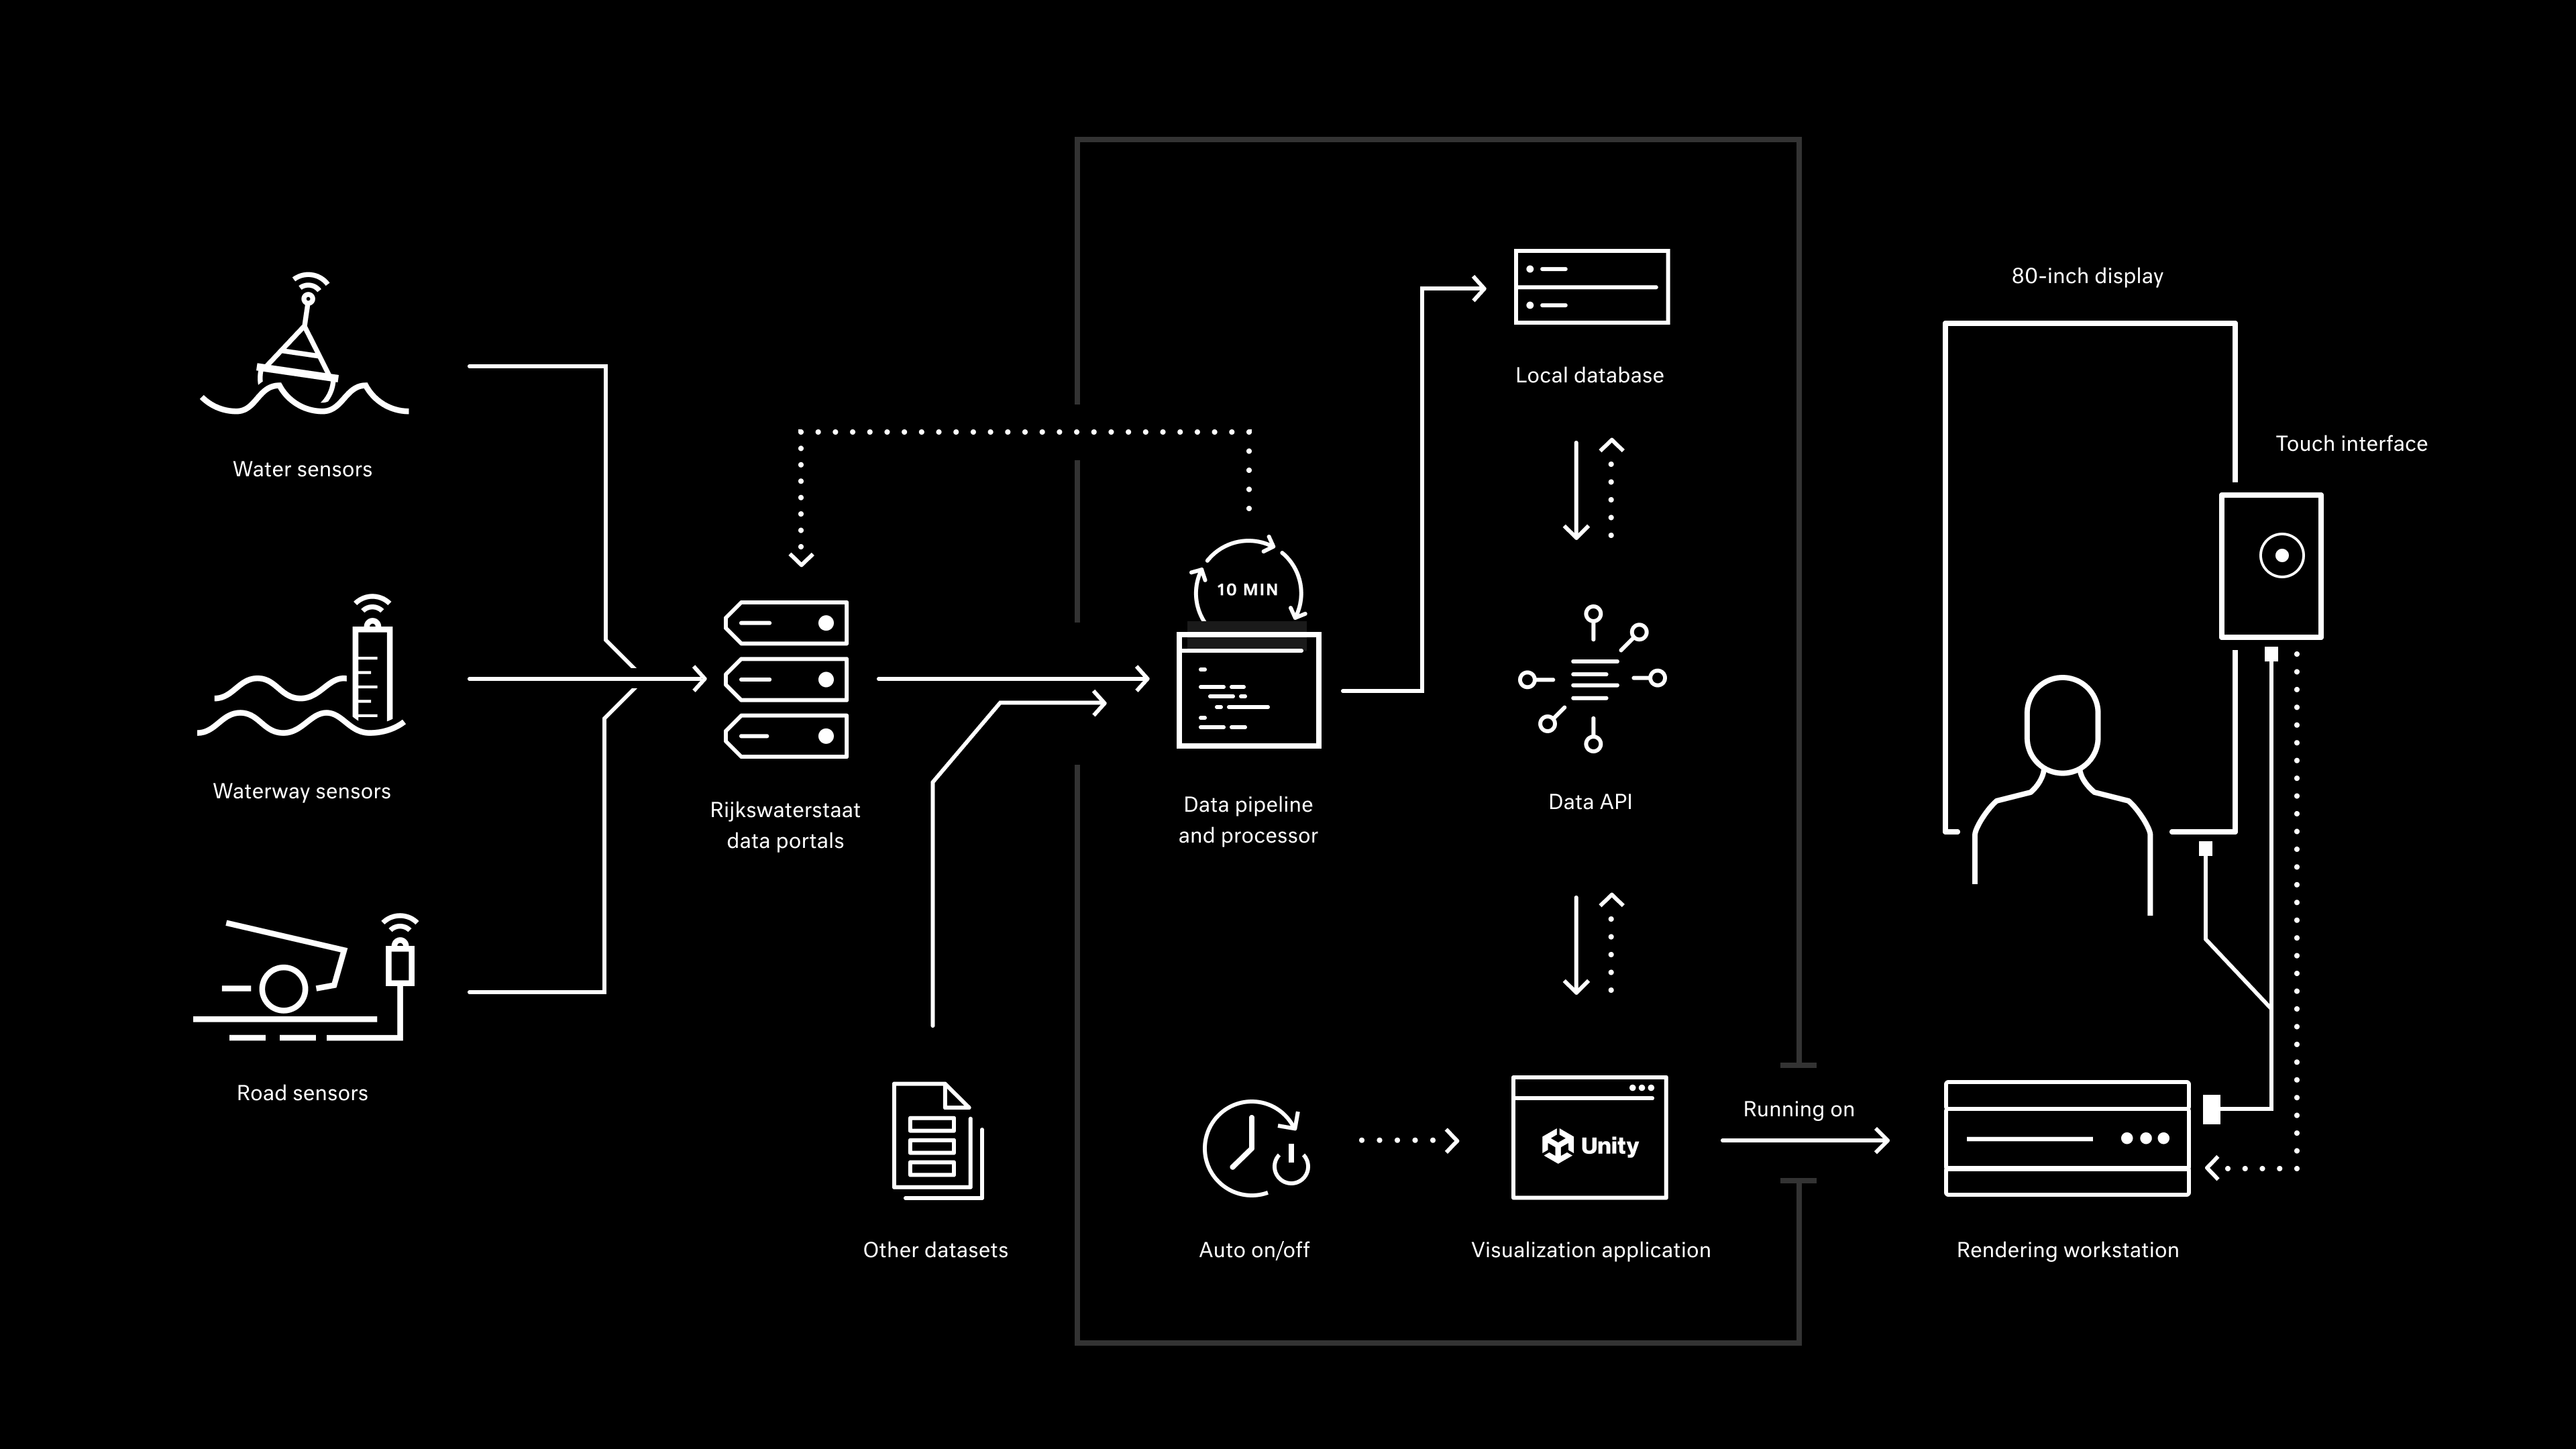
Rijkswaterstaat captures and consolidates diverse sensor data across many locations into multiple databases. The installation features a data pipeline that fetches and processes data from these sources every 10 minutes. The processed data is stored in a local database and made accessible through a Flask API. Leveraging the Unity game engine, we developed an application that dynamically generates the 3D data landscapes, operating autonomously or interactively based on user input.
The system runs on a high-performance and composed workstation, ensuring real-time 4K and 120fps visualization. It features an integrated data system that functions offline, with a pipeline that filters inaccuracies and resumes data collection when online. This standalone capability boosts the system's resilience and mobility, enabling easy deployment to various locations such as trade shows or different offices.
Results
In an increasingly complex world involving intricate problems like climate change and rising population density, reliable data is all the more important to make sure everyone understands the world around them. The data-driven installation we created makes the hidden world of Rijkswaterstaat’s data visible, and gives people a chance to explore the importance of this data.