Creating a new memorable experience for live events
Statistics
- Client
- Red Bull
- BYBORRE
- Partners
- Centrum Wiskunde & Informatica
- Awards
- European Design Award
- FWA of the day
- Infographics Jaarprijs
- Deliverables
- Unique data visualizations of guests as a personalized souvenir
The challenge
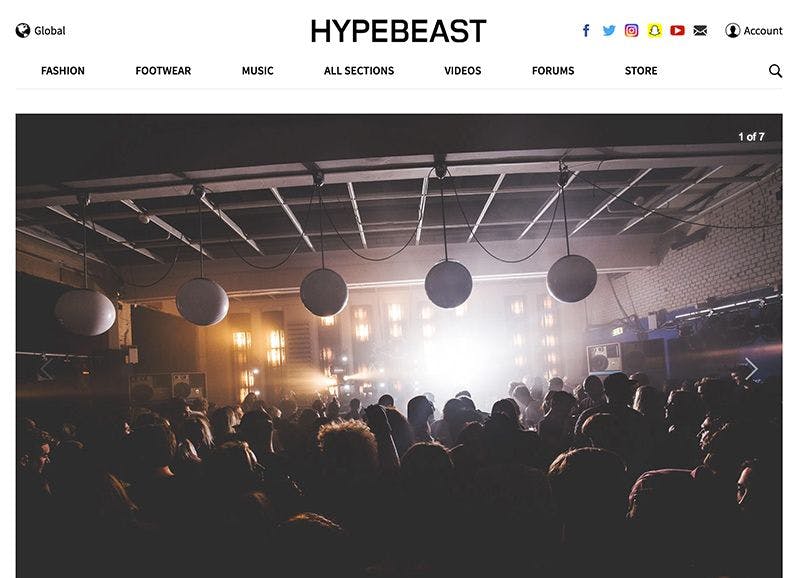
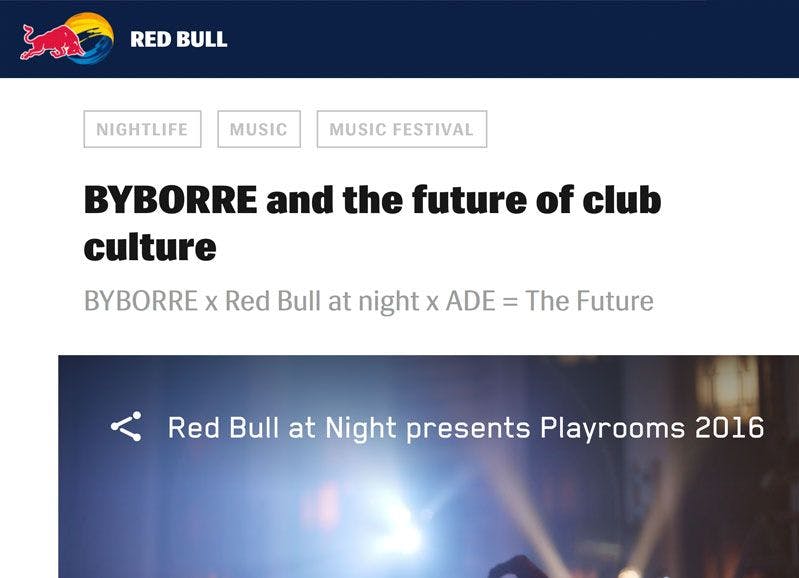
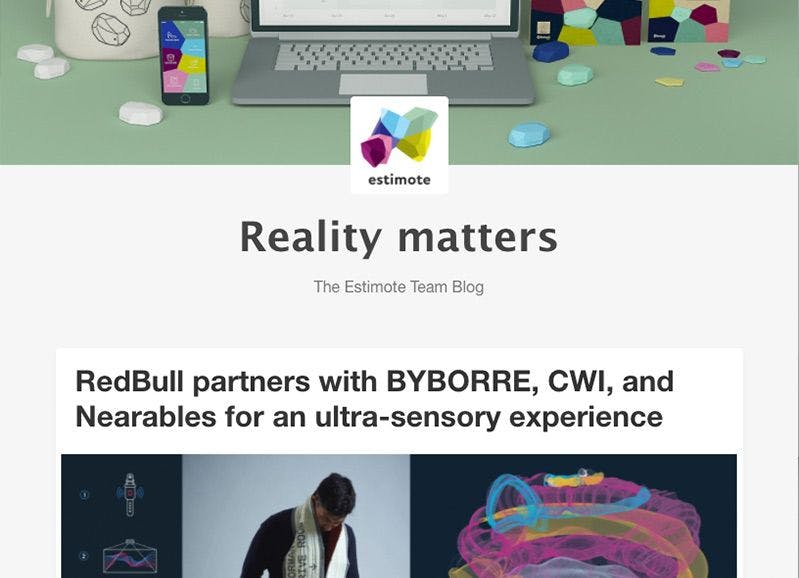
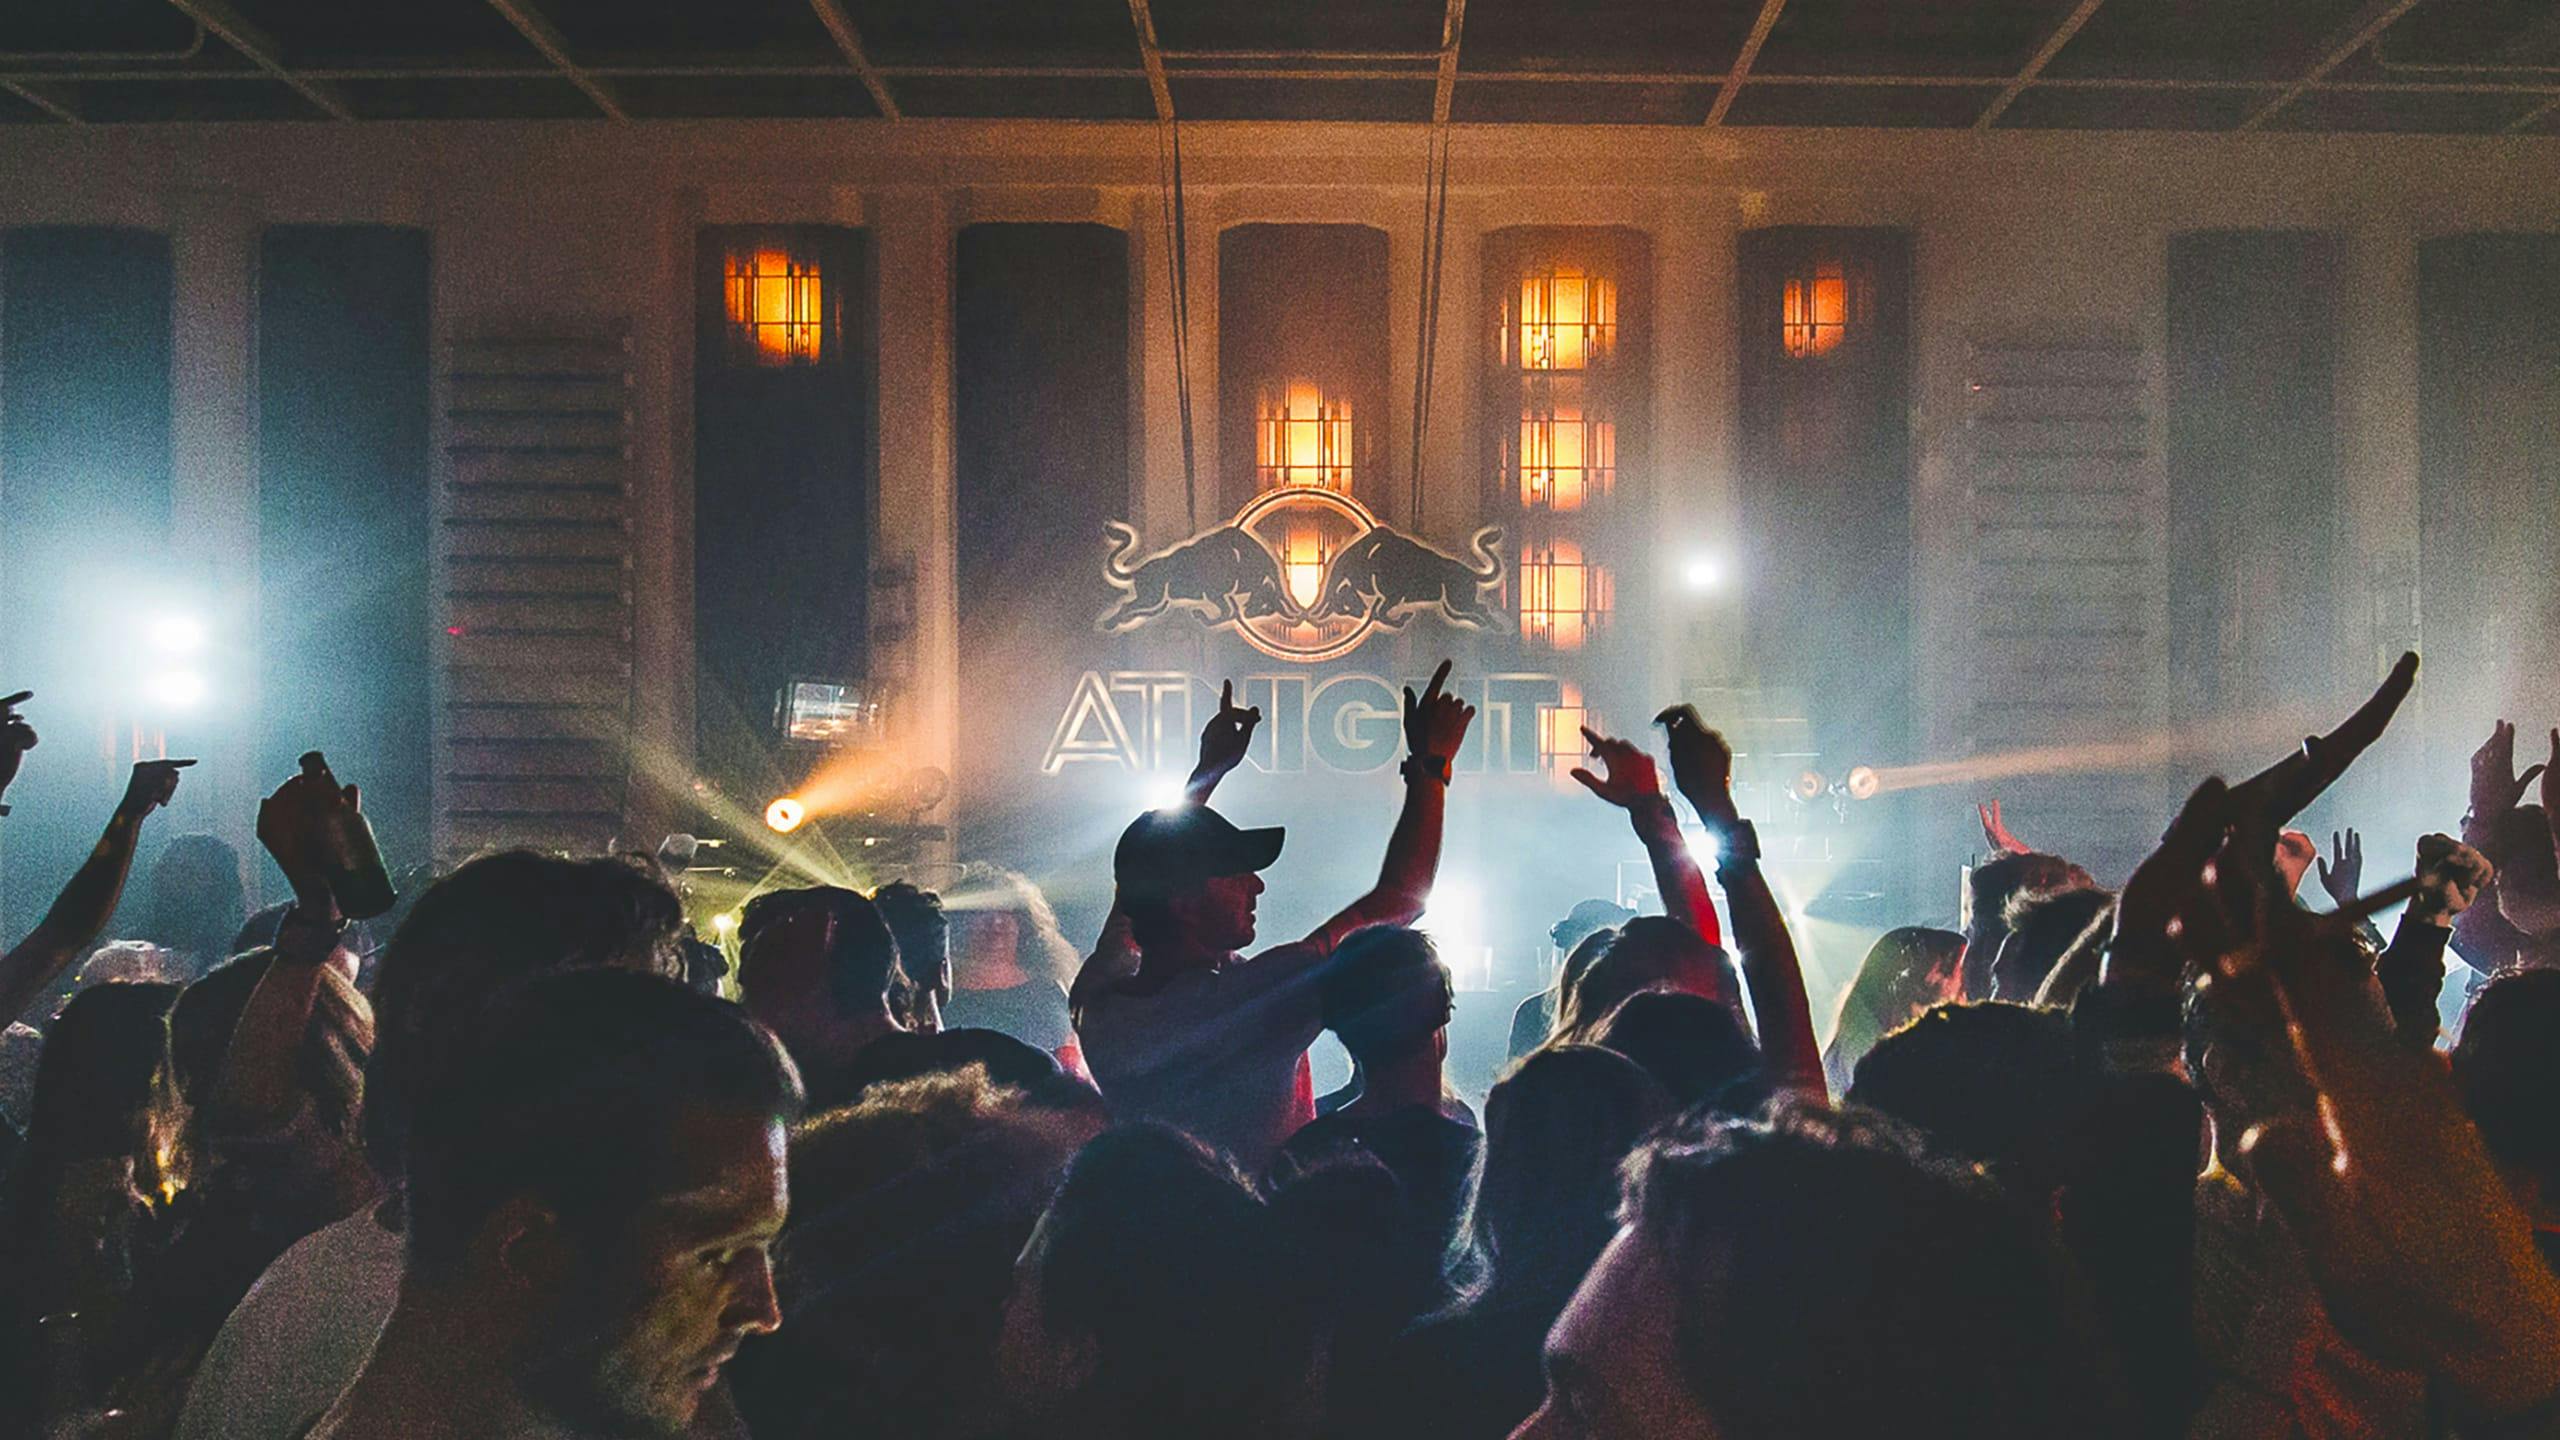
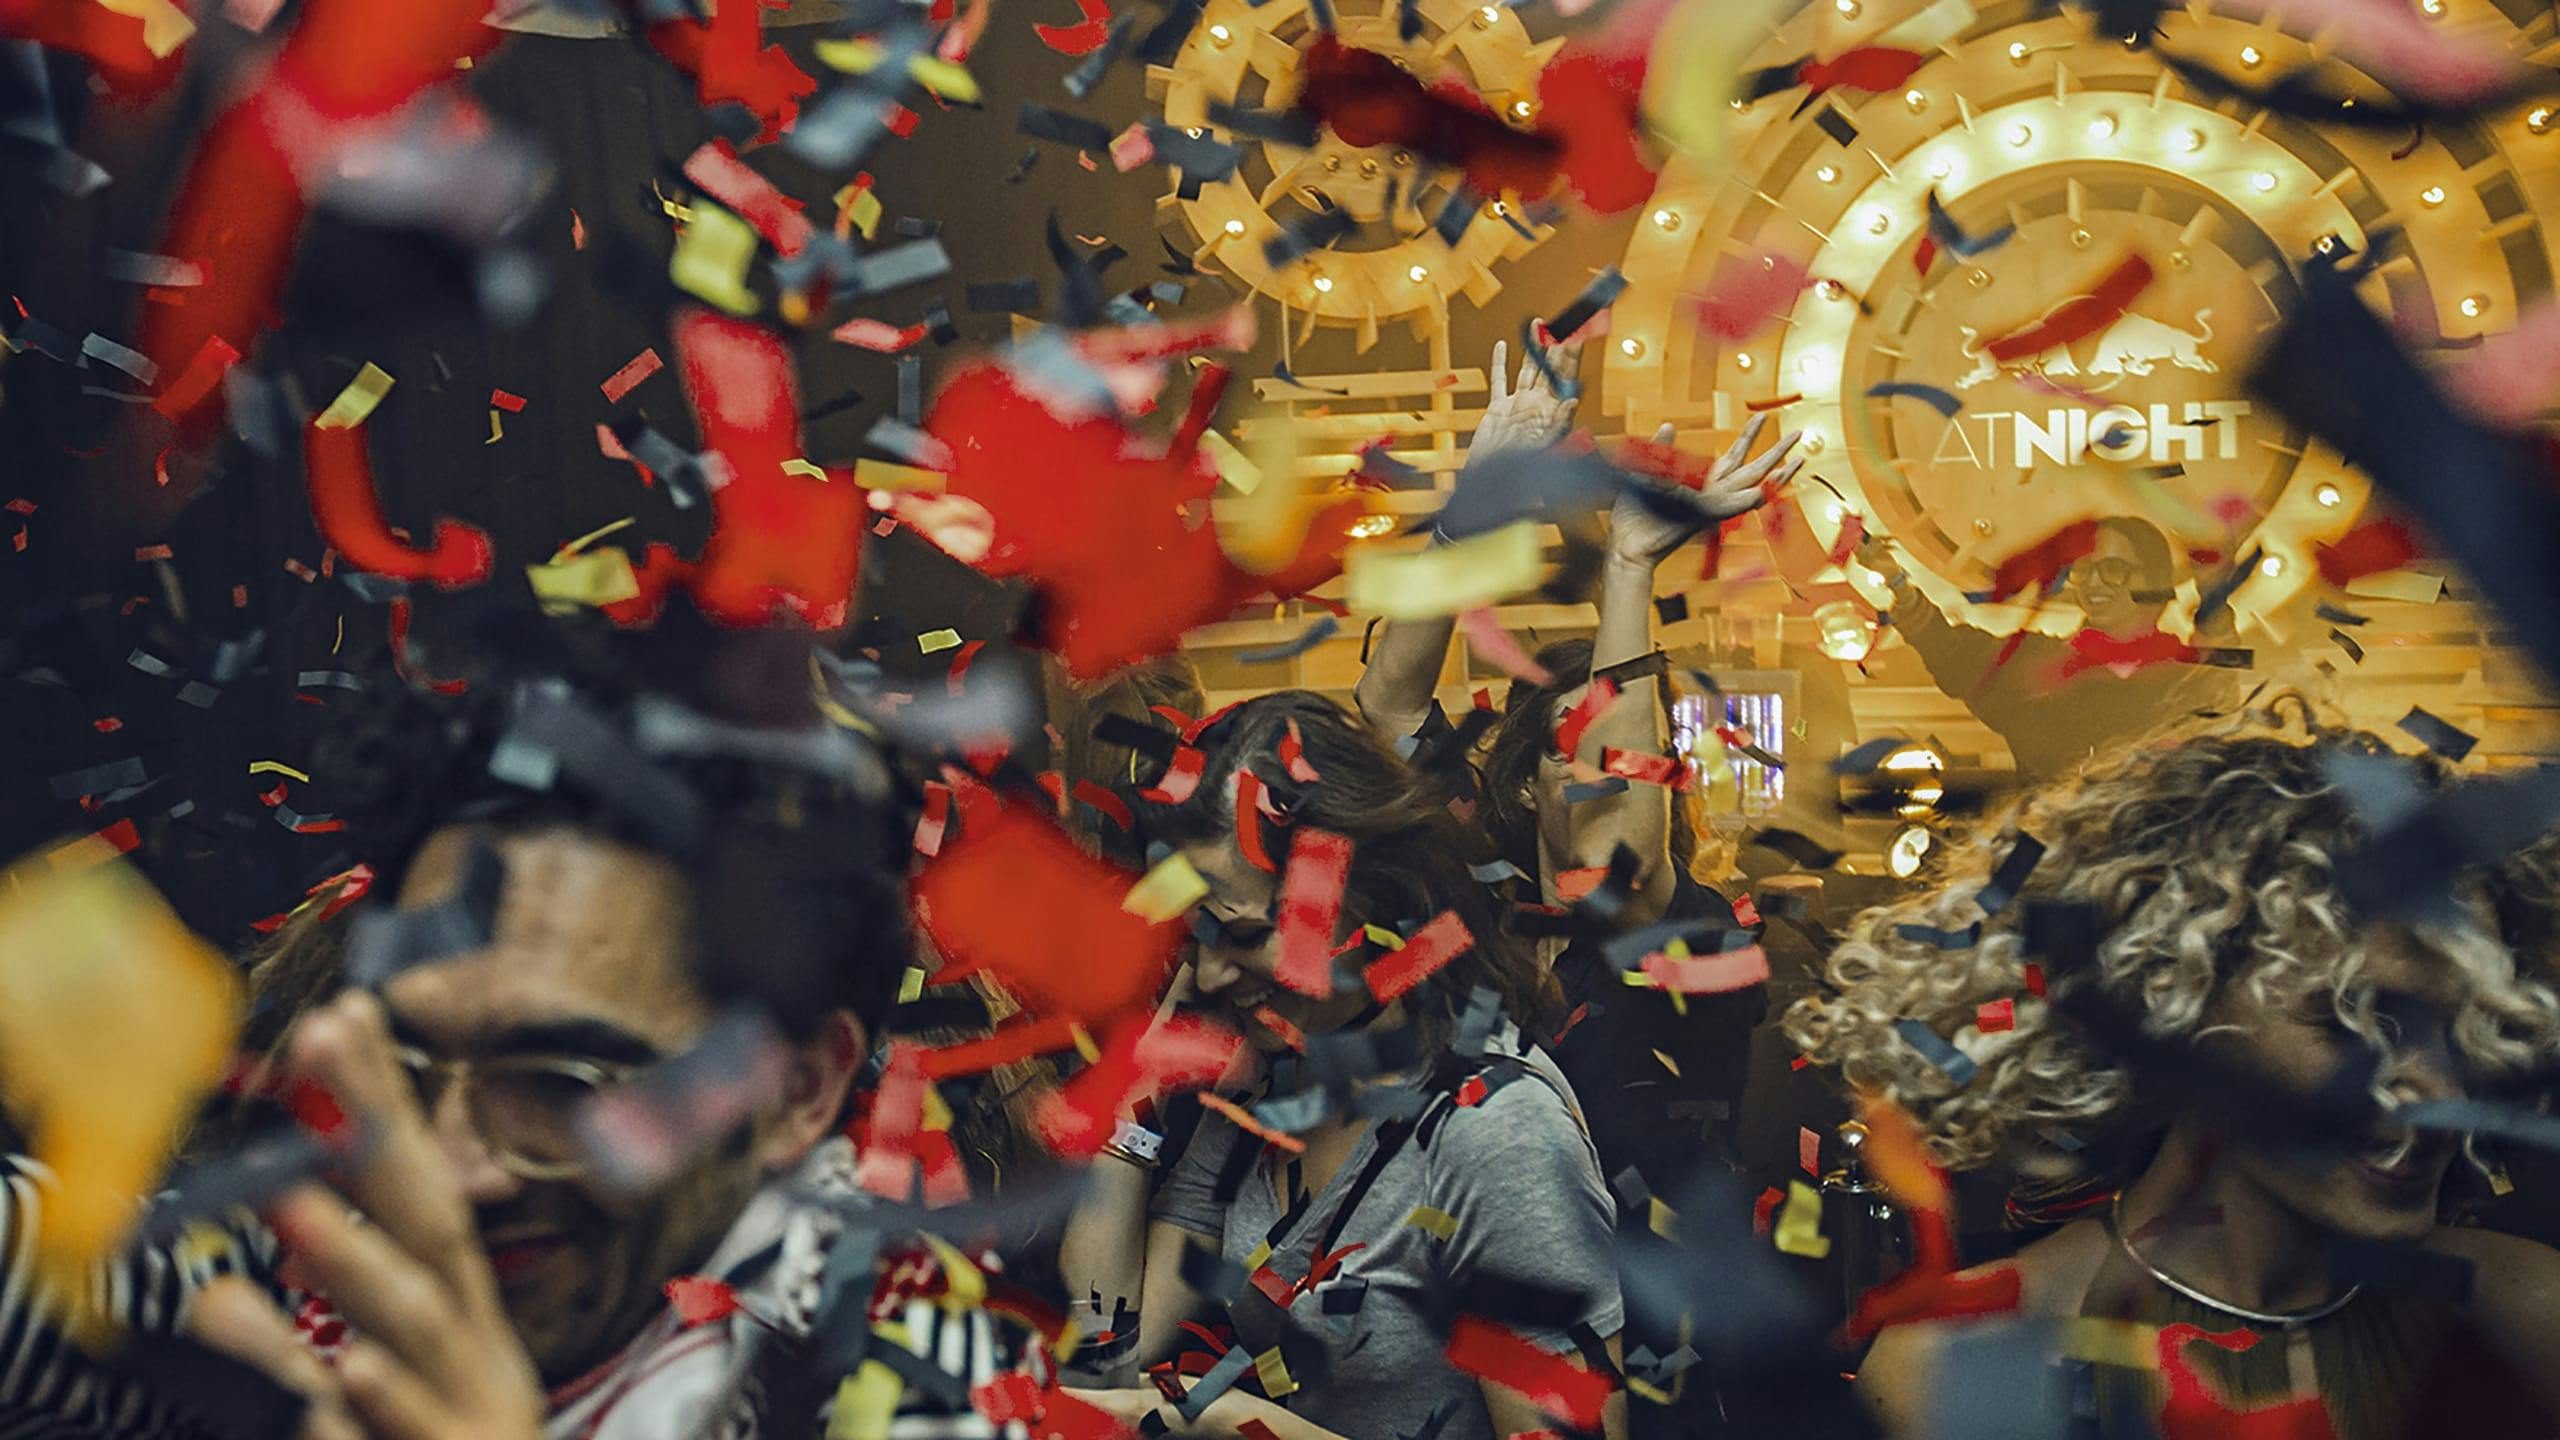
CLEVER°FRANKE was invited to collaborate with fashion brand BYBORRE to create personalized data visualizations and a unique experience for guests of the Red Bull Playrooms during the Amsterdam Dance Event (ADE) festival. During this Red Bull event – one of the most sought-after events to attend – music, art and technology come together to stimulate the senses.
By combining our expertise in technology and visualization with BYBORRE’s circular knitting, we created an installation that exists at the intersection of art, science and technology, and an unforgettable experience.
Value delivered
A new dimension to the future of club culture, live events and data-driven experiences. Enabling brands to extend an event experience beyond a single moment and to provide completely new ways for customers to re-experience an evening afterwards.
Background
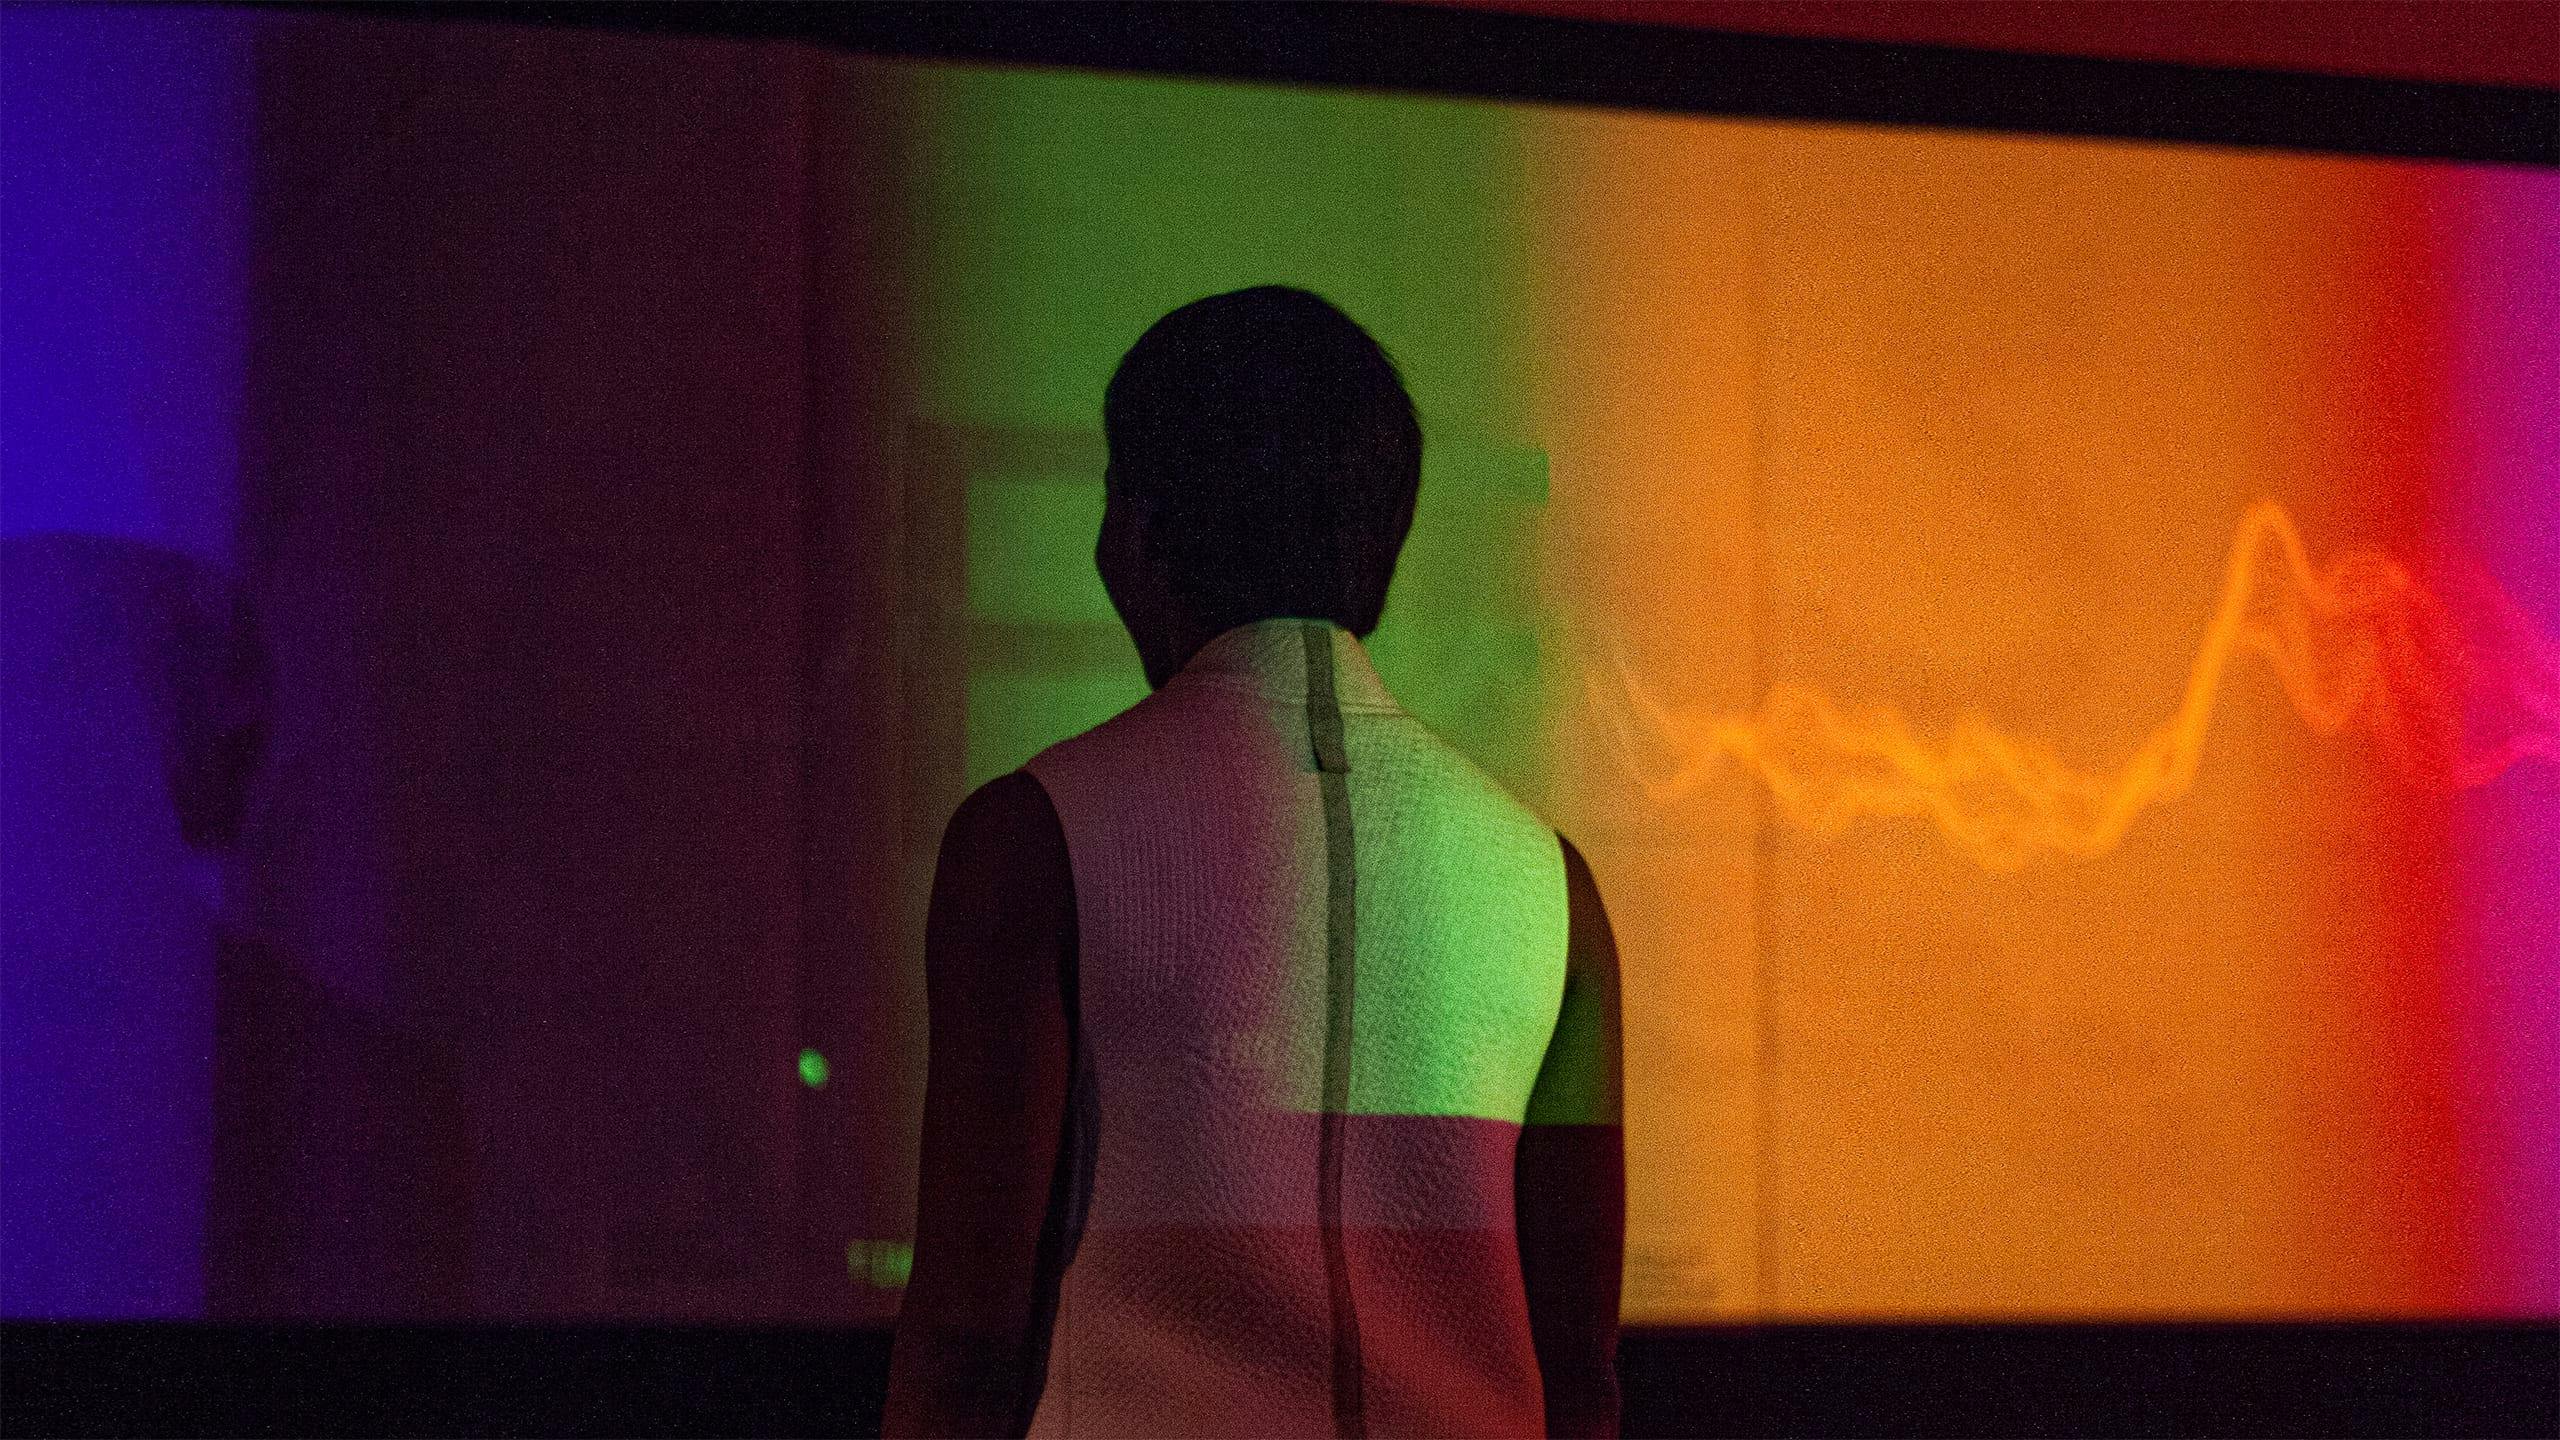
In an evening experience centered around stimulating all senses, we expanded the concept by using data as the ‘Sixth Sense’. It visually illustrates the journey of each guest through the event: their ‘flight of the night’. The incredibly tight delivery schedule of the project presented a challenge for our team, creatively as well as technically.
Phases and toolkit items used
Theevent
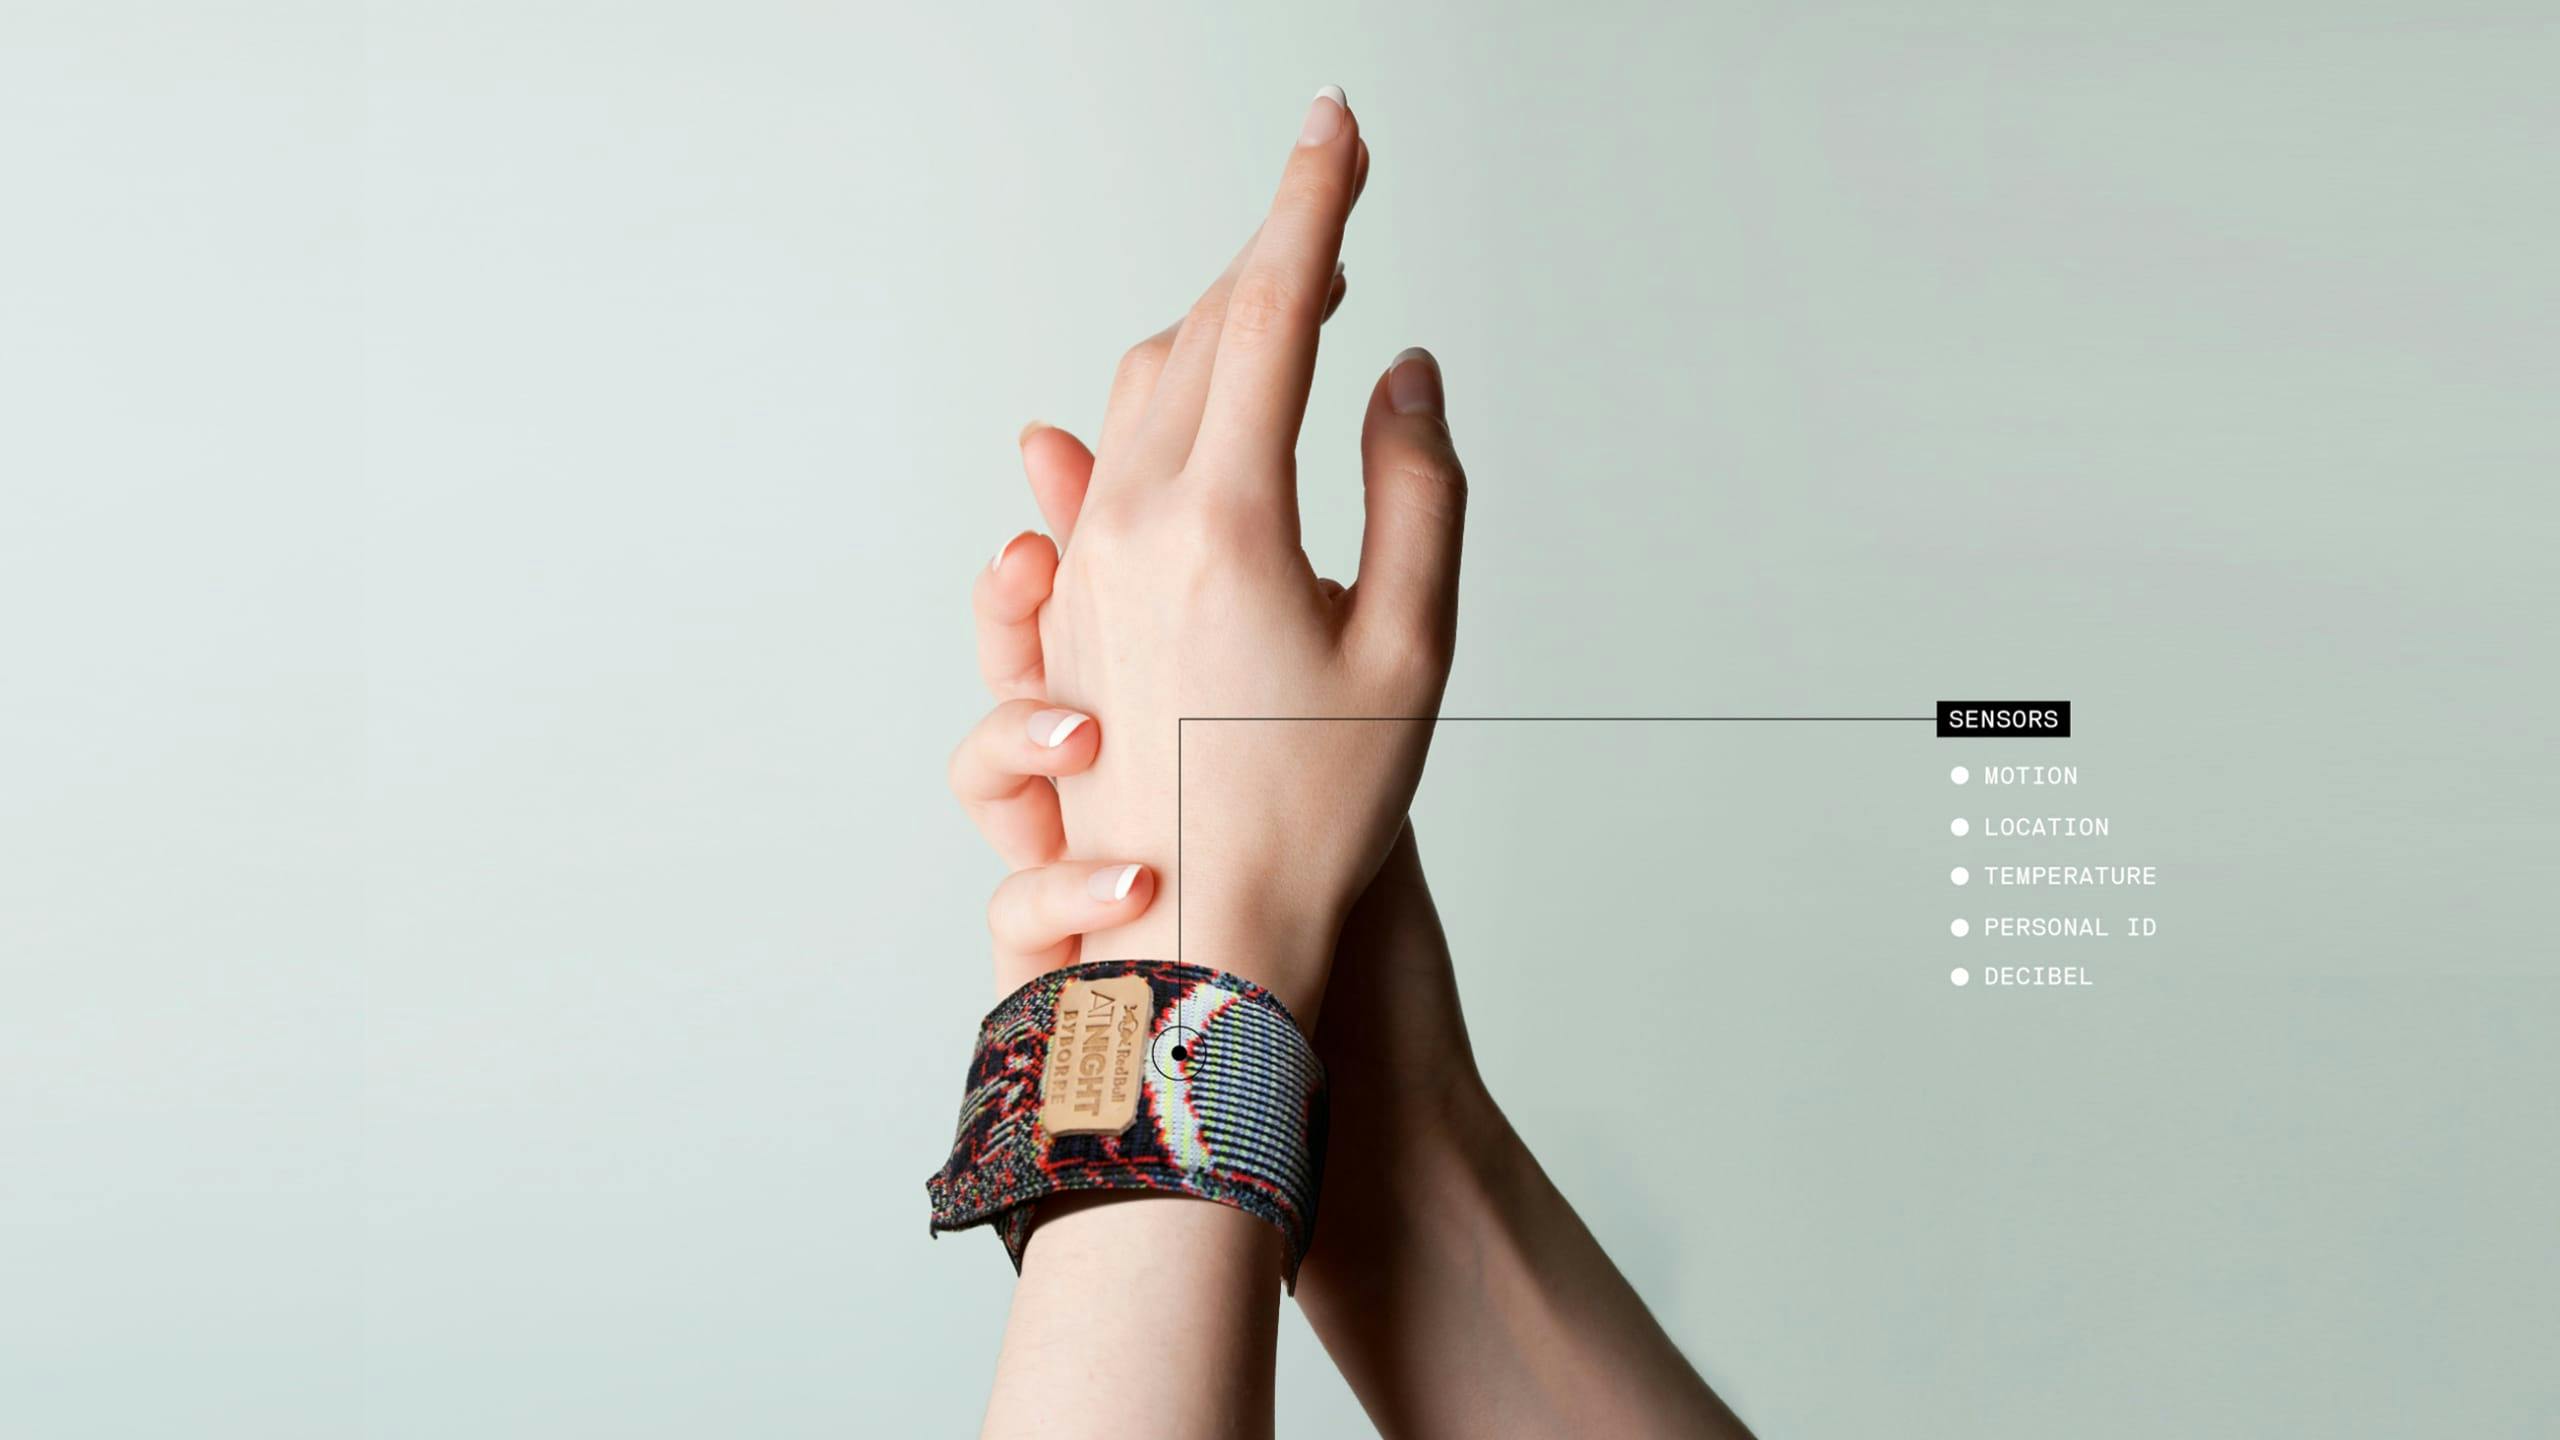
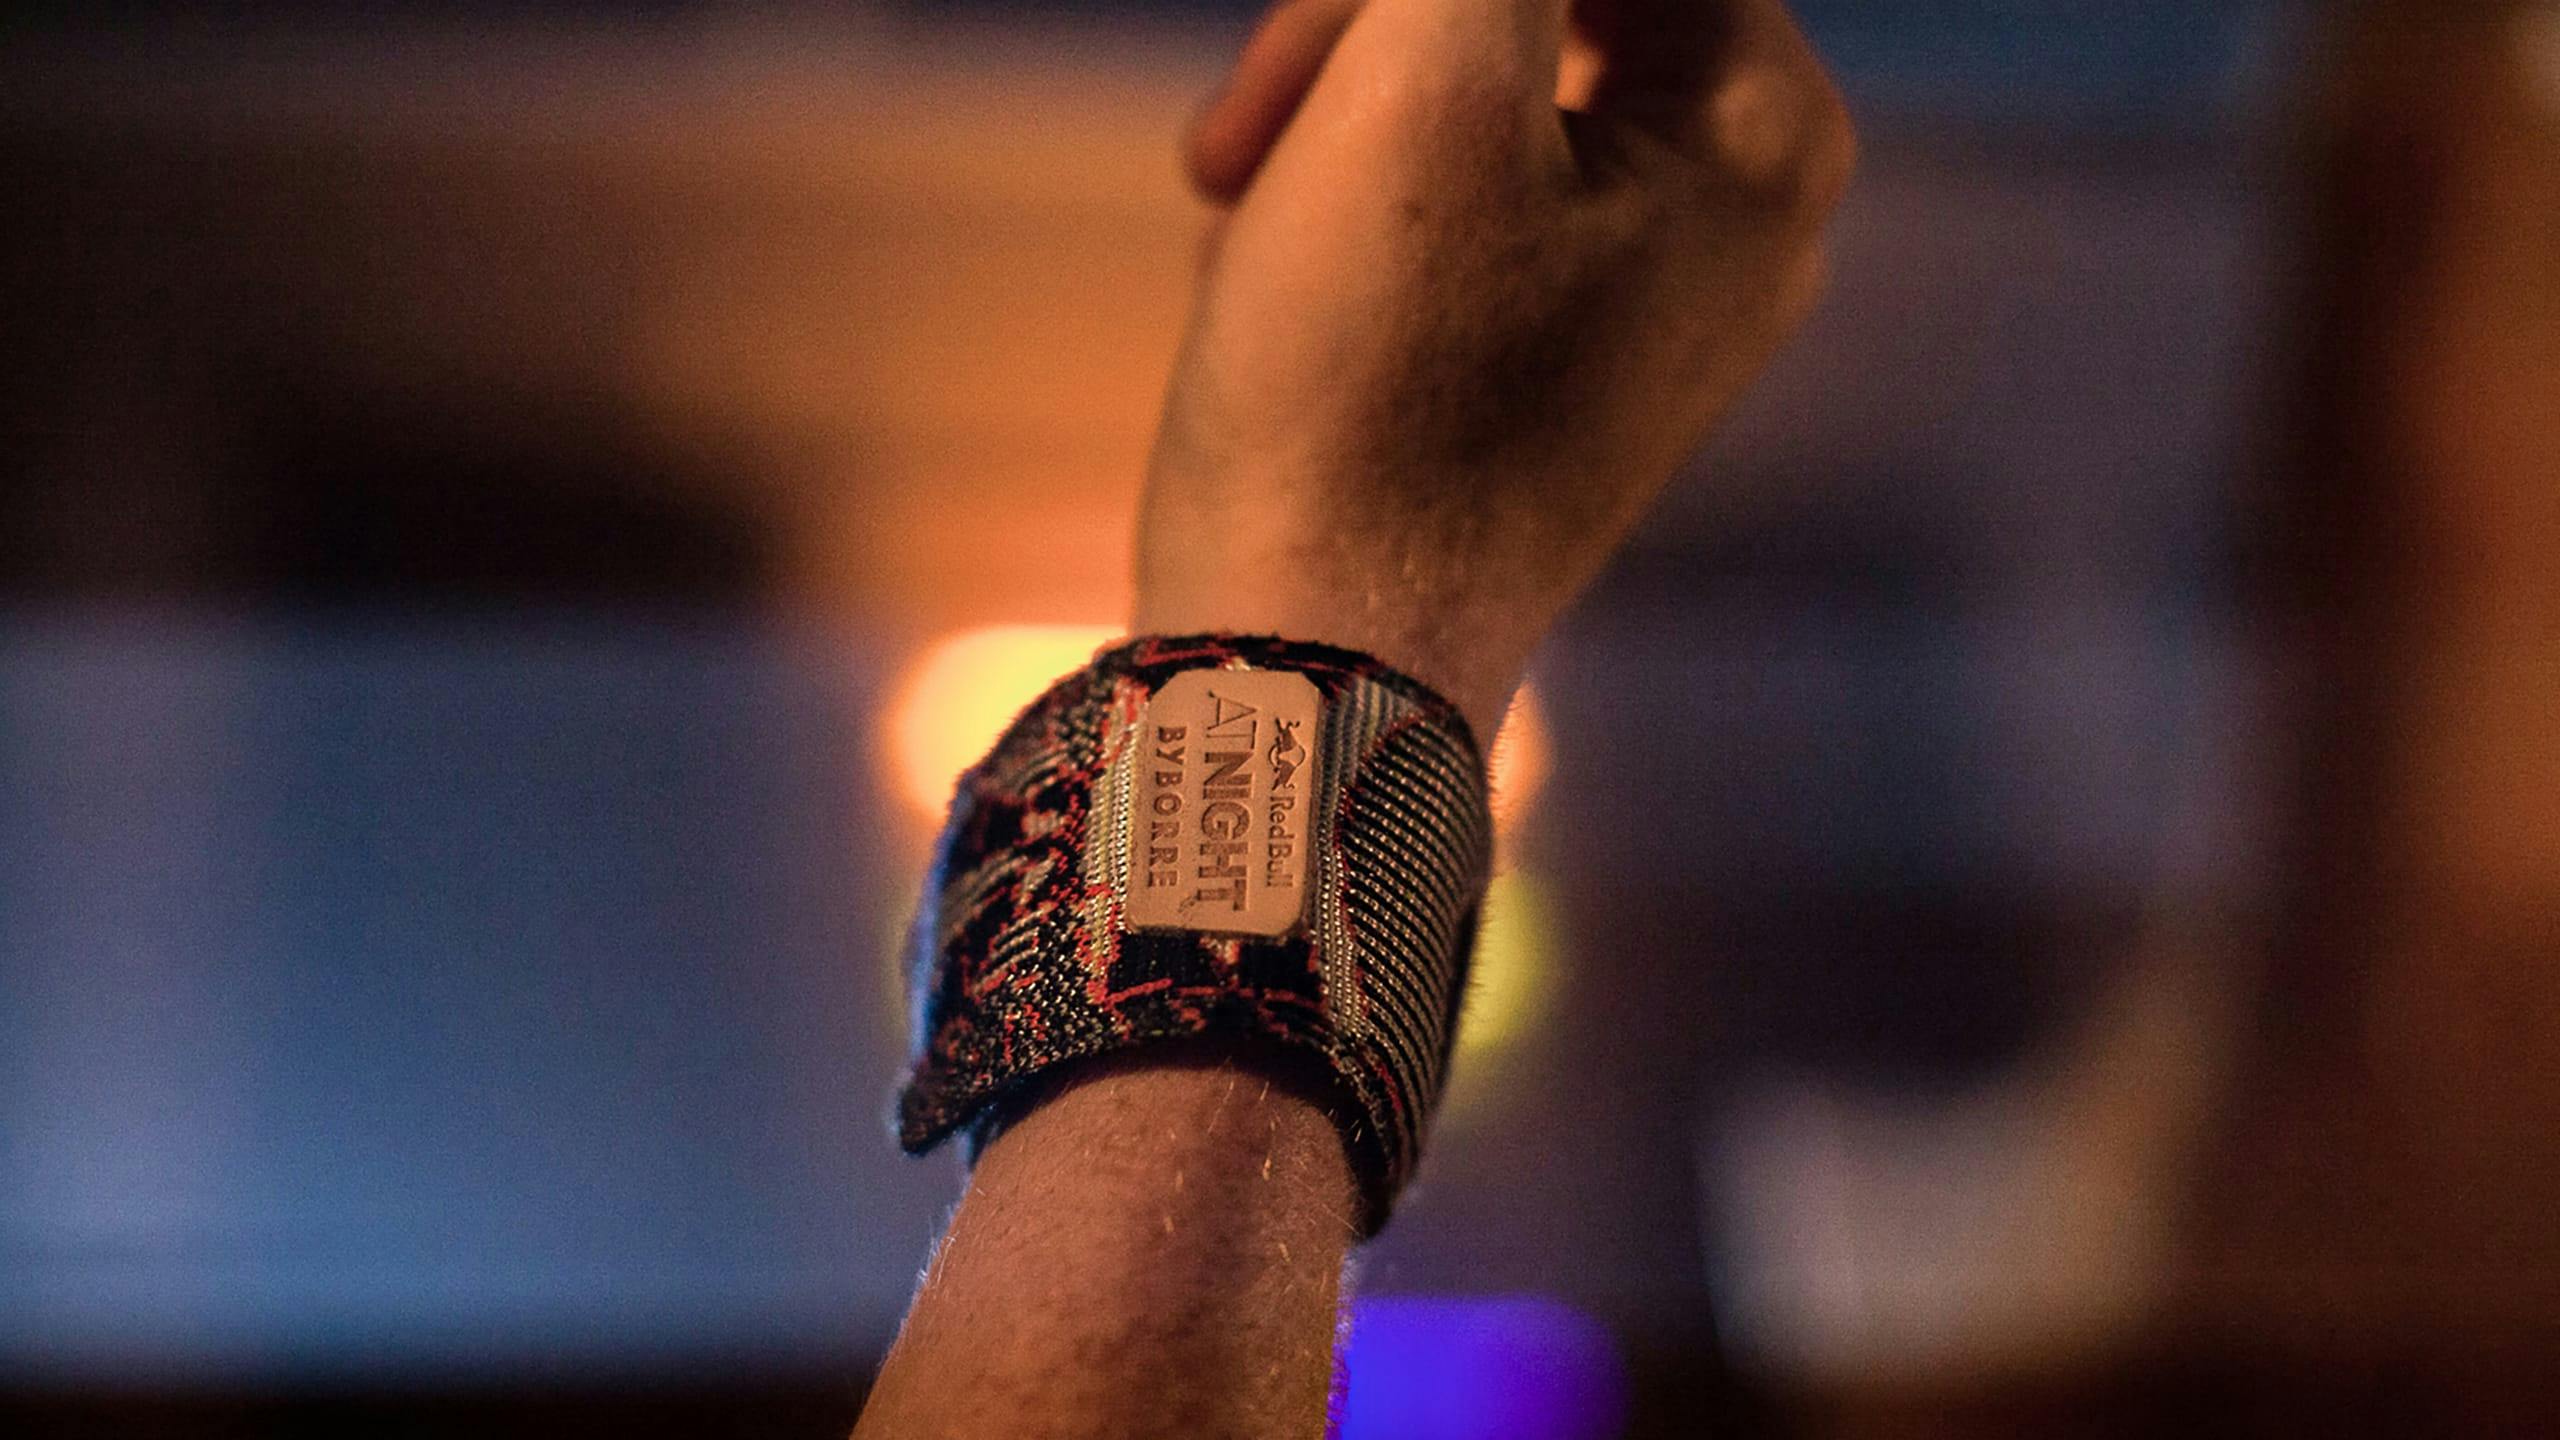
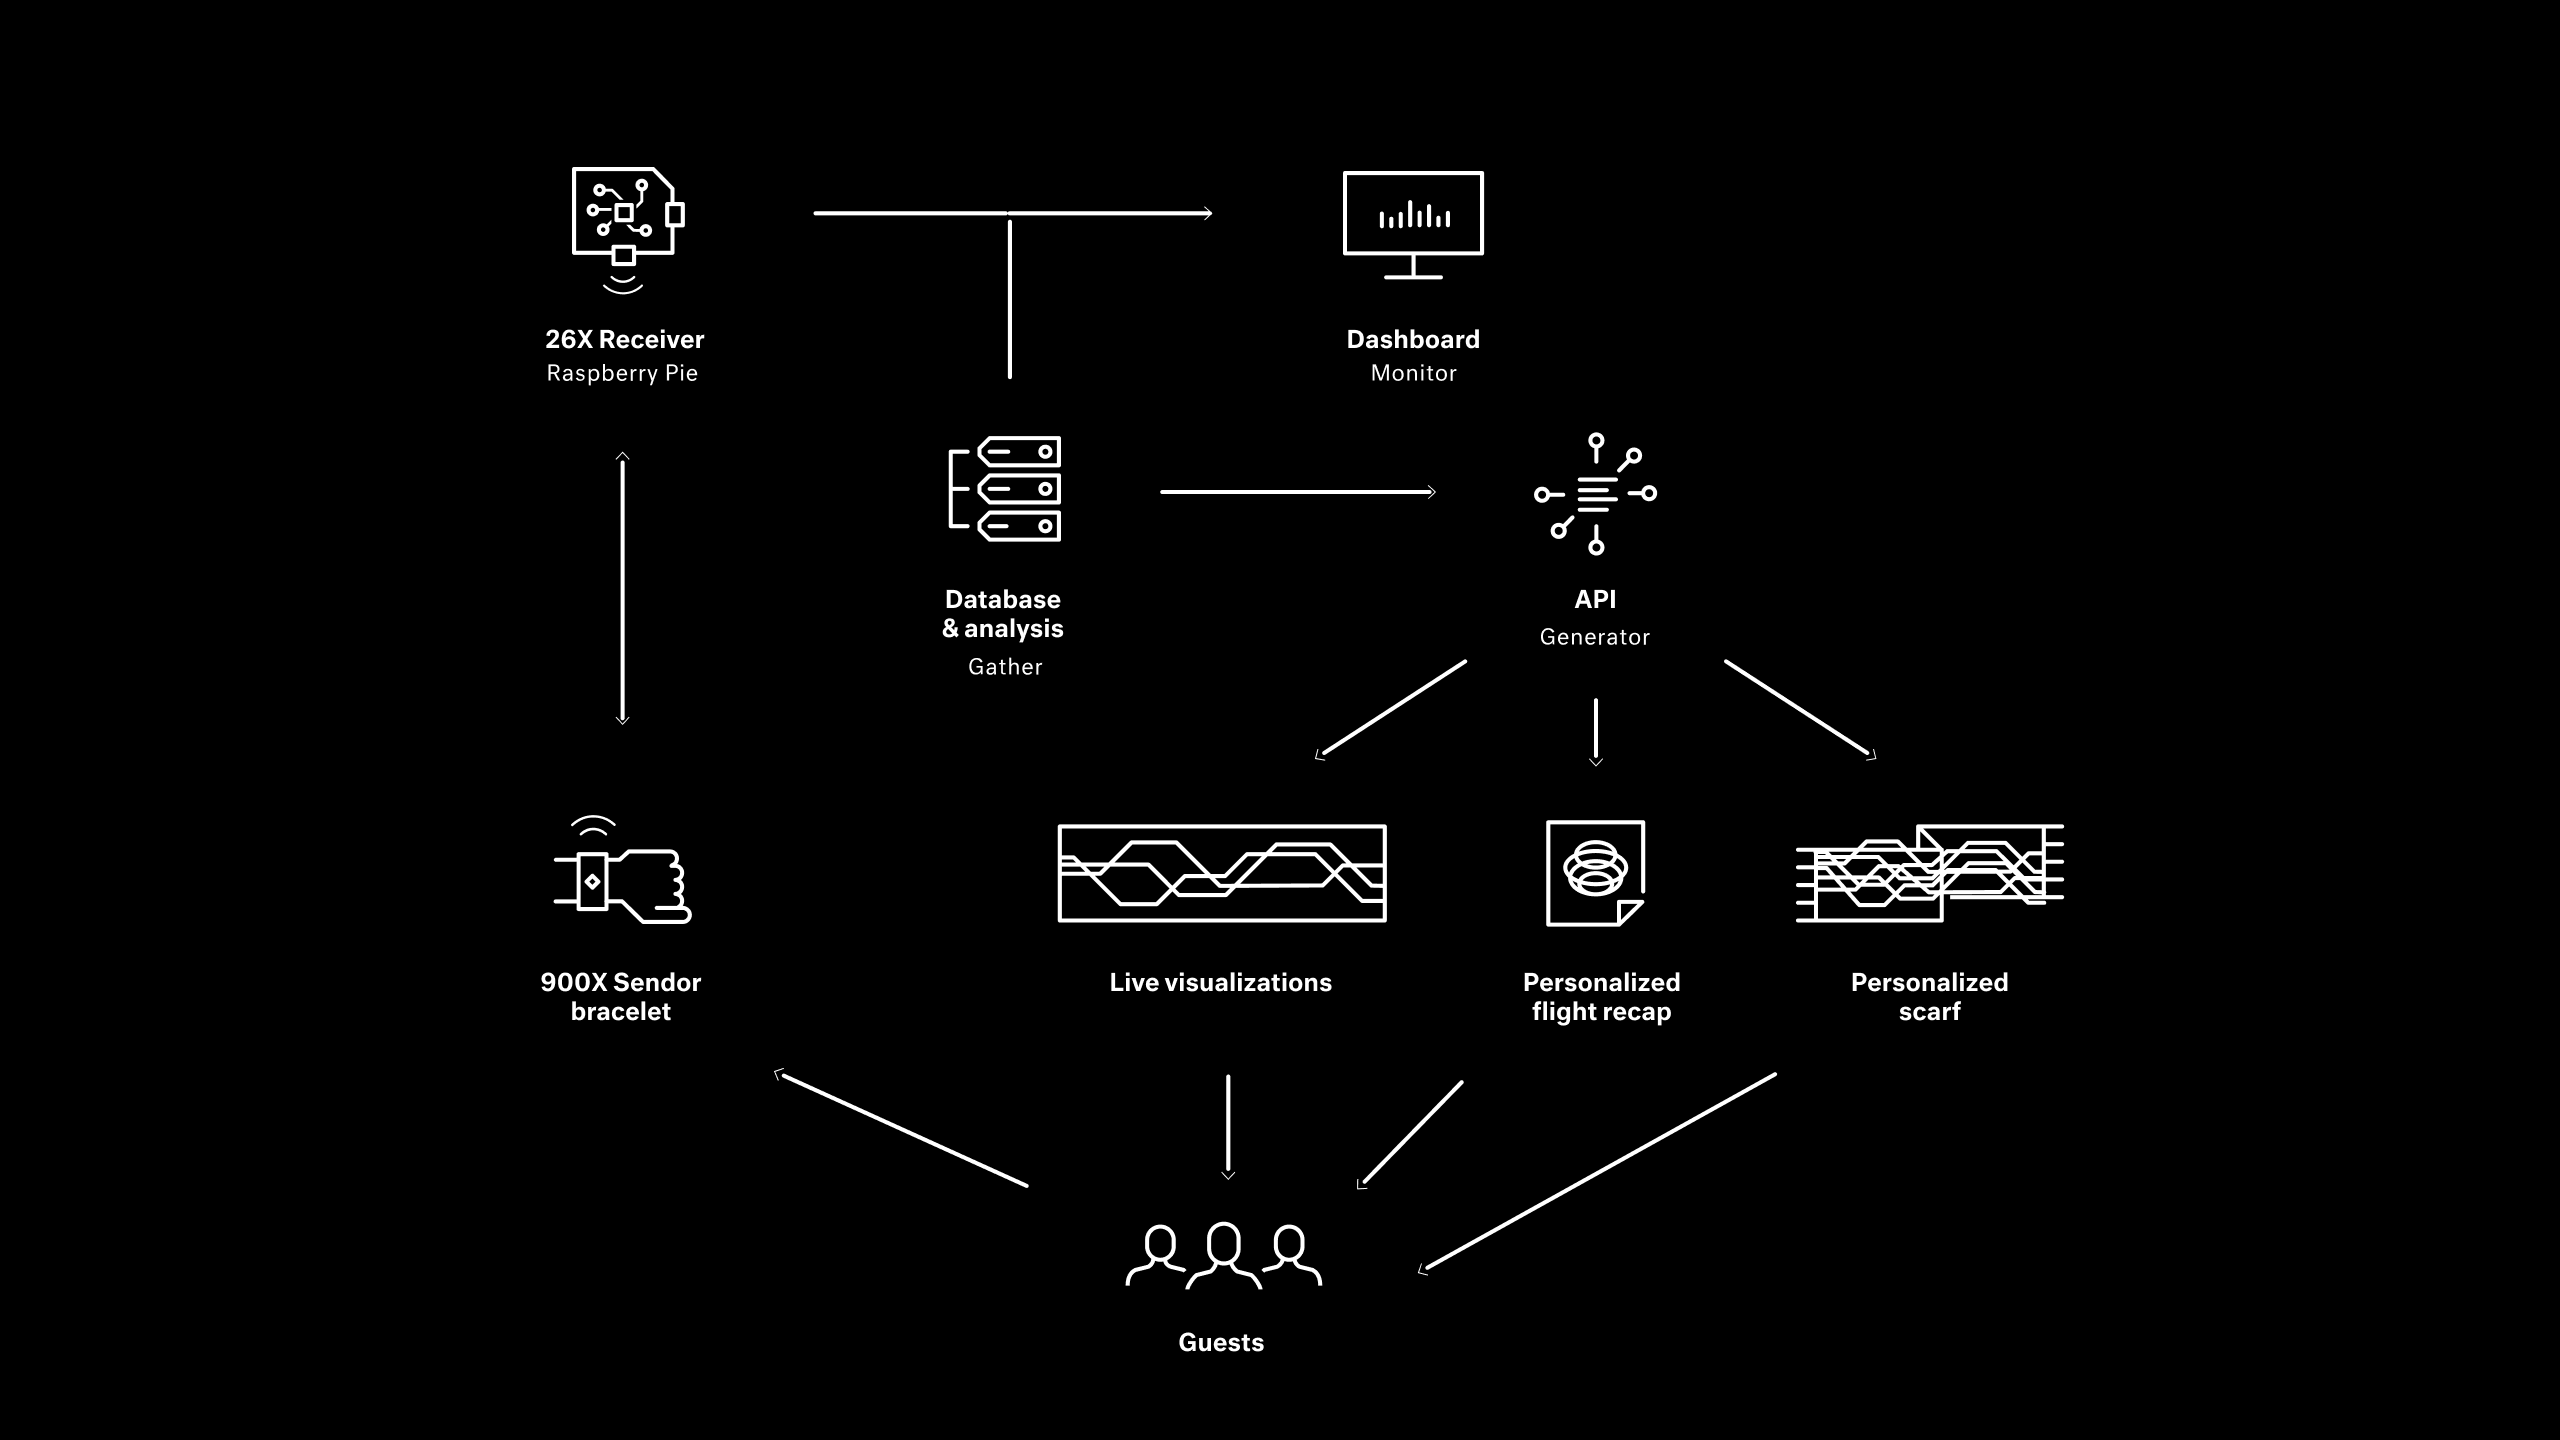
BYBORRE and Centrum Wiskunde & Informatica created custom bracelets, designed especially for the event, which seamlessly integrated an array of sensors within the fabric. Guests attending this special night were given the bracelet, which continuously gathered data during their ‘flight of the night’.
The bracelets measured position of the visitor in the venue, their movement, temperature and sound level. Each visitor provided their (nick)name, allowing us to further personalize the experience.
Design
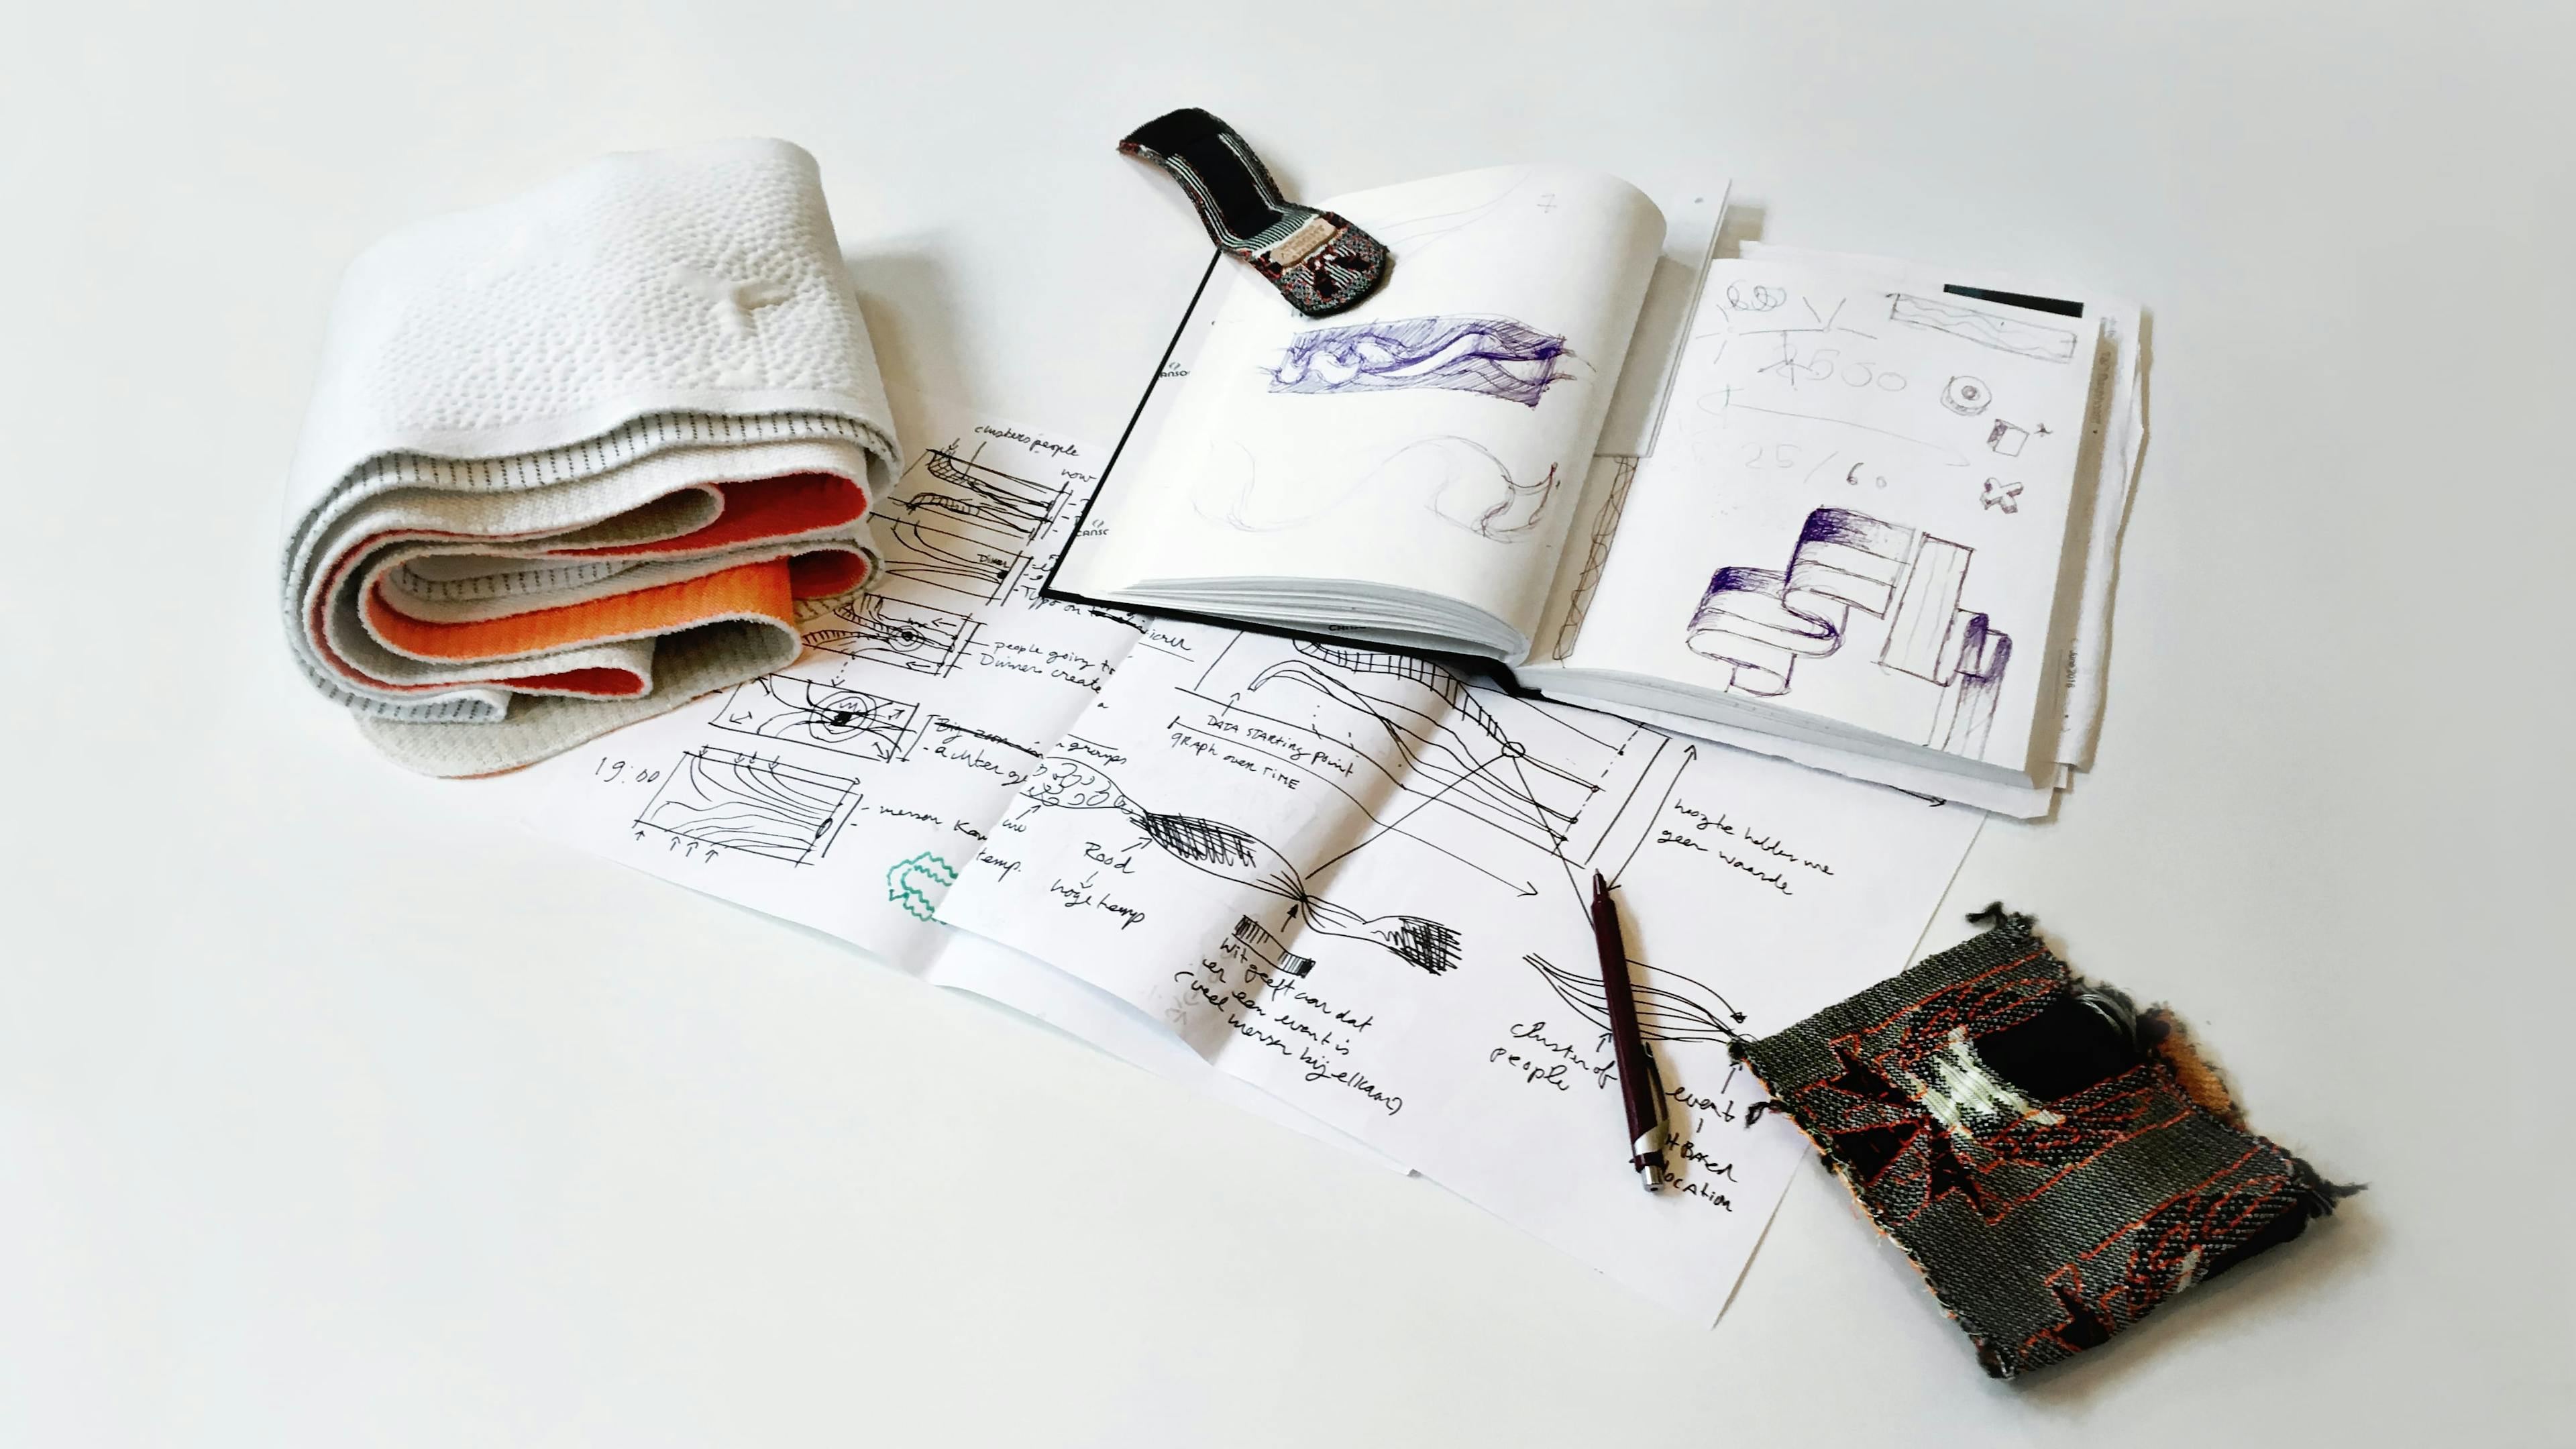
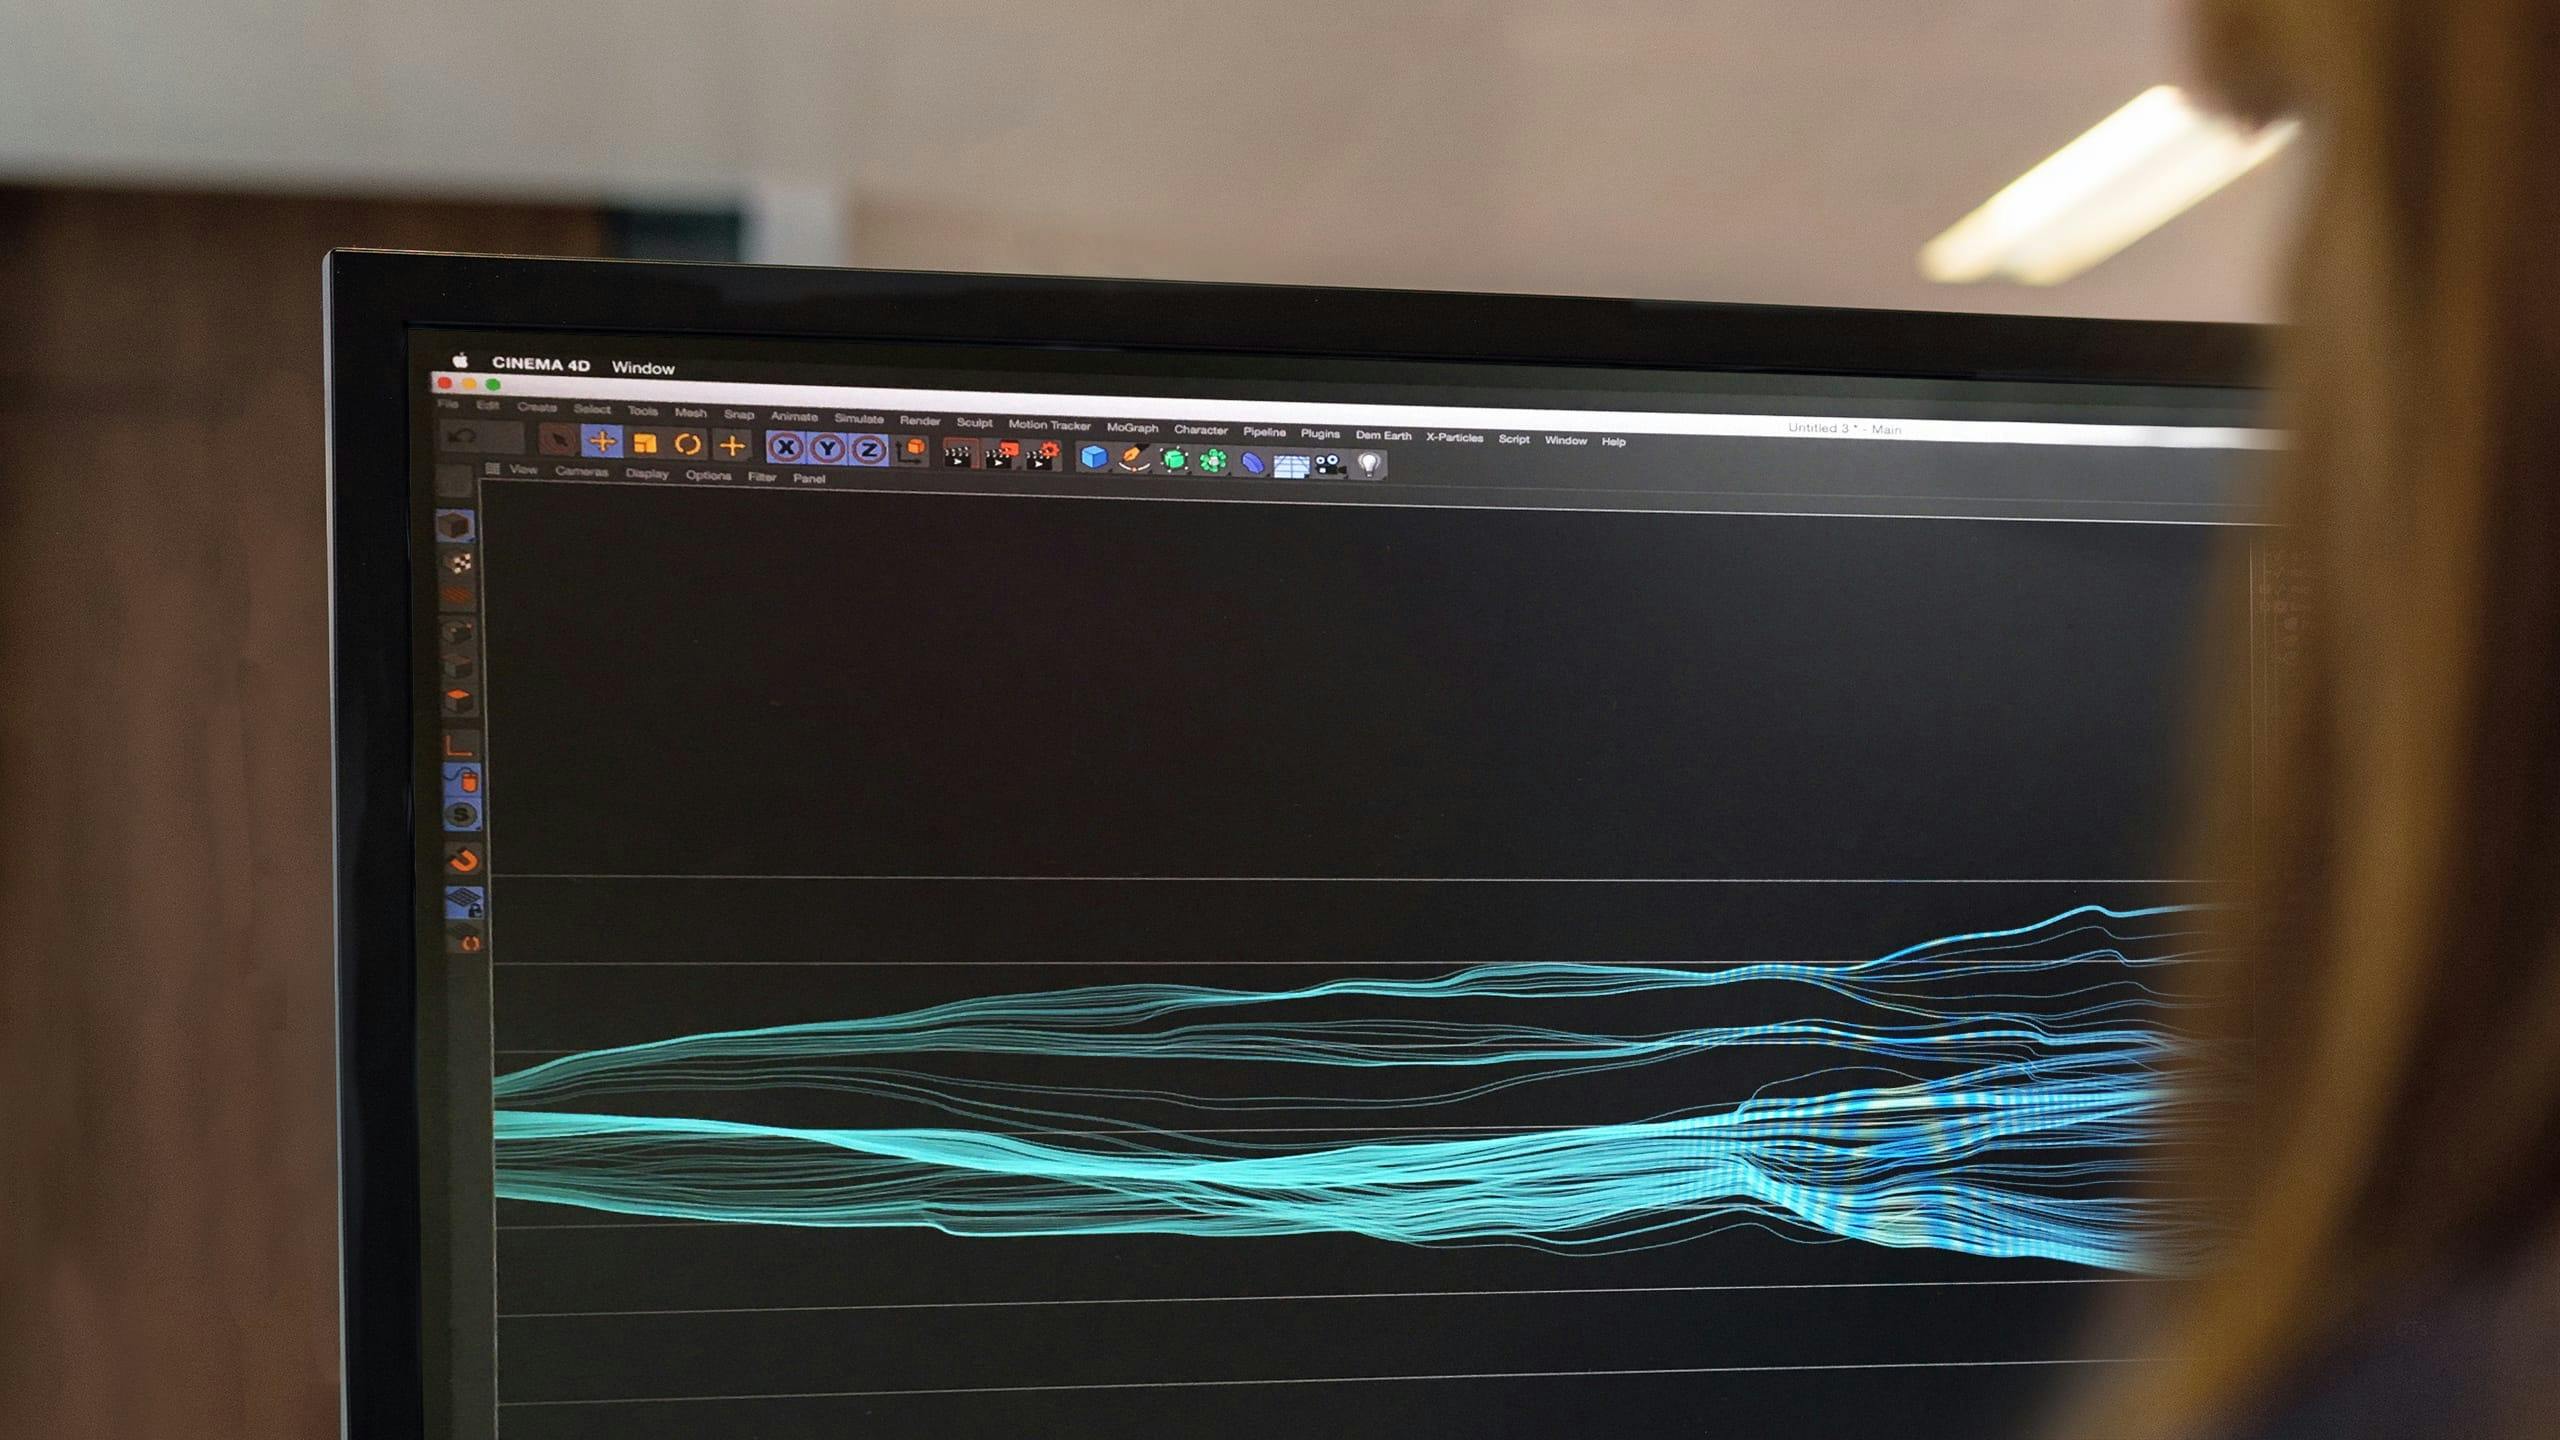
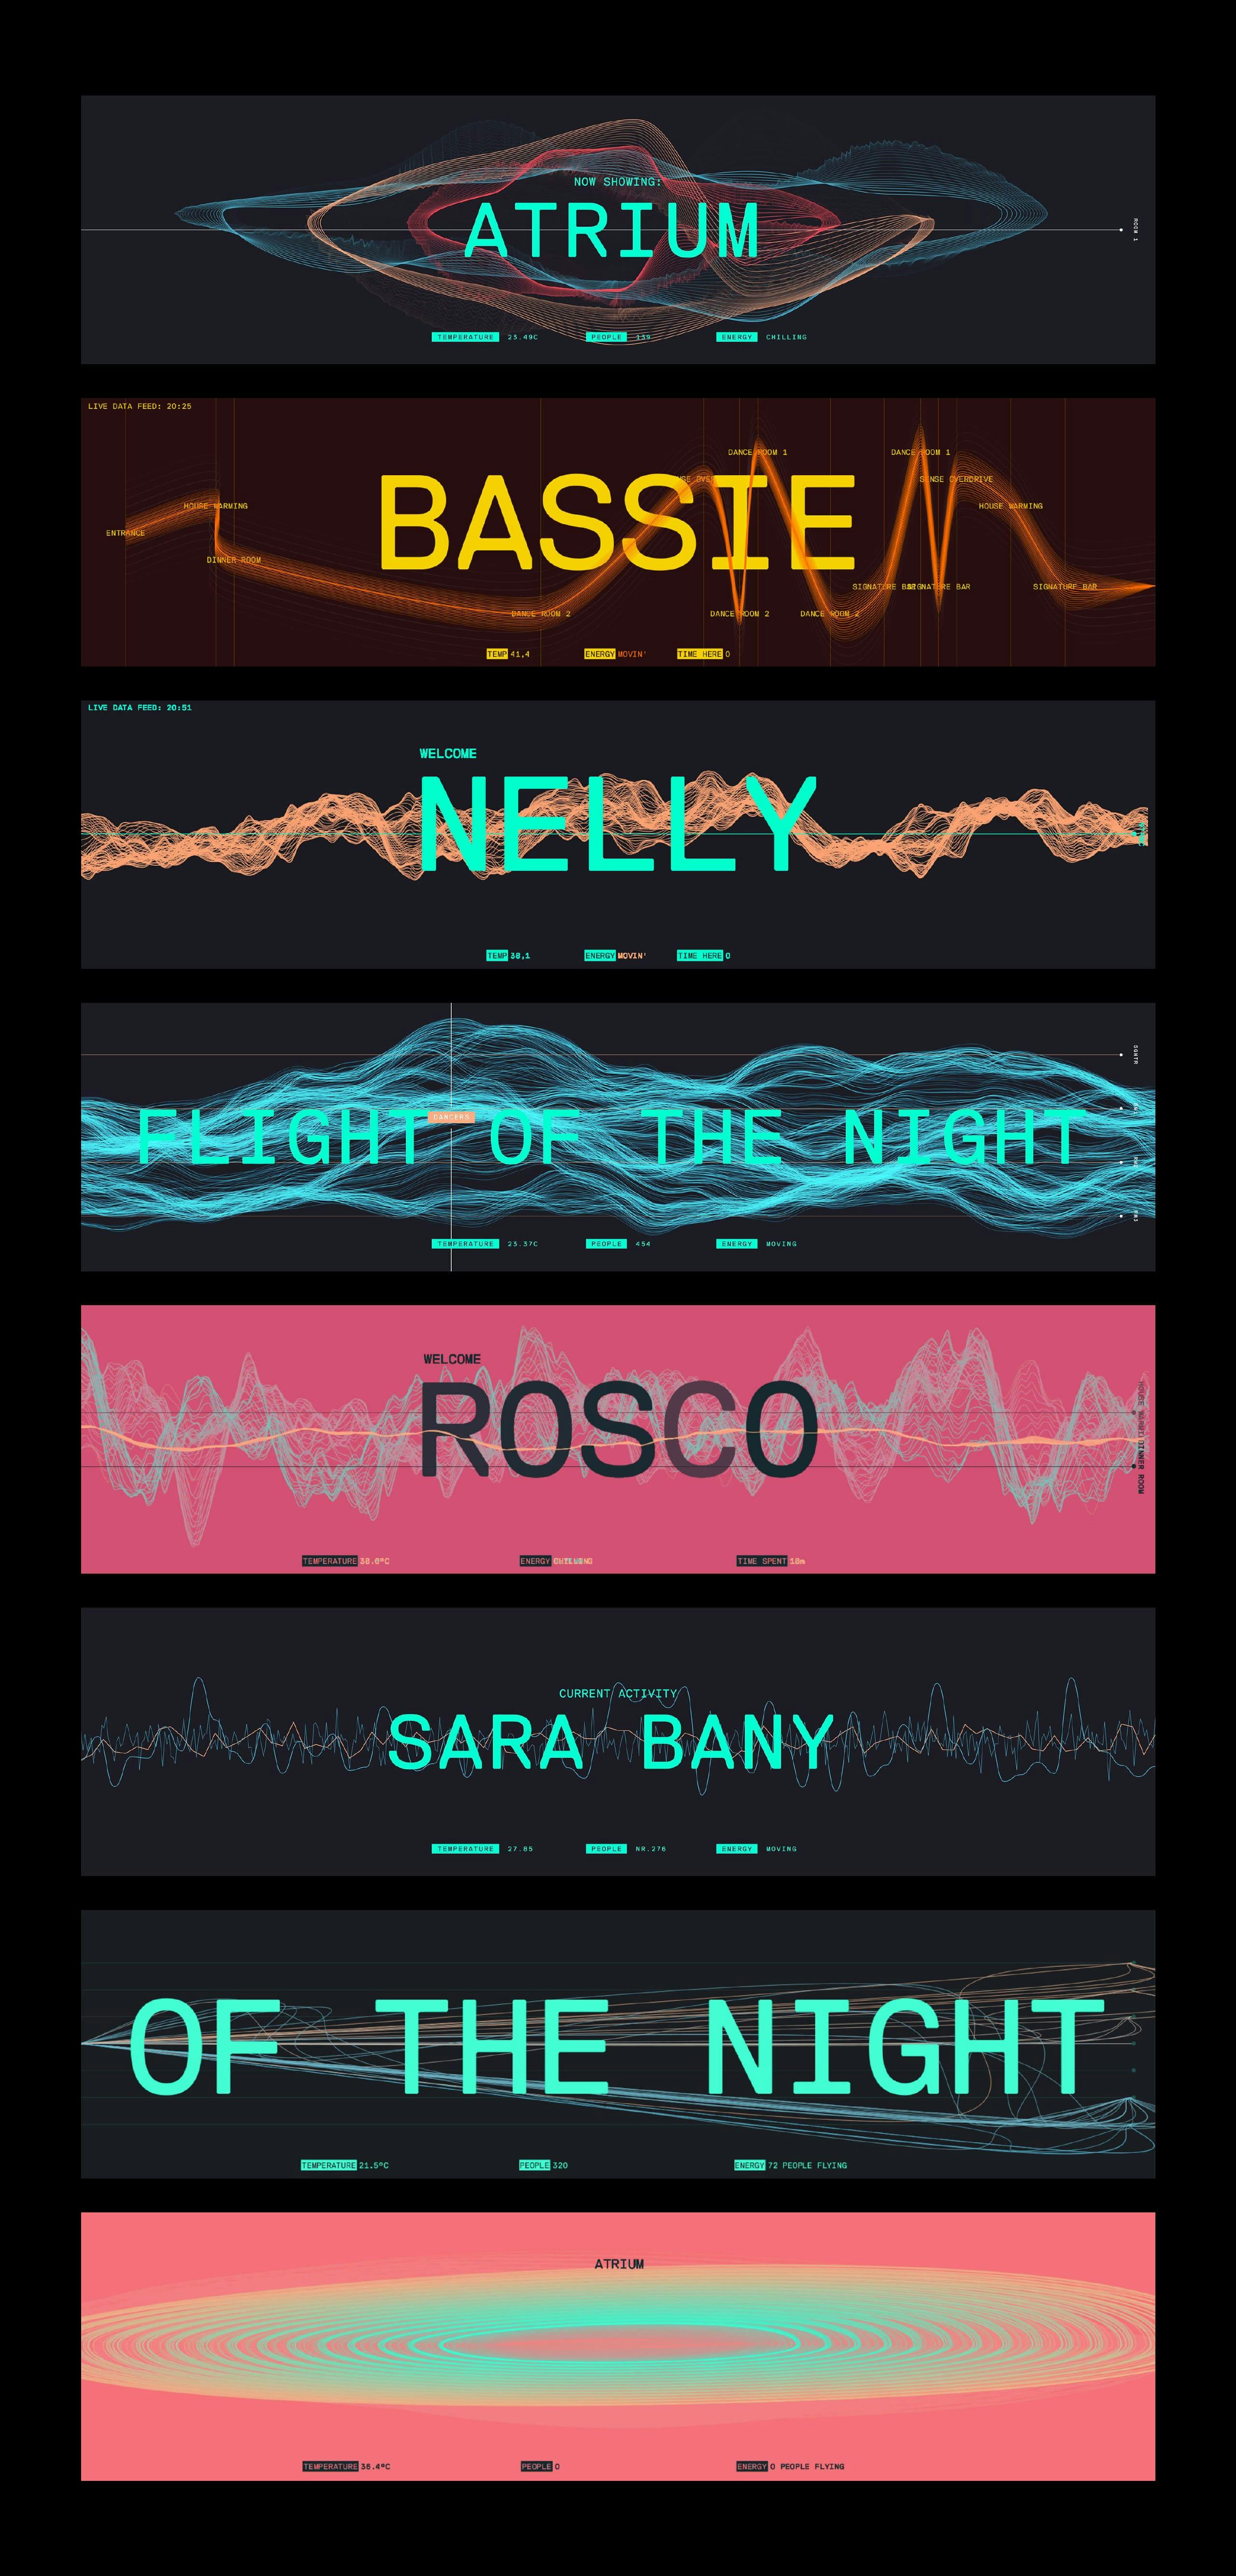
Drawing inspiration from audio waveforms and the filaments of knitted and woven fabric, we took the patterns of both as a point of departure for our designs. The lines move to represent the motions of the visitors, or an activity in a room.
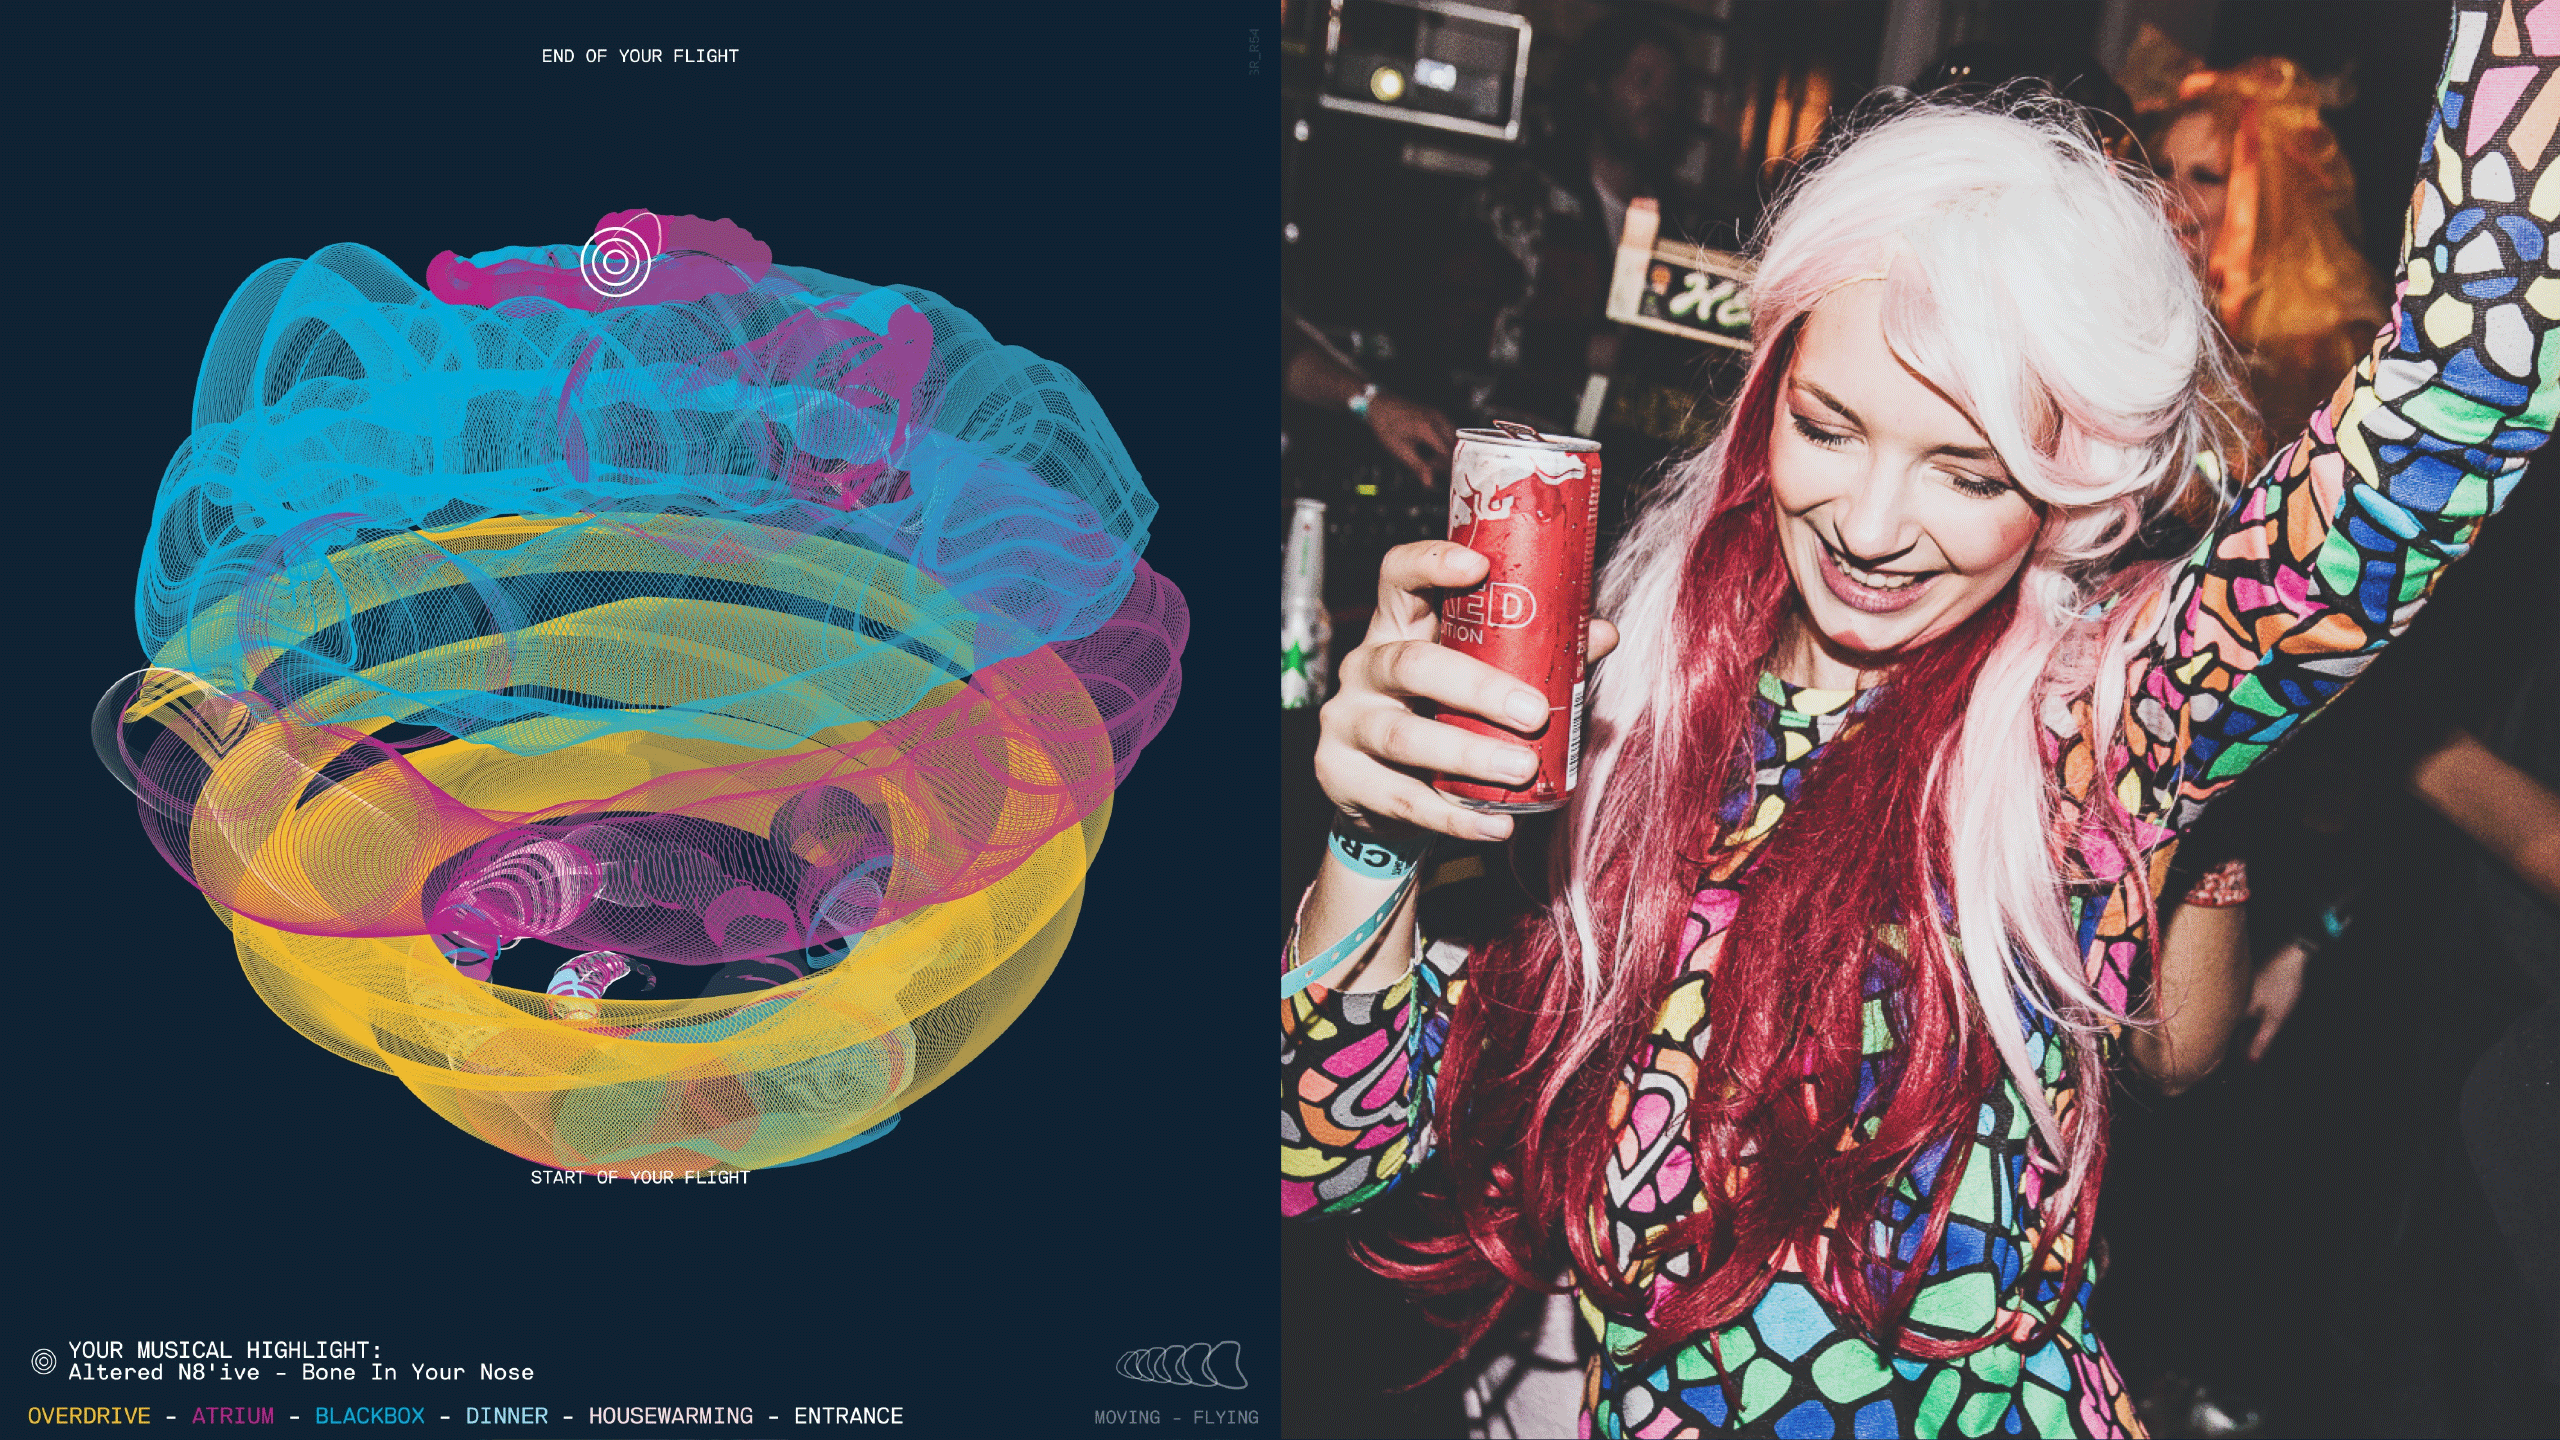
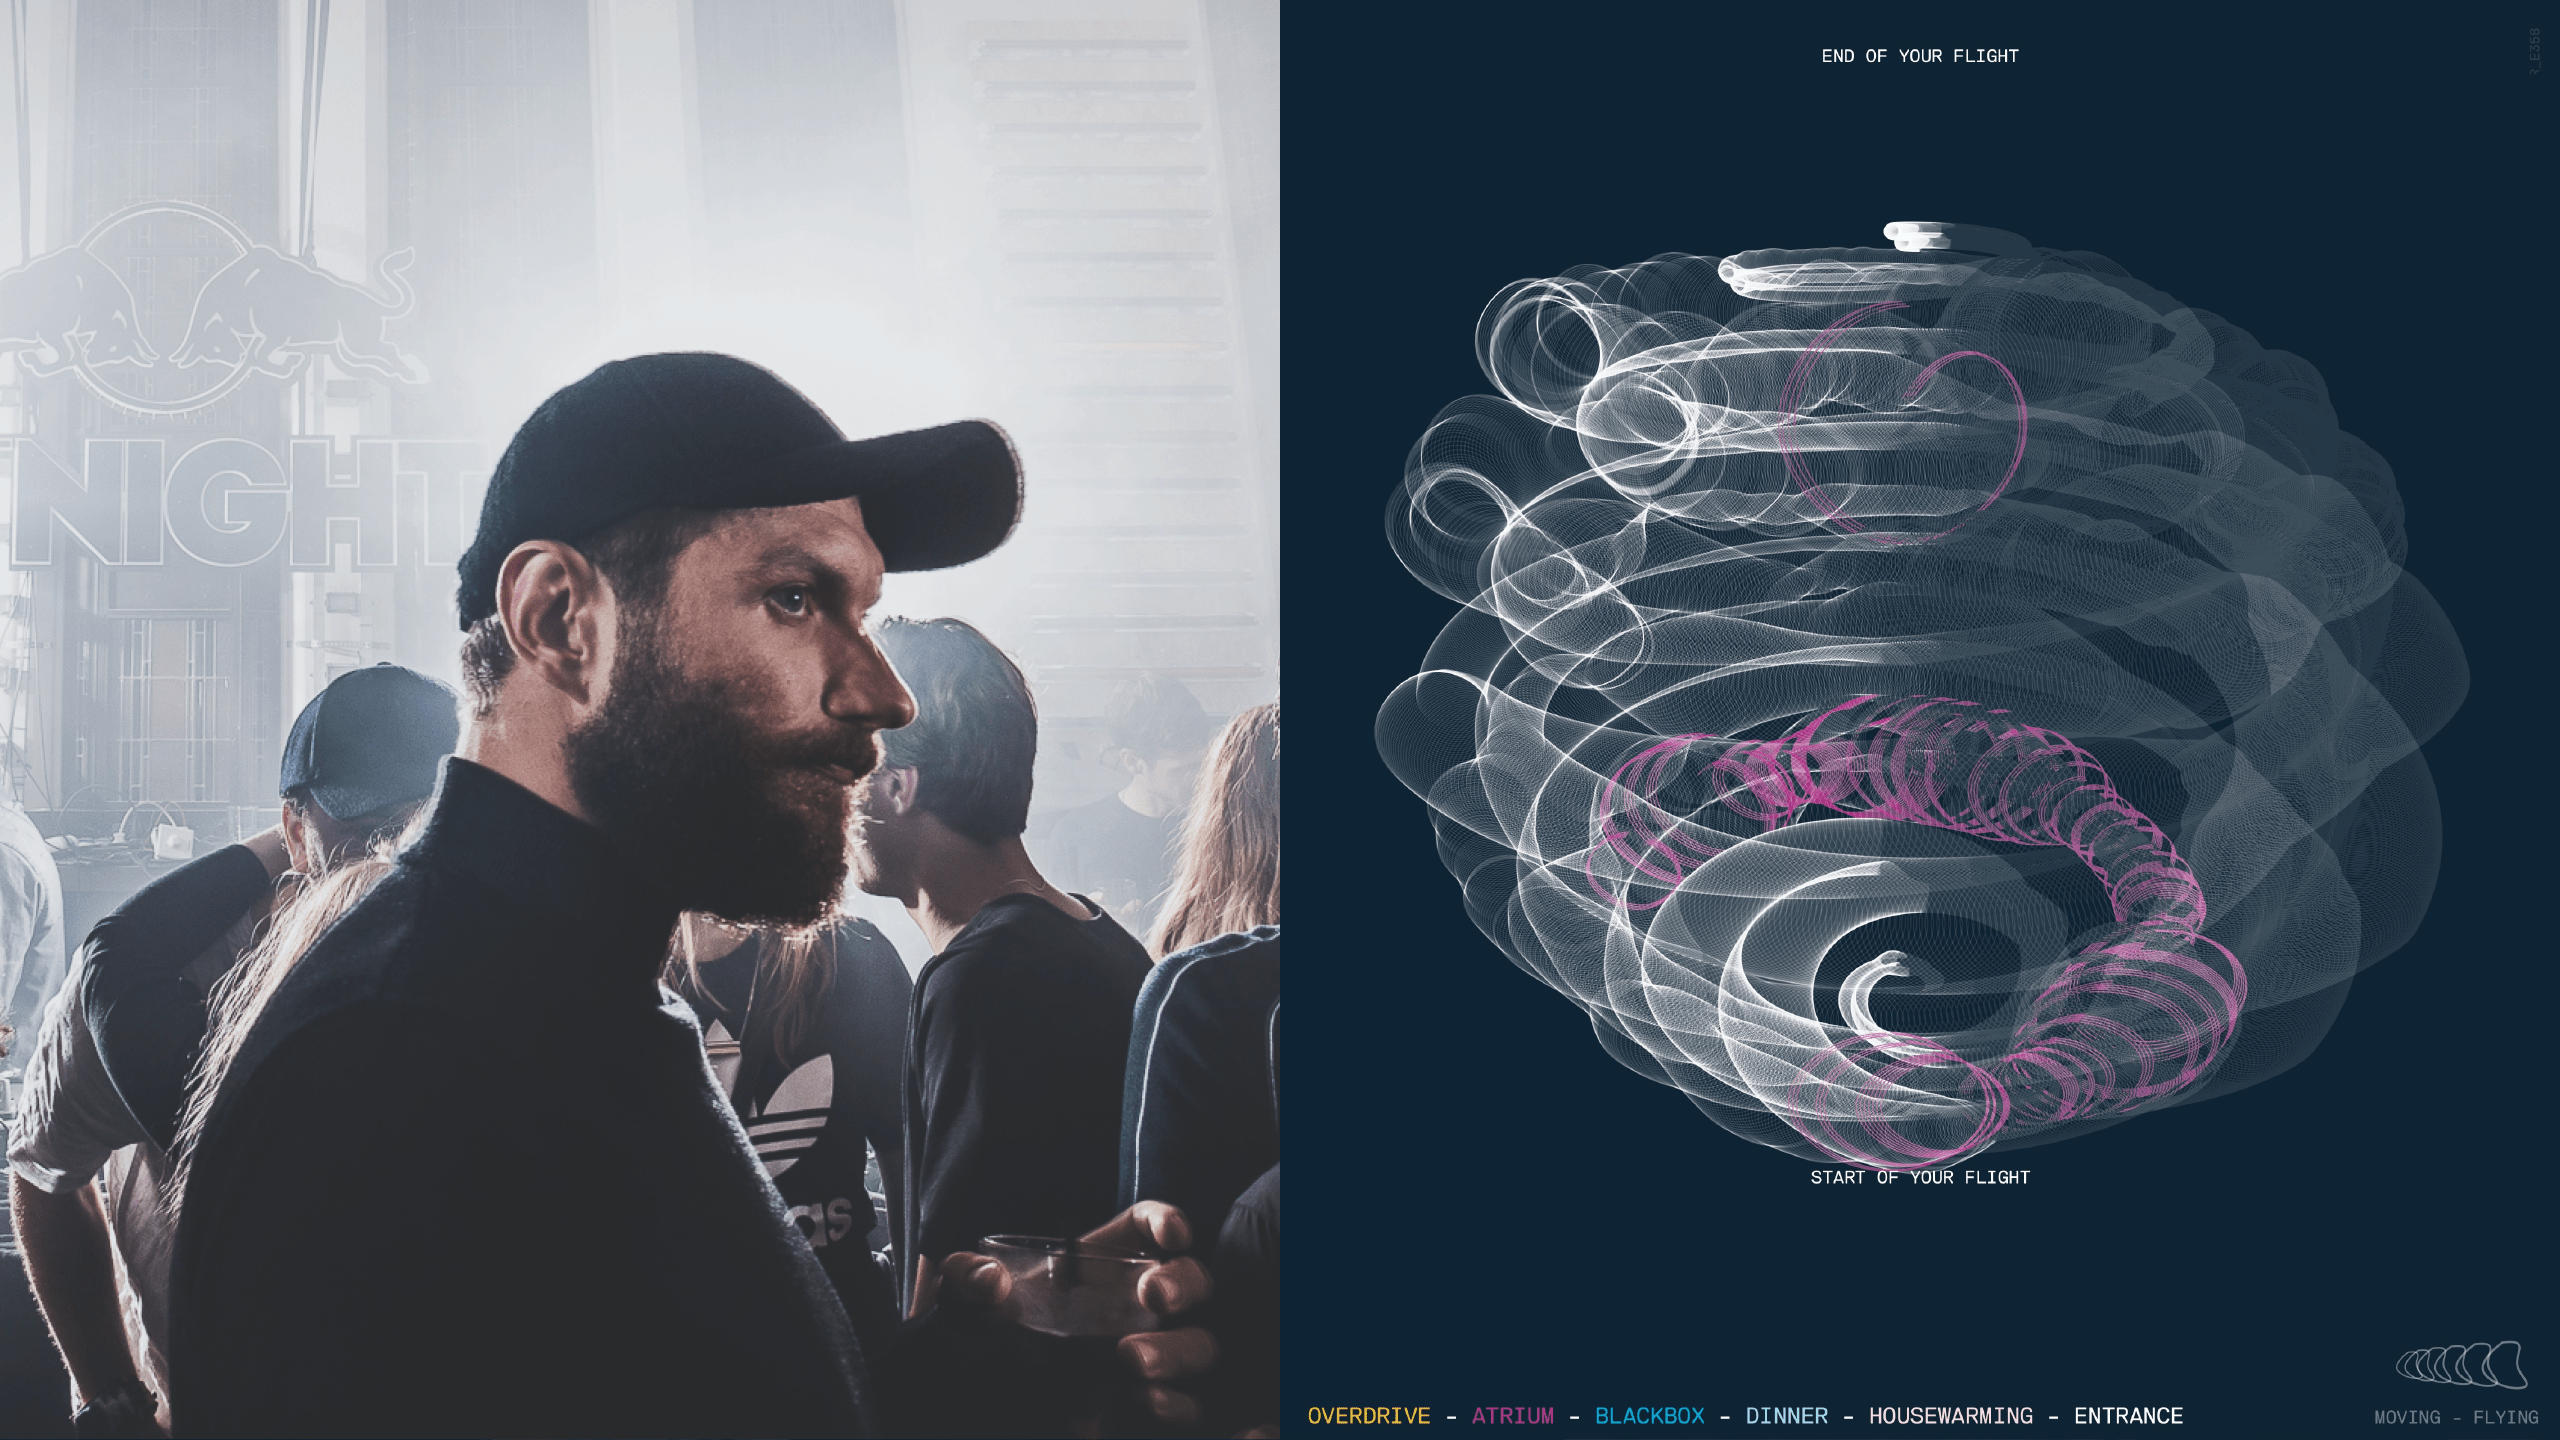
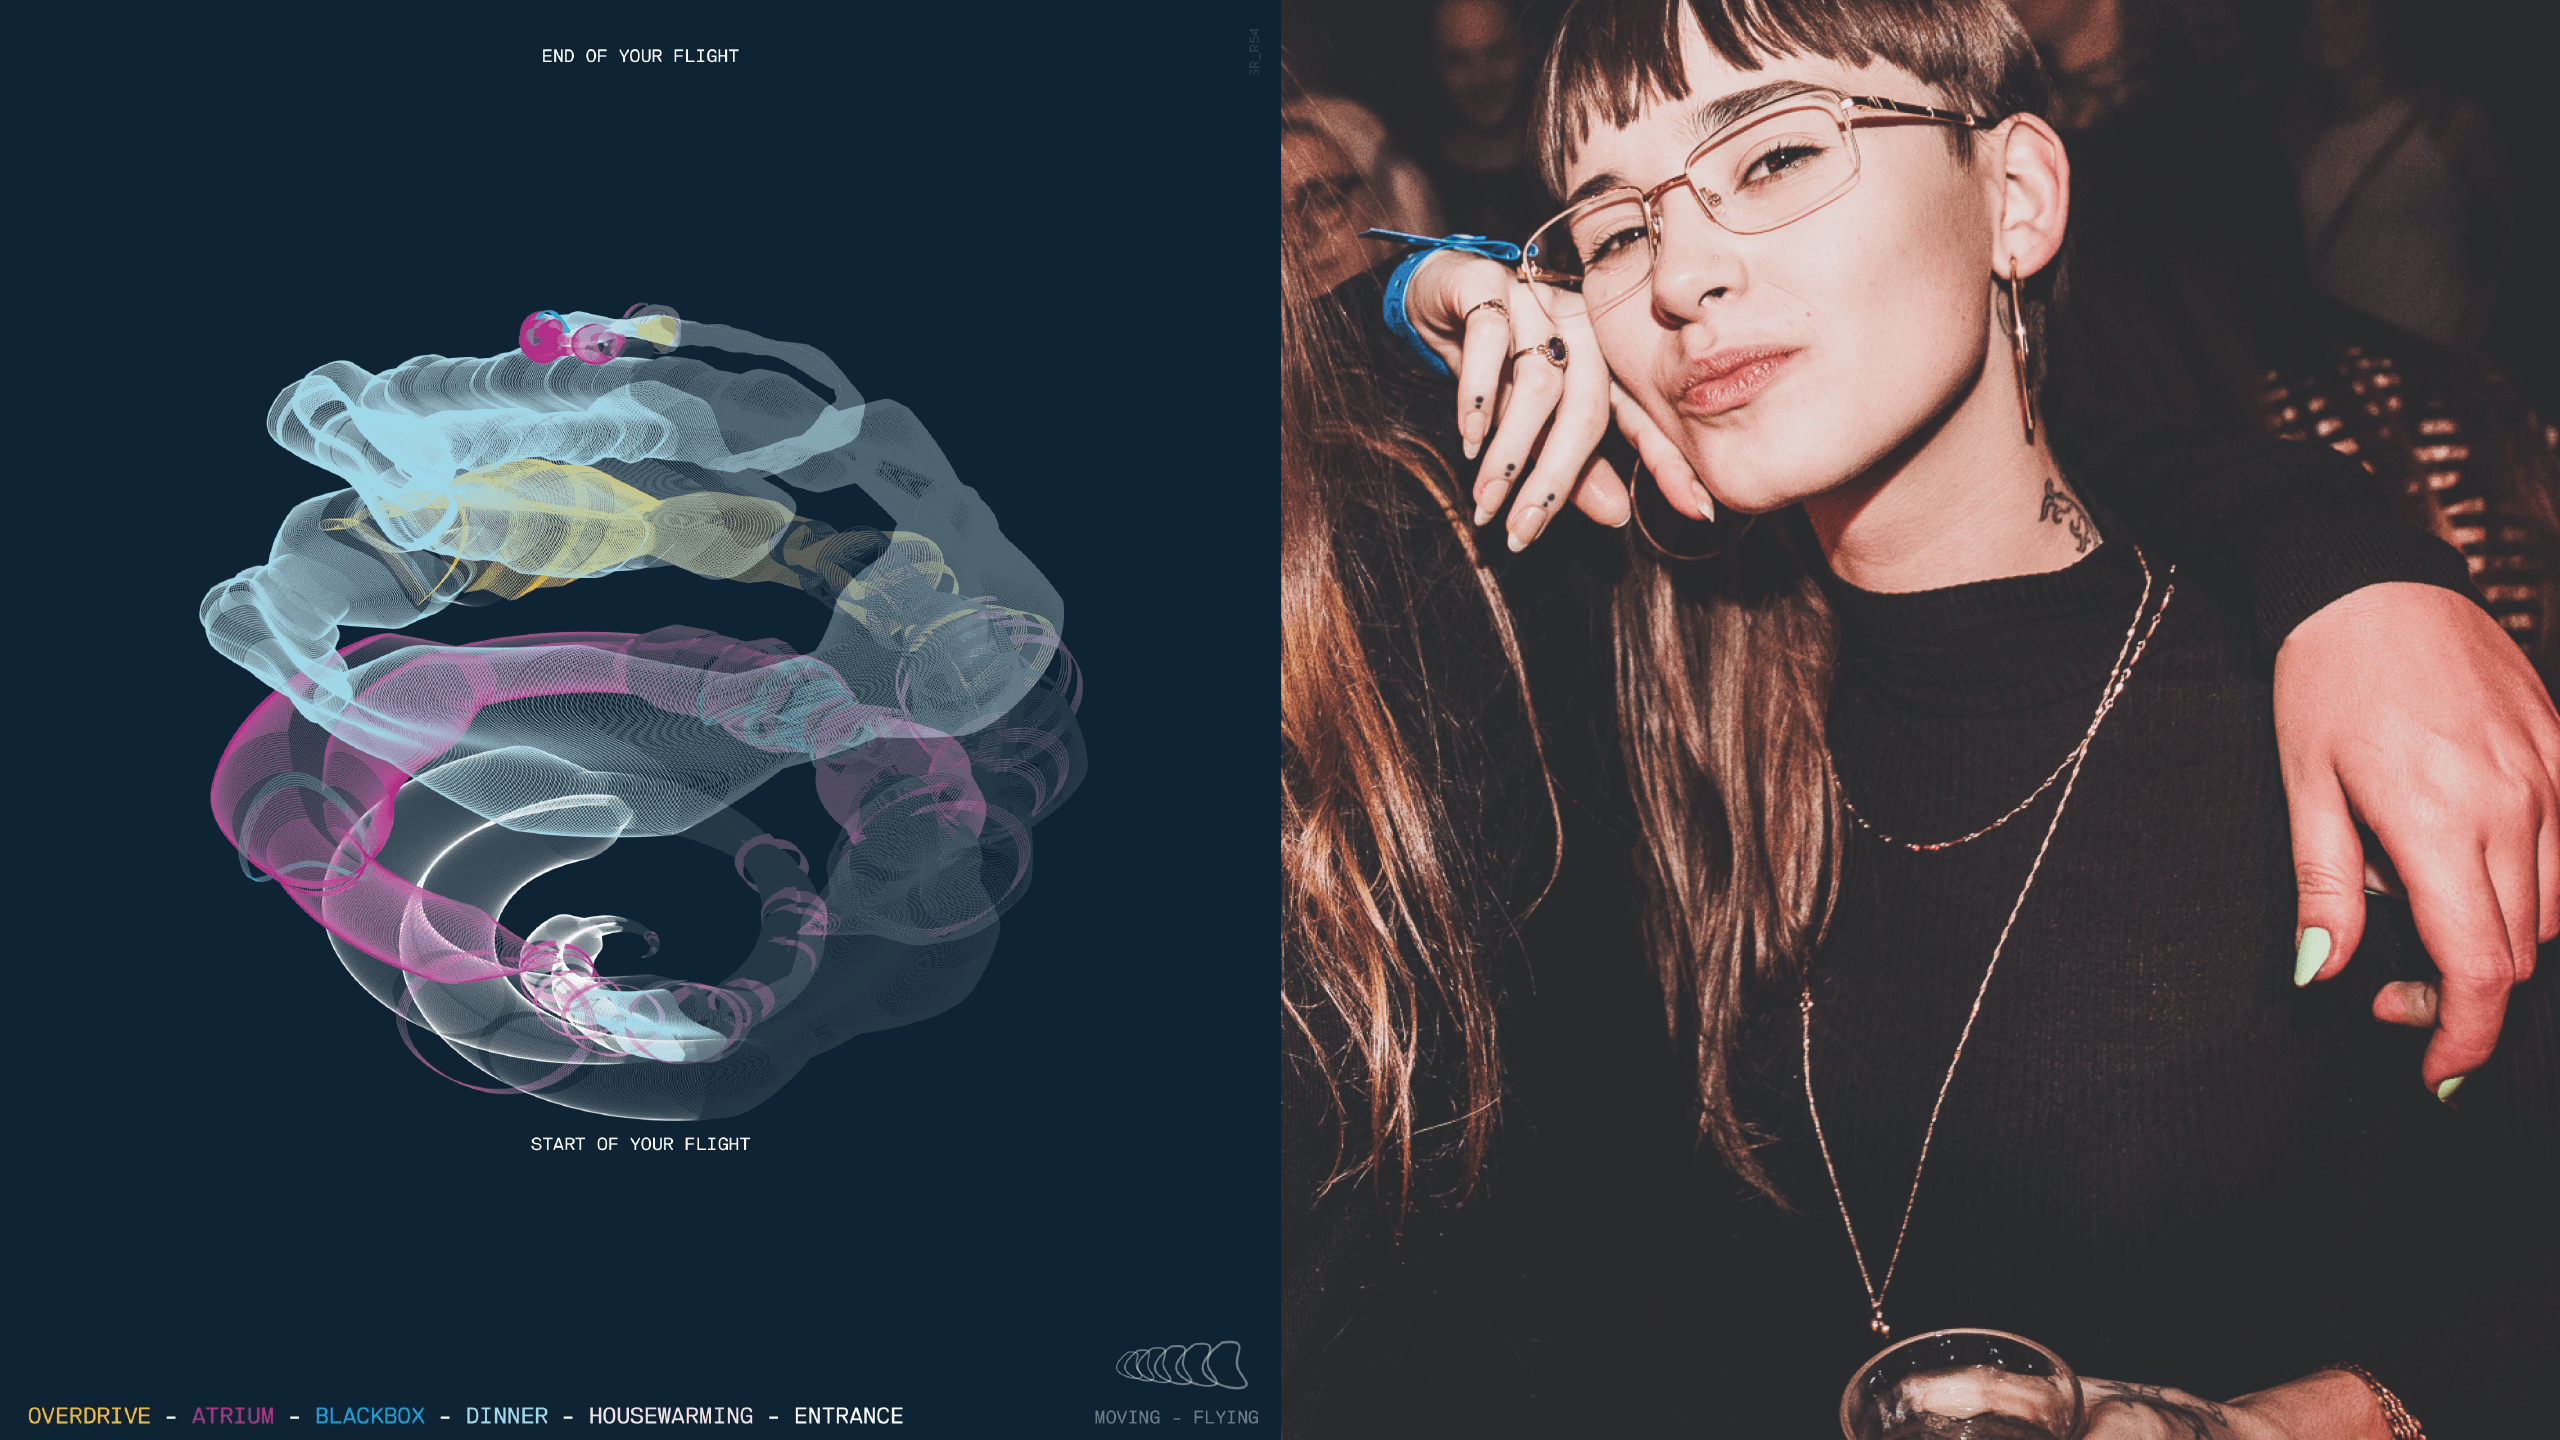
Every visualization uses different rules for representing the data. When welcoming a visitor we highlight their name, and use color and motion to show their current activity level. When showing an overall ‘flight of the night’, lines indicate people's location and room crowding.
The spherical post-event visual assigns colors to locations and creates more expressive shapes based on activity. This allows people to re-live their night and recognize how they experienced the event.
Statistics
Livevisualizations
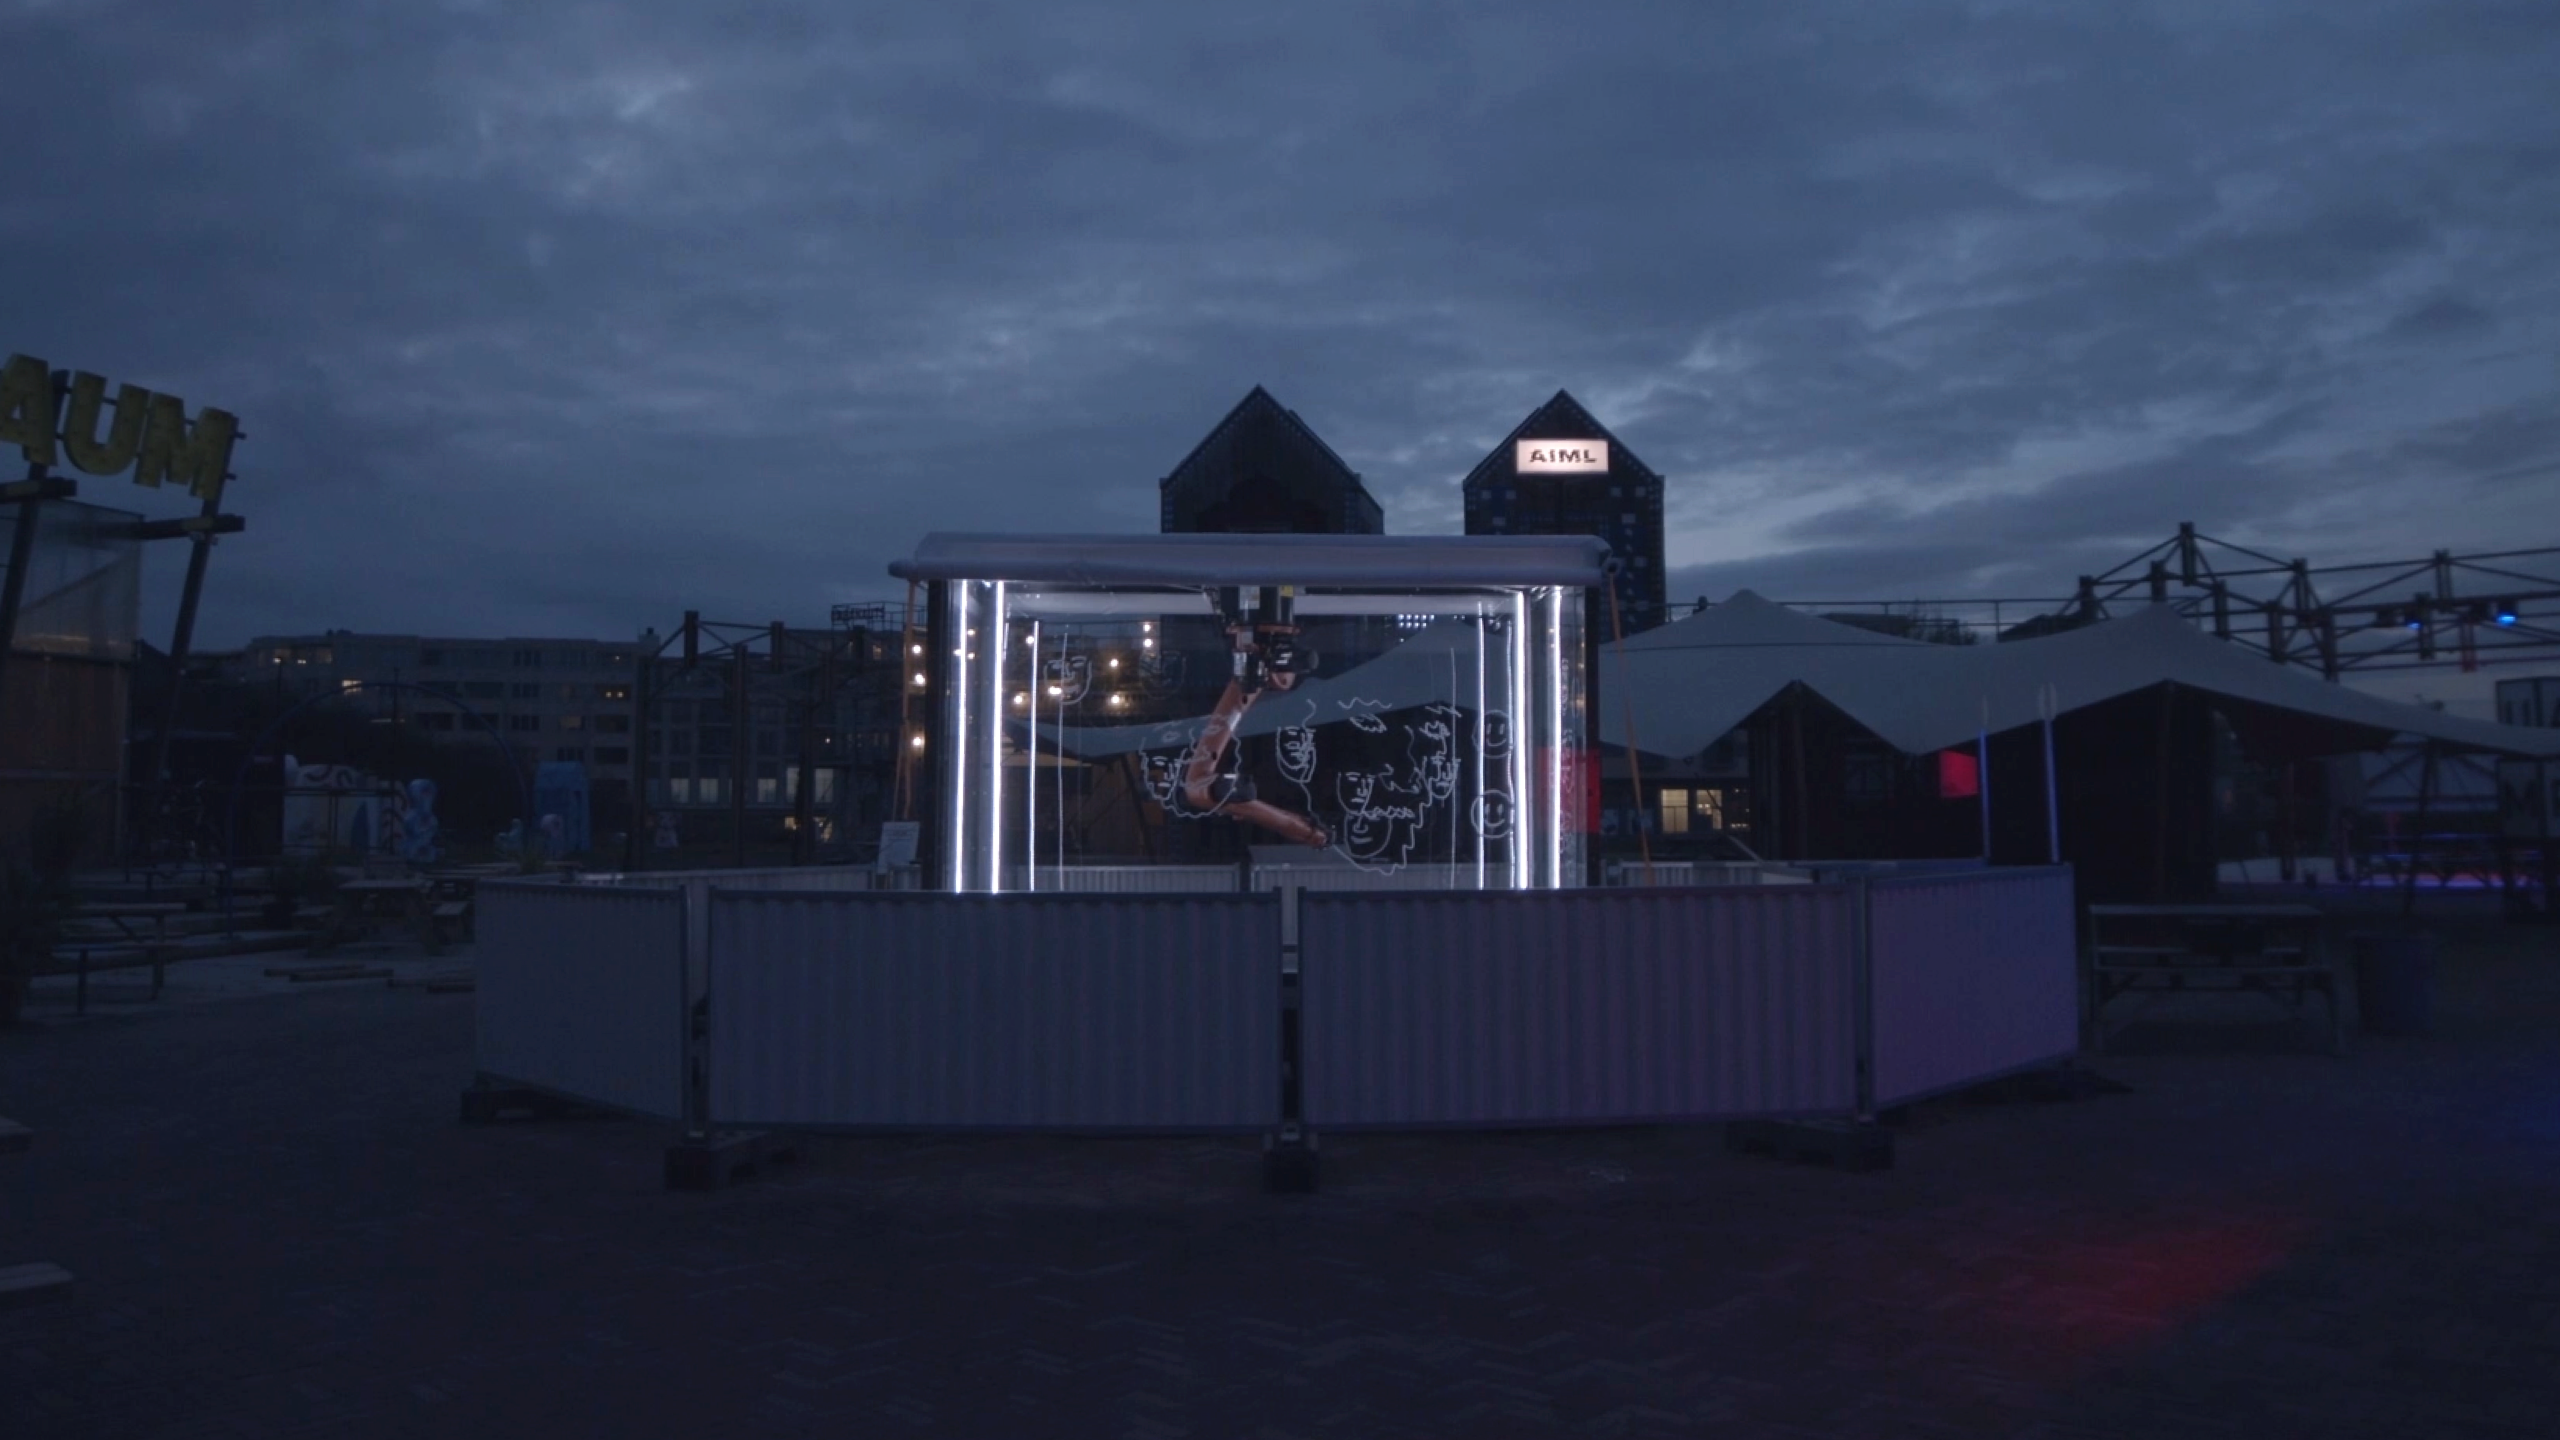
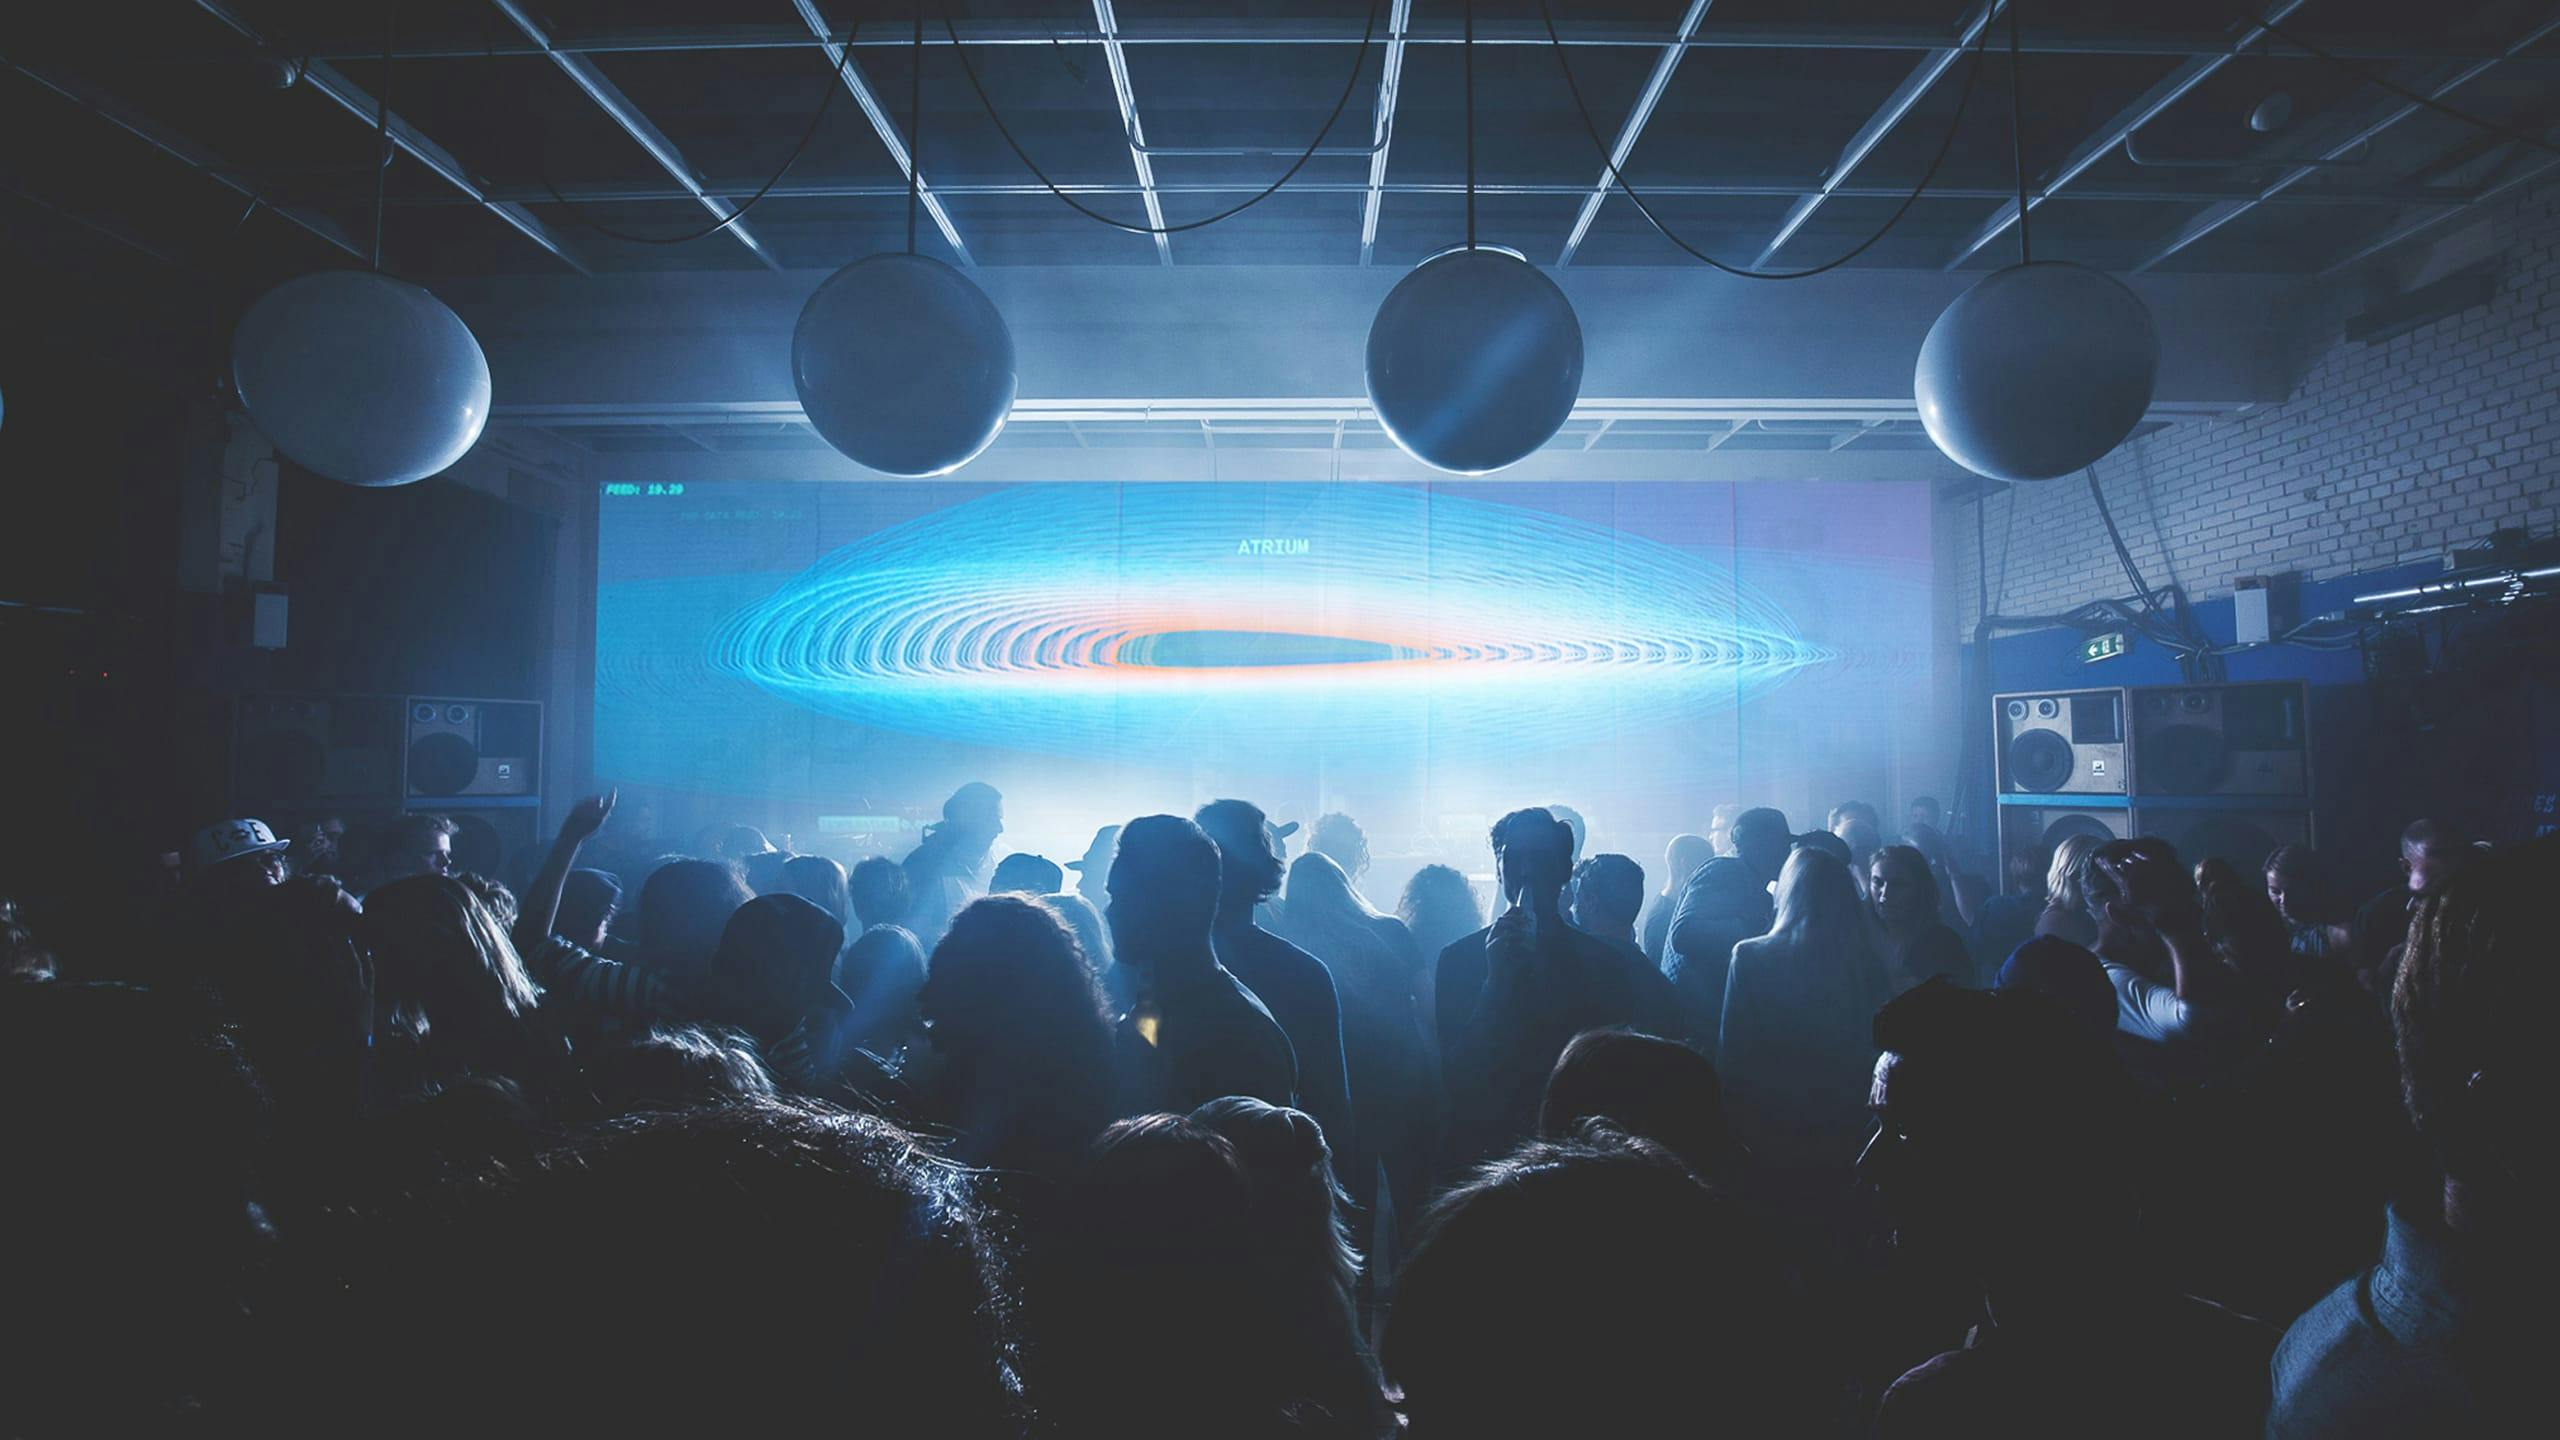
Sensor data gathered from guests’ bracelets was processed in real-time, generating the visualizations and projecting these on the main stage during the event. We created a series of designs that visualized the sensor data in different ways.
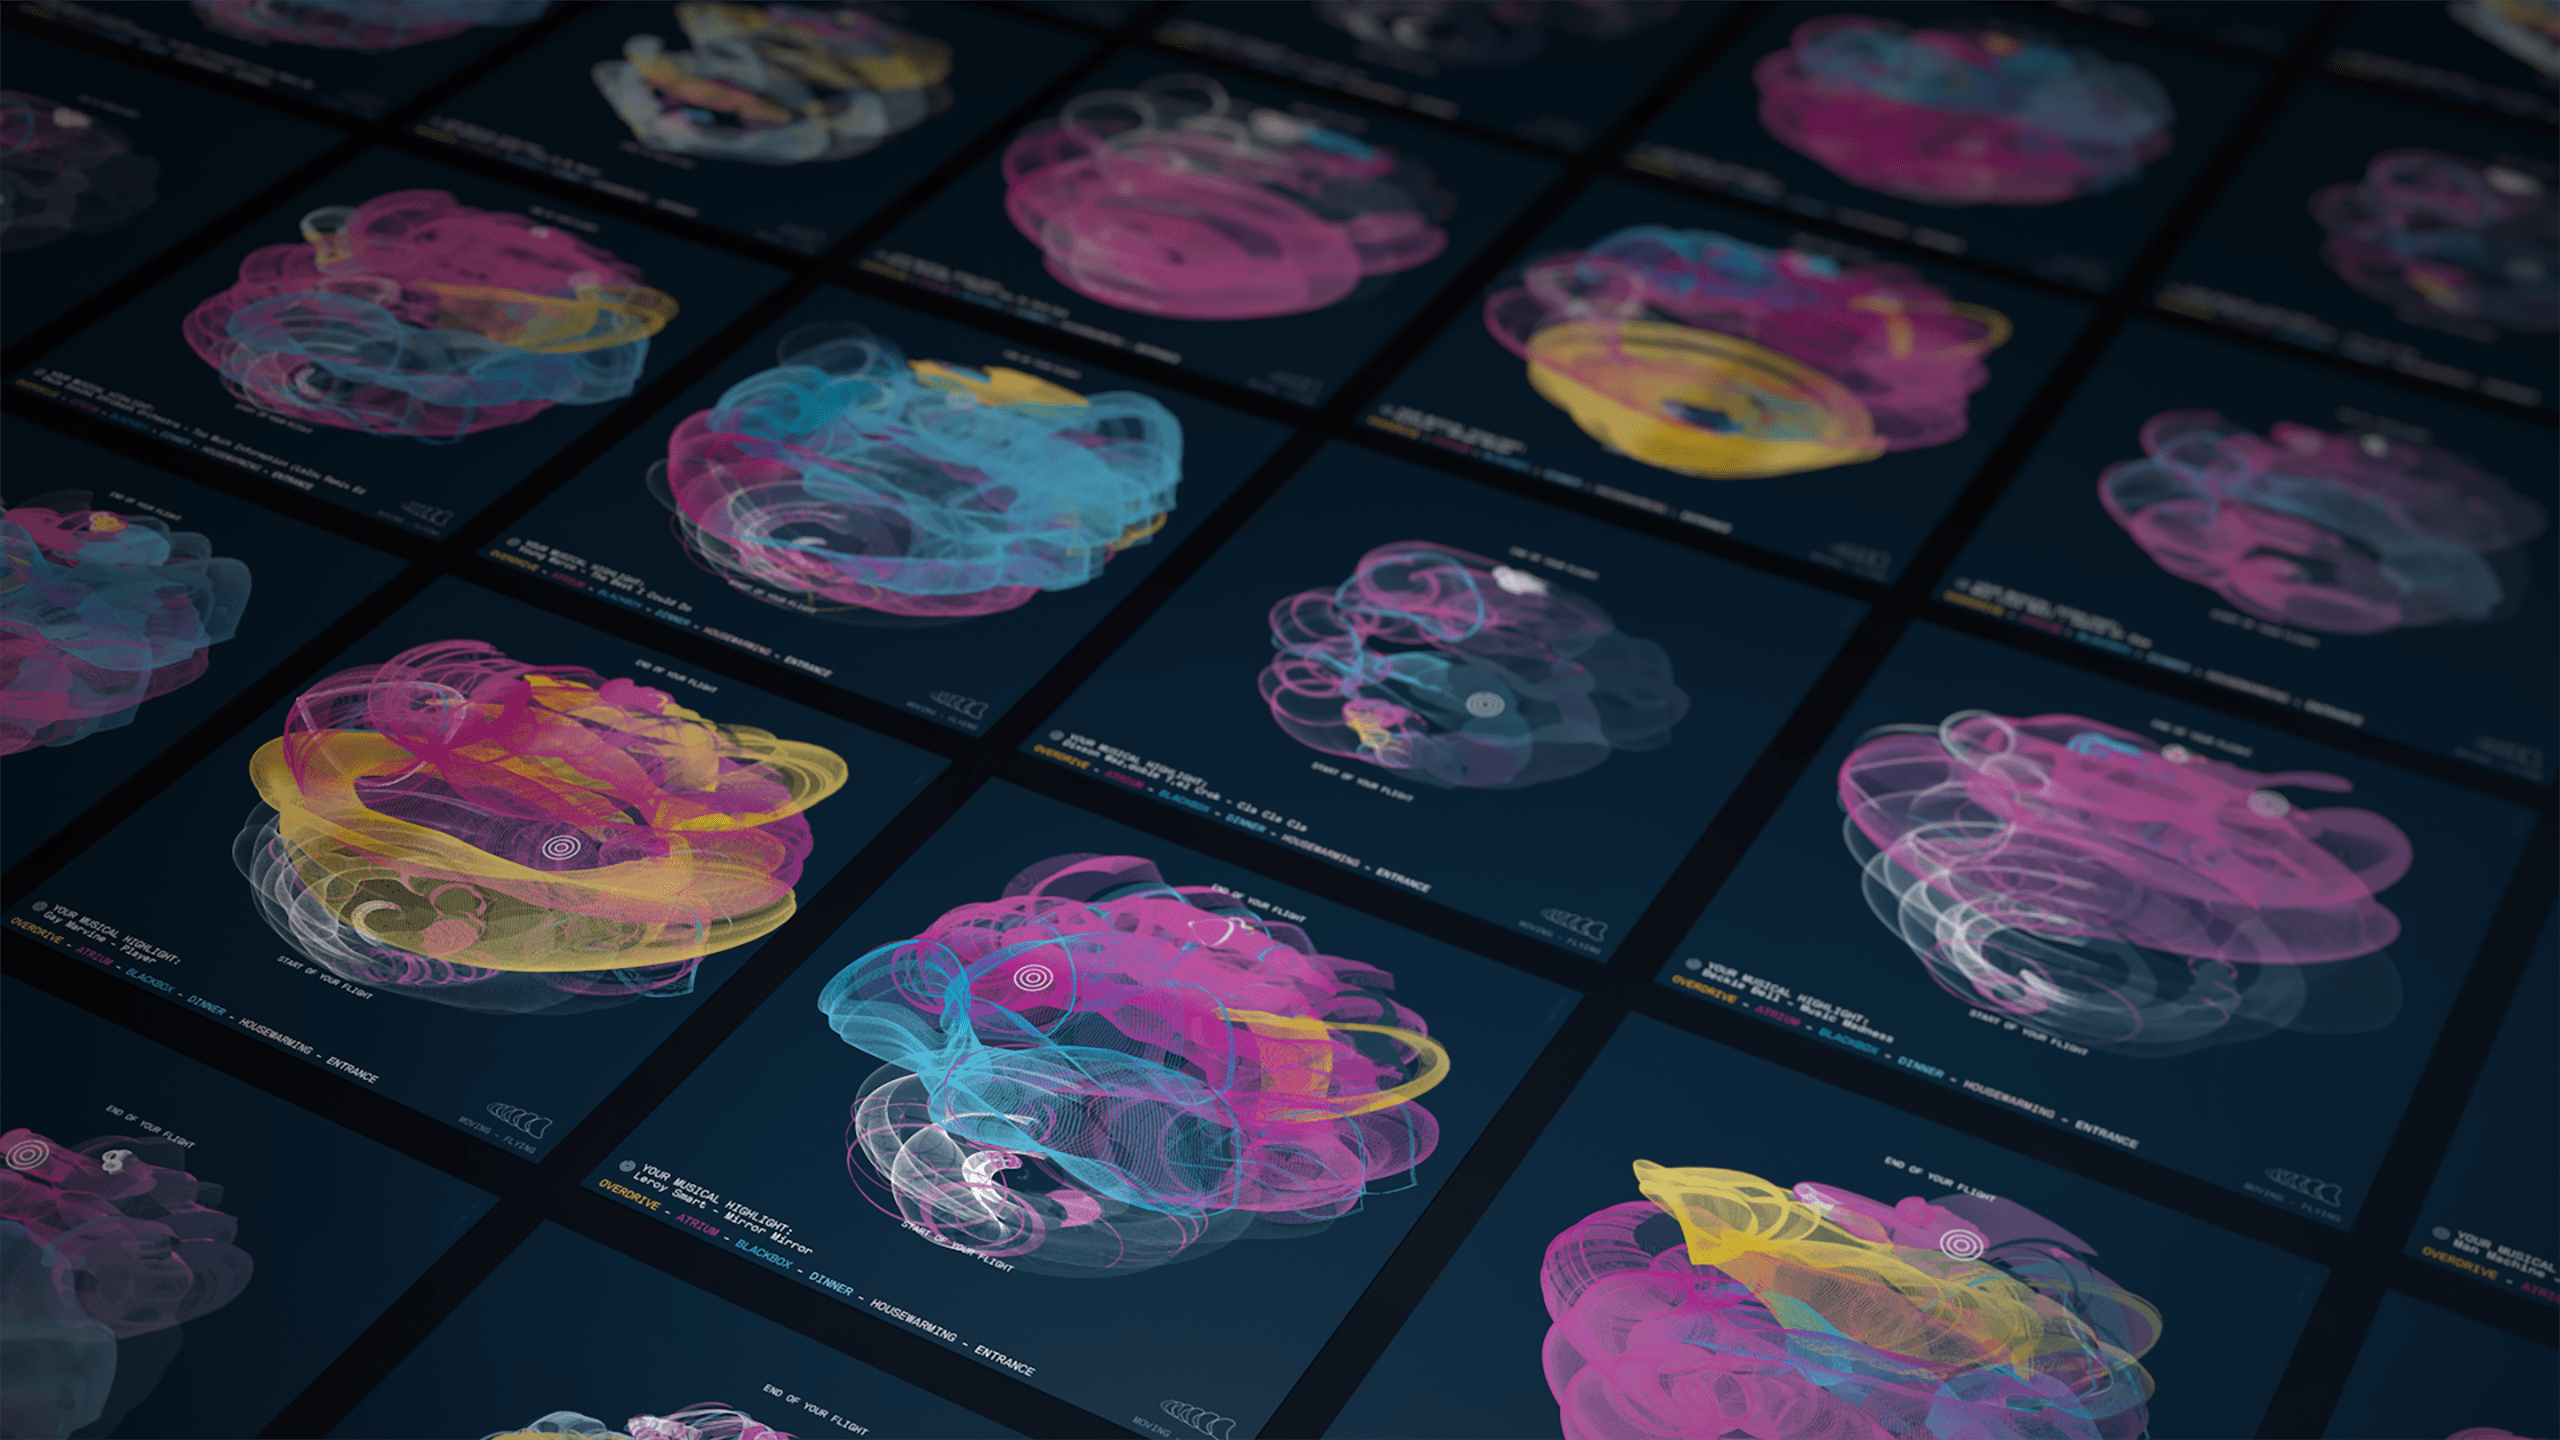
Visualizations for rooms and people reflected the current mood and activity. As the night progressed, a generative piece of art was created by showing either individuals or the collective's ‘flight of the night’.
Personalizeddatavisualizations
Each guest received a unique, personalized souvenir: a print of their individual visualization based on their ‘flight of the night’. A unique piece of art fusing CLEVER°FRANKE’s data visualization and the vision of BYBORRE. They also received a scarf with the ‘flight of the night’ as a knitted pattern.
Since all music was monitored, we identified every visitor's favorite tracks based on how actively they were dancing. A few days after the event people received an email with their favorite tracks.
Technology
Hardwaresetupandsensors
By combining hardware with data analysis, we were able to develop a platform that was able to capture, process and visualize an individual’s data in real-time.
Java combined with the Processing creative coding library was used to retrieve and analyze the data to create the visuals during the live event and subsequently the print/web/scarf visualizations for the post-event gifts. This combination allows us to quickly iterate towards compelling visualizations whilst providing stability and reliability during development and performance.
We used Cinema4D and After Effects early in the project. Based on the first sample data, we also created a fallback video just in case the visualizations were to malfunction.
Each of the bracelets is integrated with a motion, temperature and sound sensor from which a network of receivers gathered the guest’s individual data to generate the visualizations.
Results
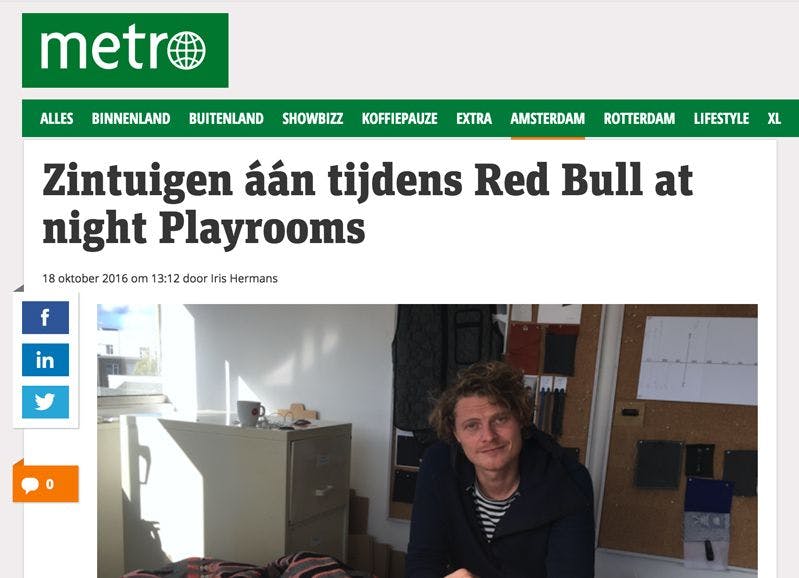
Working with CLEVER°FRANKE made it possible to realize one of the most important questions of our project… showing what we did with the data collected and giving it back in such a way that all visitors can enjoy it as generative work of art. […] Raw data became personalized art. […] This, we could have never have done without the help of C°F. Working with them really opened my horizon for the future. Data is a beautiful thing, when you work with them!
Borre Akkersdijk
Founder & CEO, BYBORRE