Enabling researchers to track the performance of their article
- Client
- Elsevier
- Awards
- European Design Award – Silver
- Red Dot Design Award
- Deliverables
- Dashboard
The challenge
Elsevier is the world’s leading provider of scientific, technical, and medical information products and services.
Together with Elsevier, we introduced ‘My Research Dashboard’; a new product that enables academic writers to quickly and easily understand how their publications are being read, shared and cited across the world.
Marking the shift towards becoming a digital solutions provider, the dashboard is Elsevier’s flagship product and the link between their product portfolio: Scopus, ScienceDirect, Mendeley and Newsflo. Showcasing a broad overview of data from these sources, the dashboard delivers a rich, detailed picture of the global impact of a writer’s articles and publications.
Value delivered
A dynamic system that creates relevance for any researcher by using data. The system creates a personalized space for each user to understand different metrics and to show what the data means for them. This ultimately helped Elsevier transition from a publishing house to a digital service provider.
Background
Stakeholder workshops marked the starting point for constructive discussions and research into the purpose of the dashboard as part of a larger product suite. This led to the development of ideas around the actions that could be taken after an article was published.
Phases and toolkit items used
Design
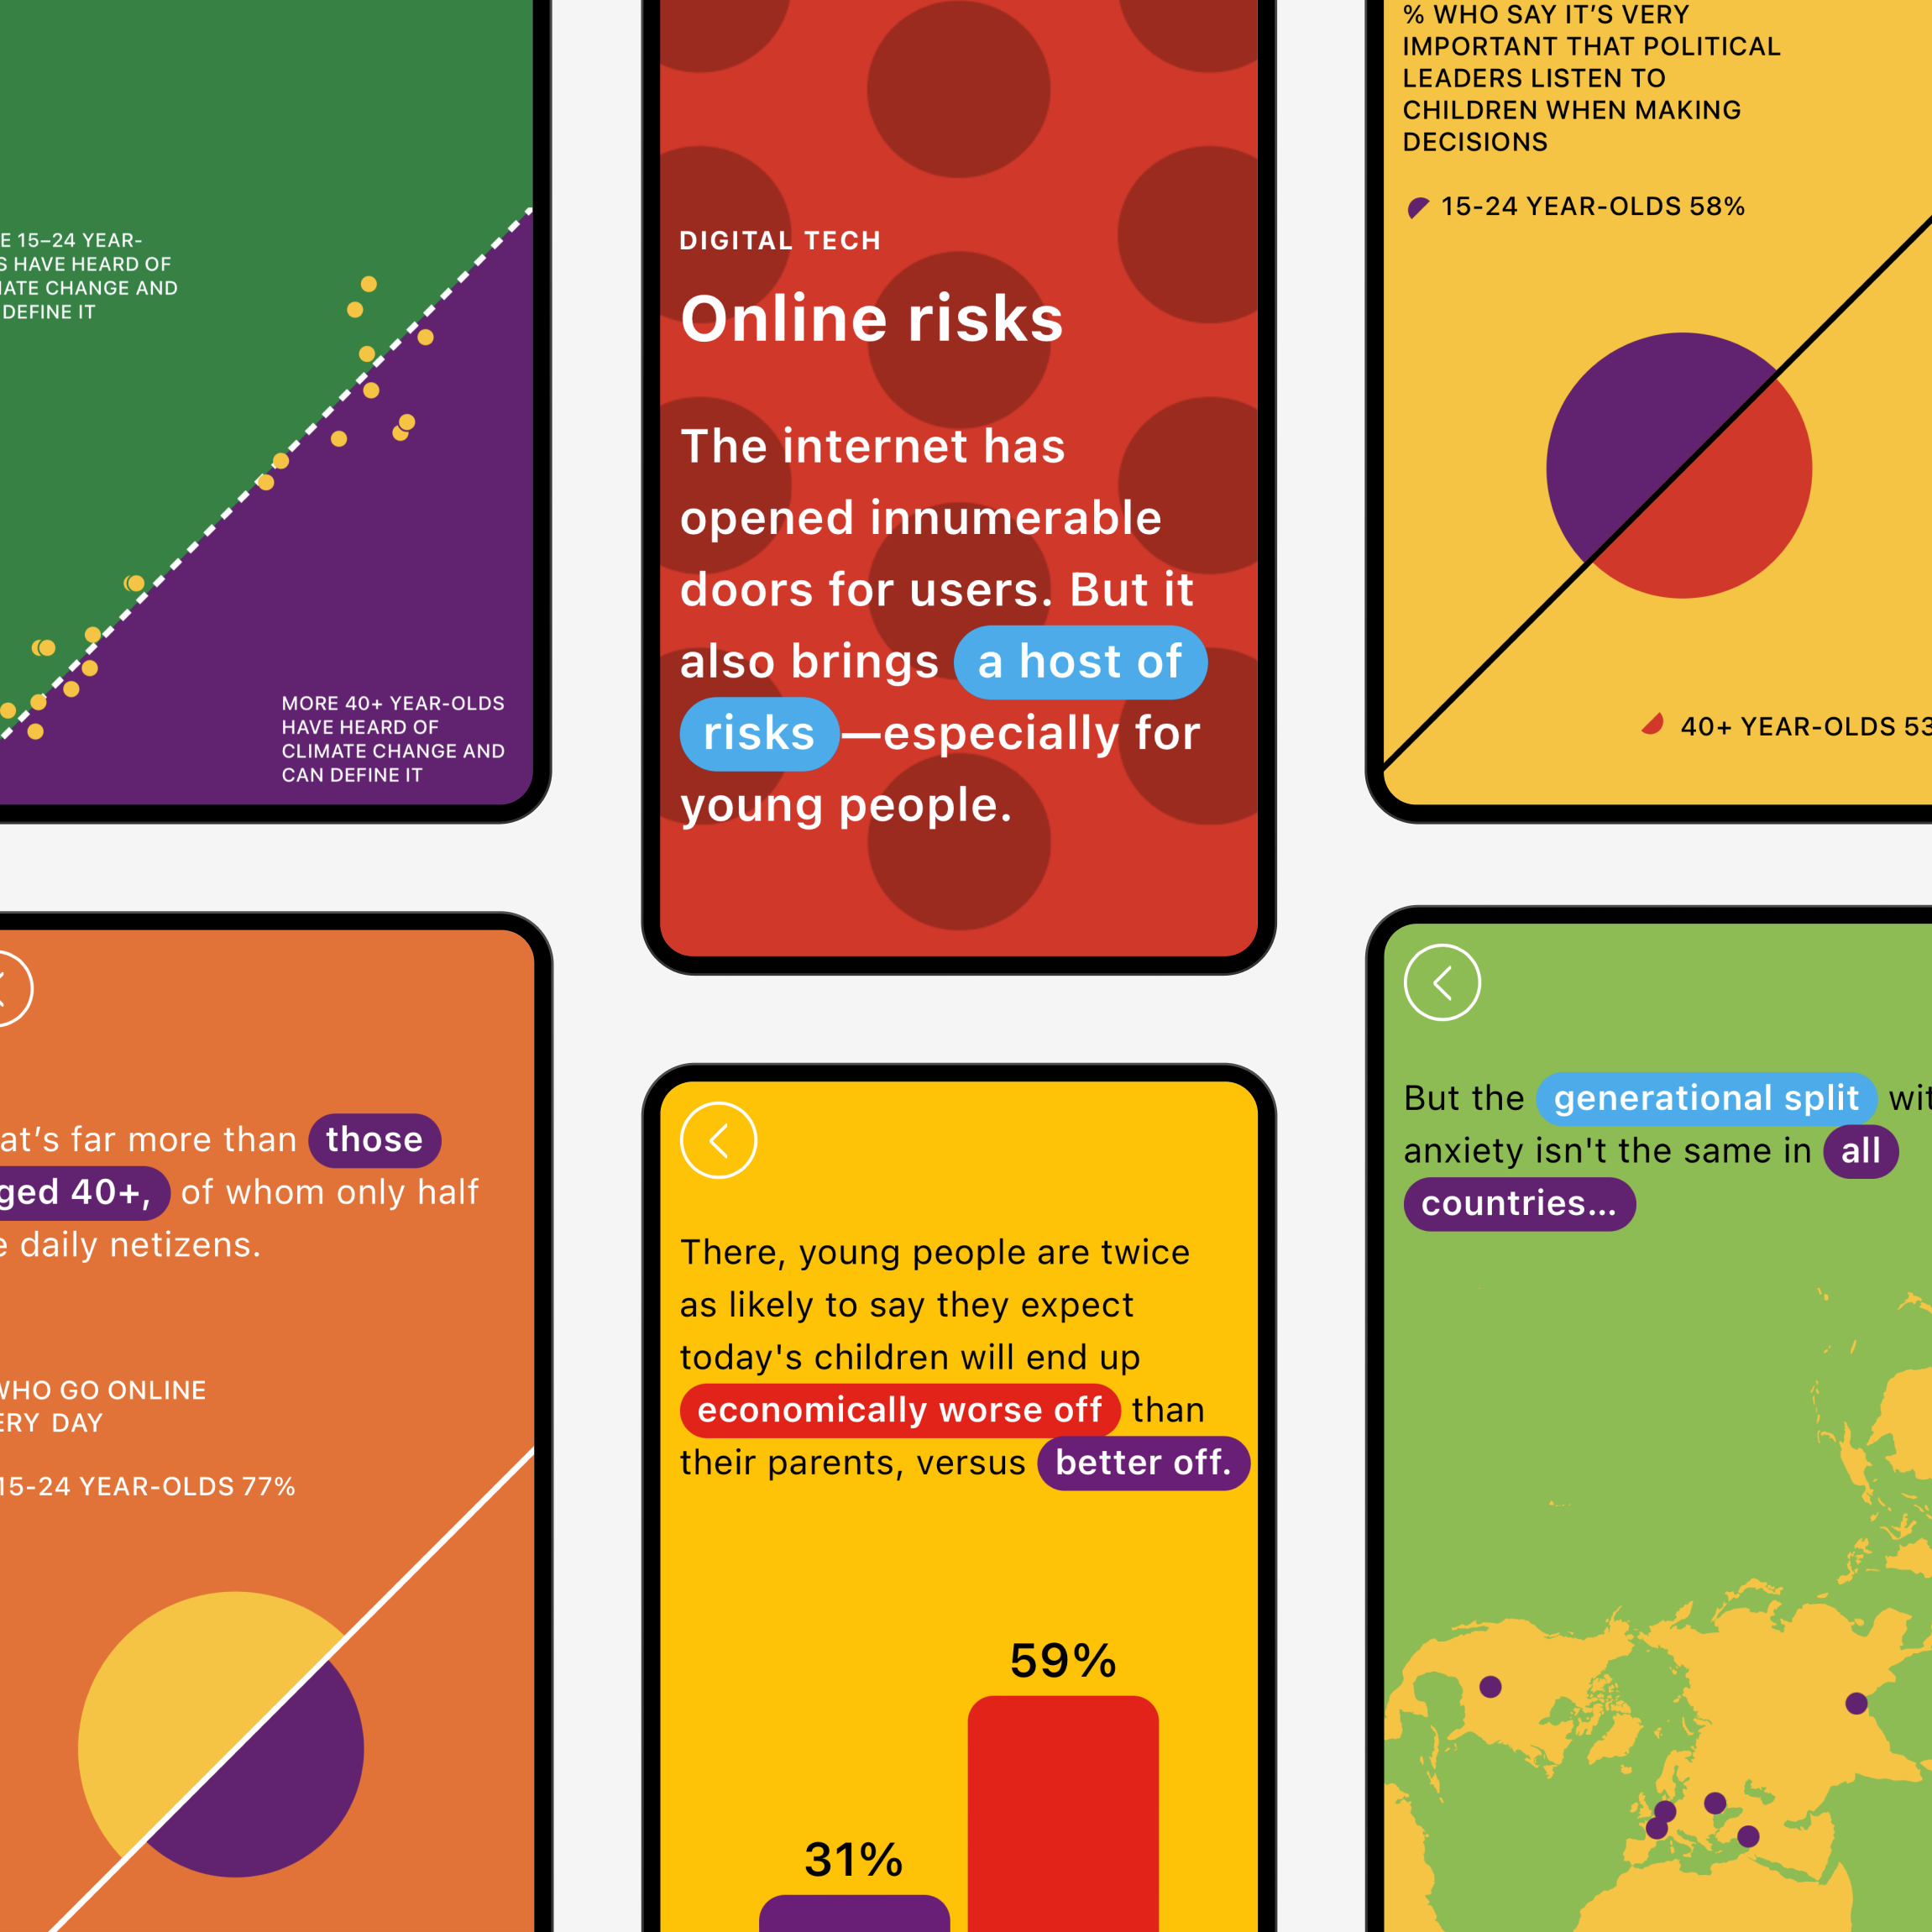
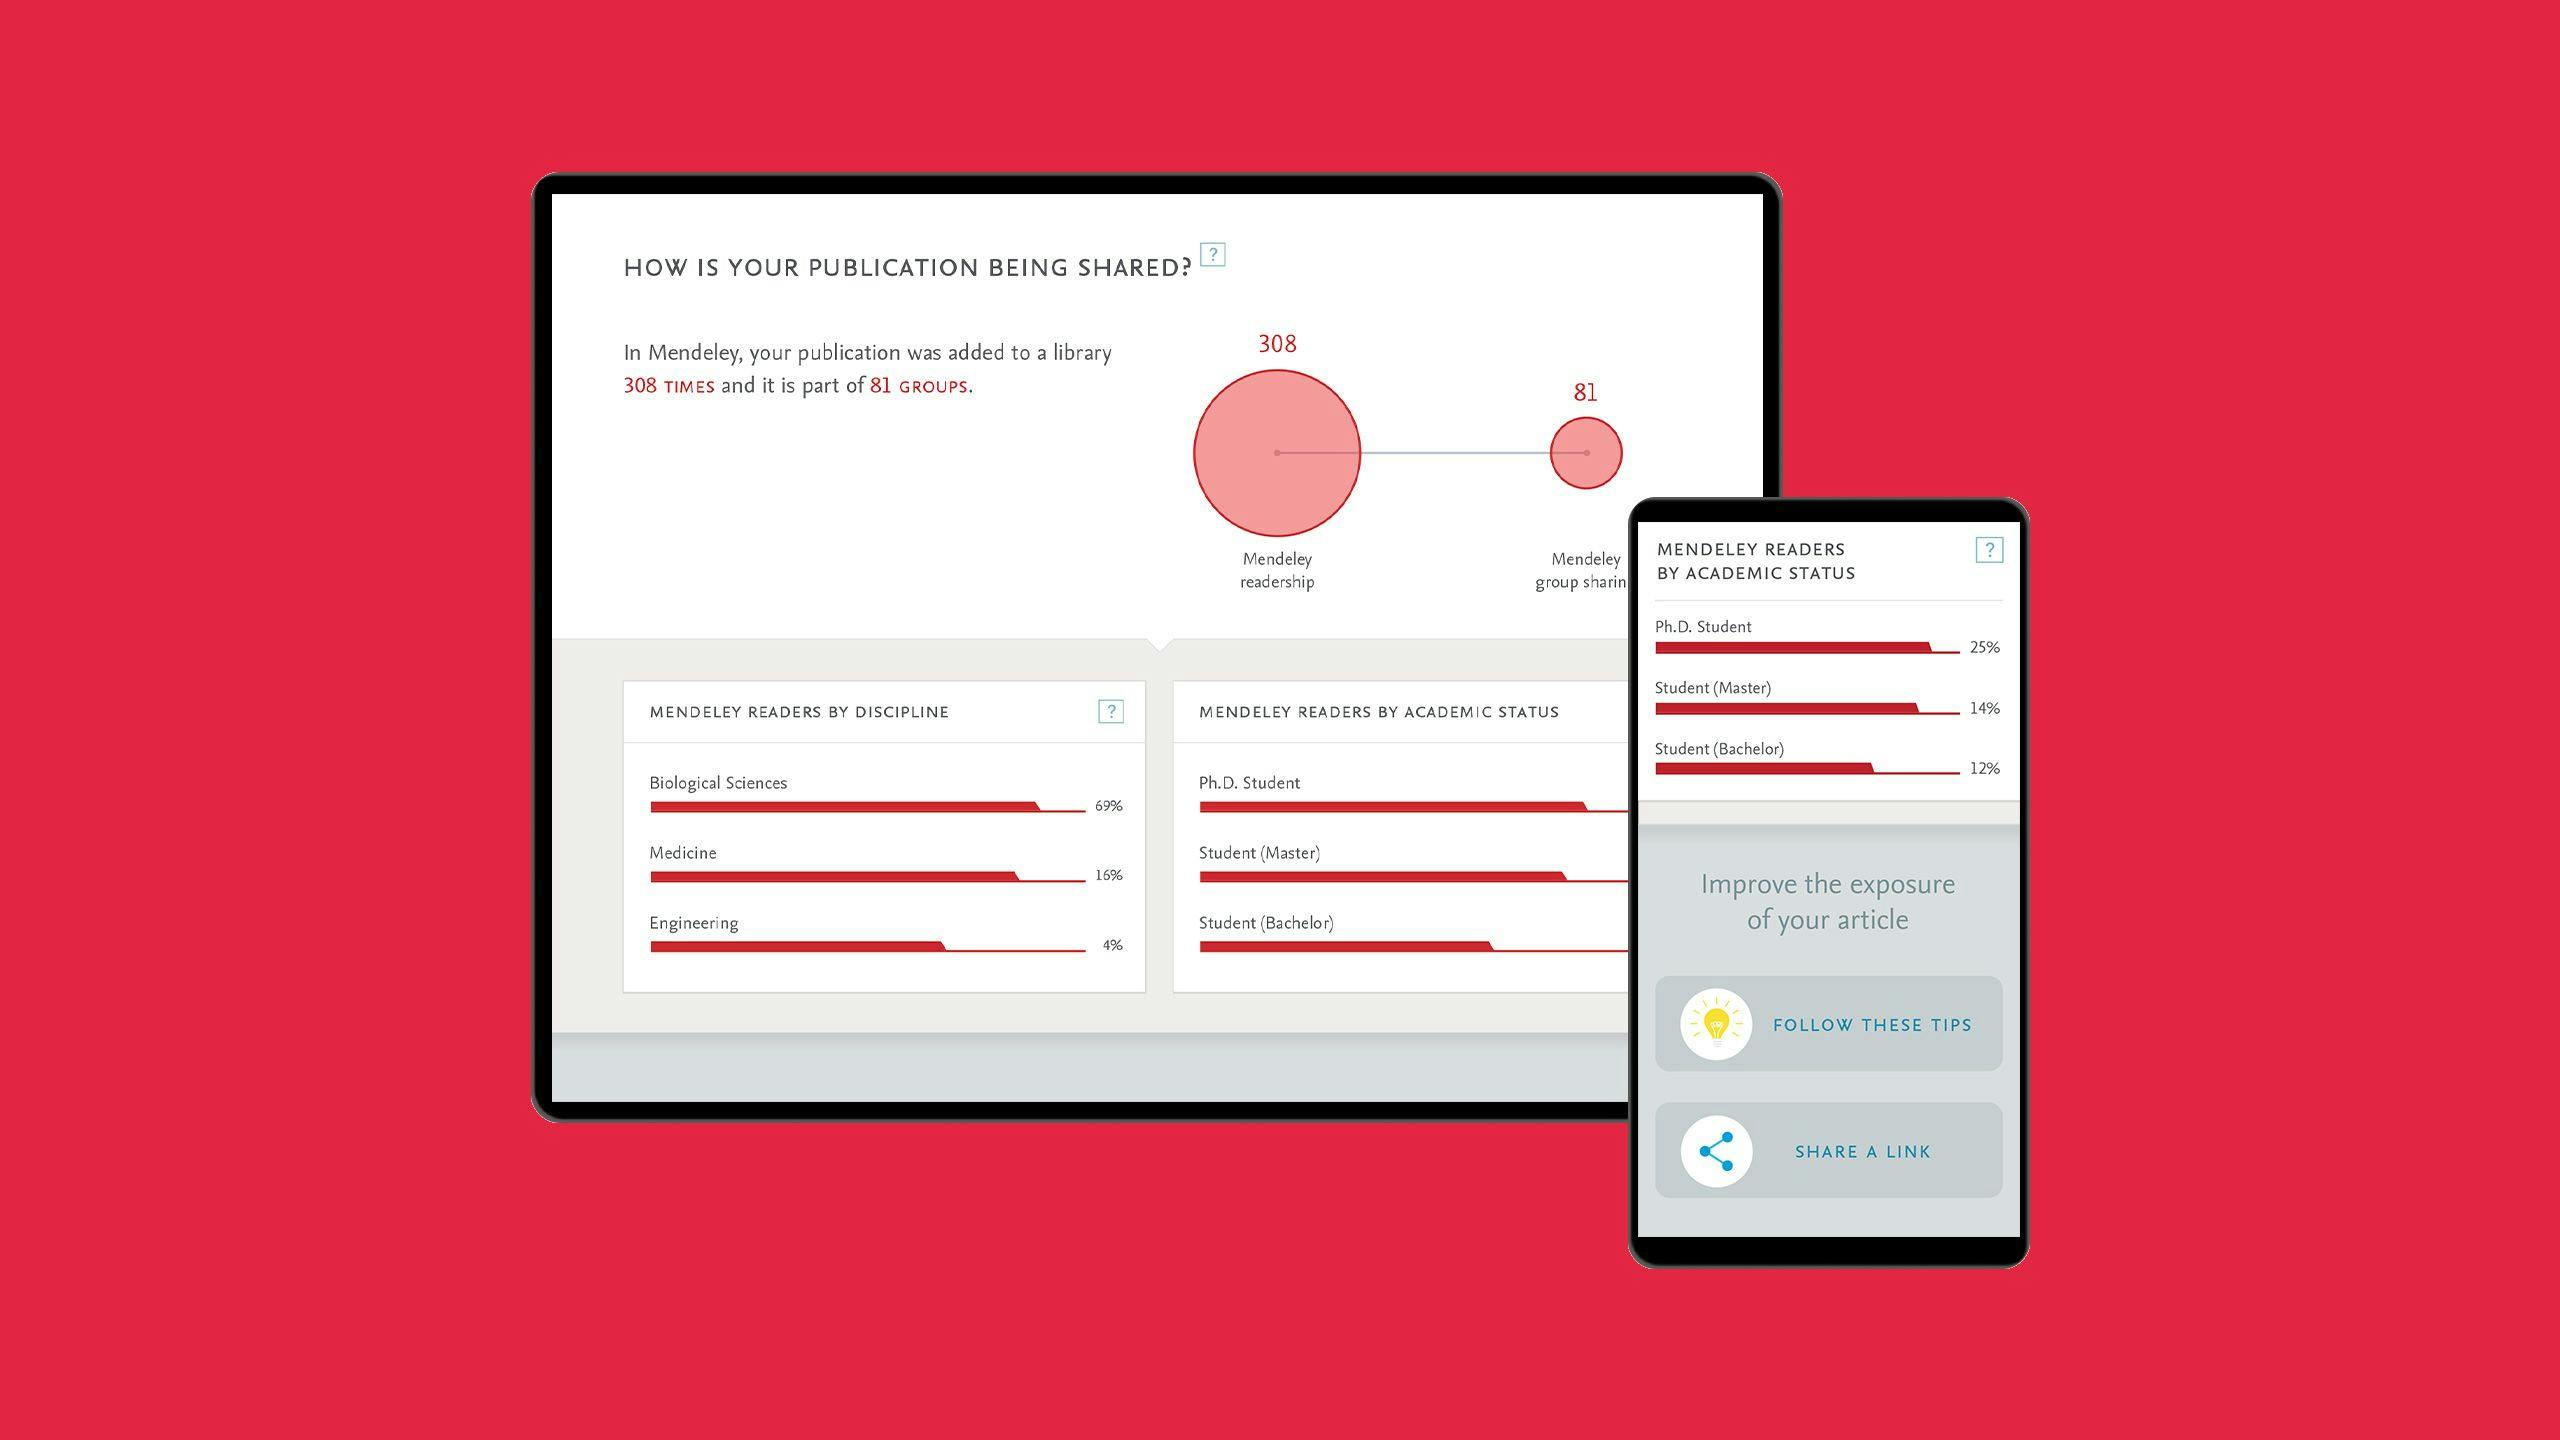
My Research Dashboard shows the global impact of the writer, their most recent articles as well as continuous relevance of their past work. Every month, it provides updates on a variety of metrics:
- feedback about how a publication is being downloaded, shared and cited;
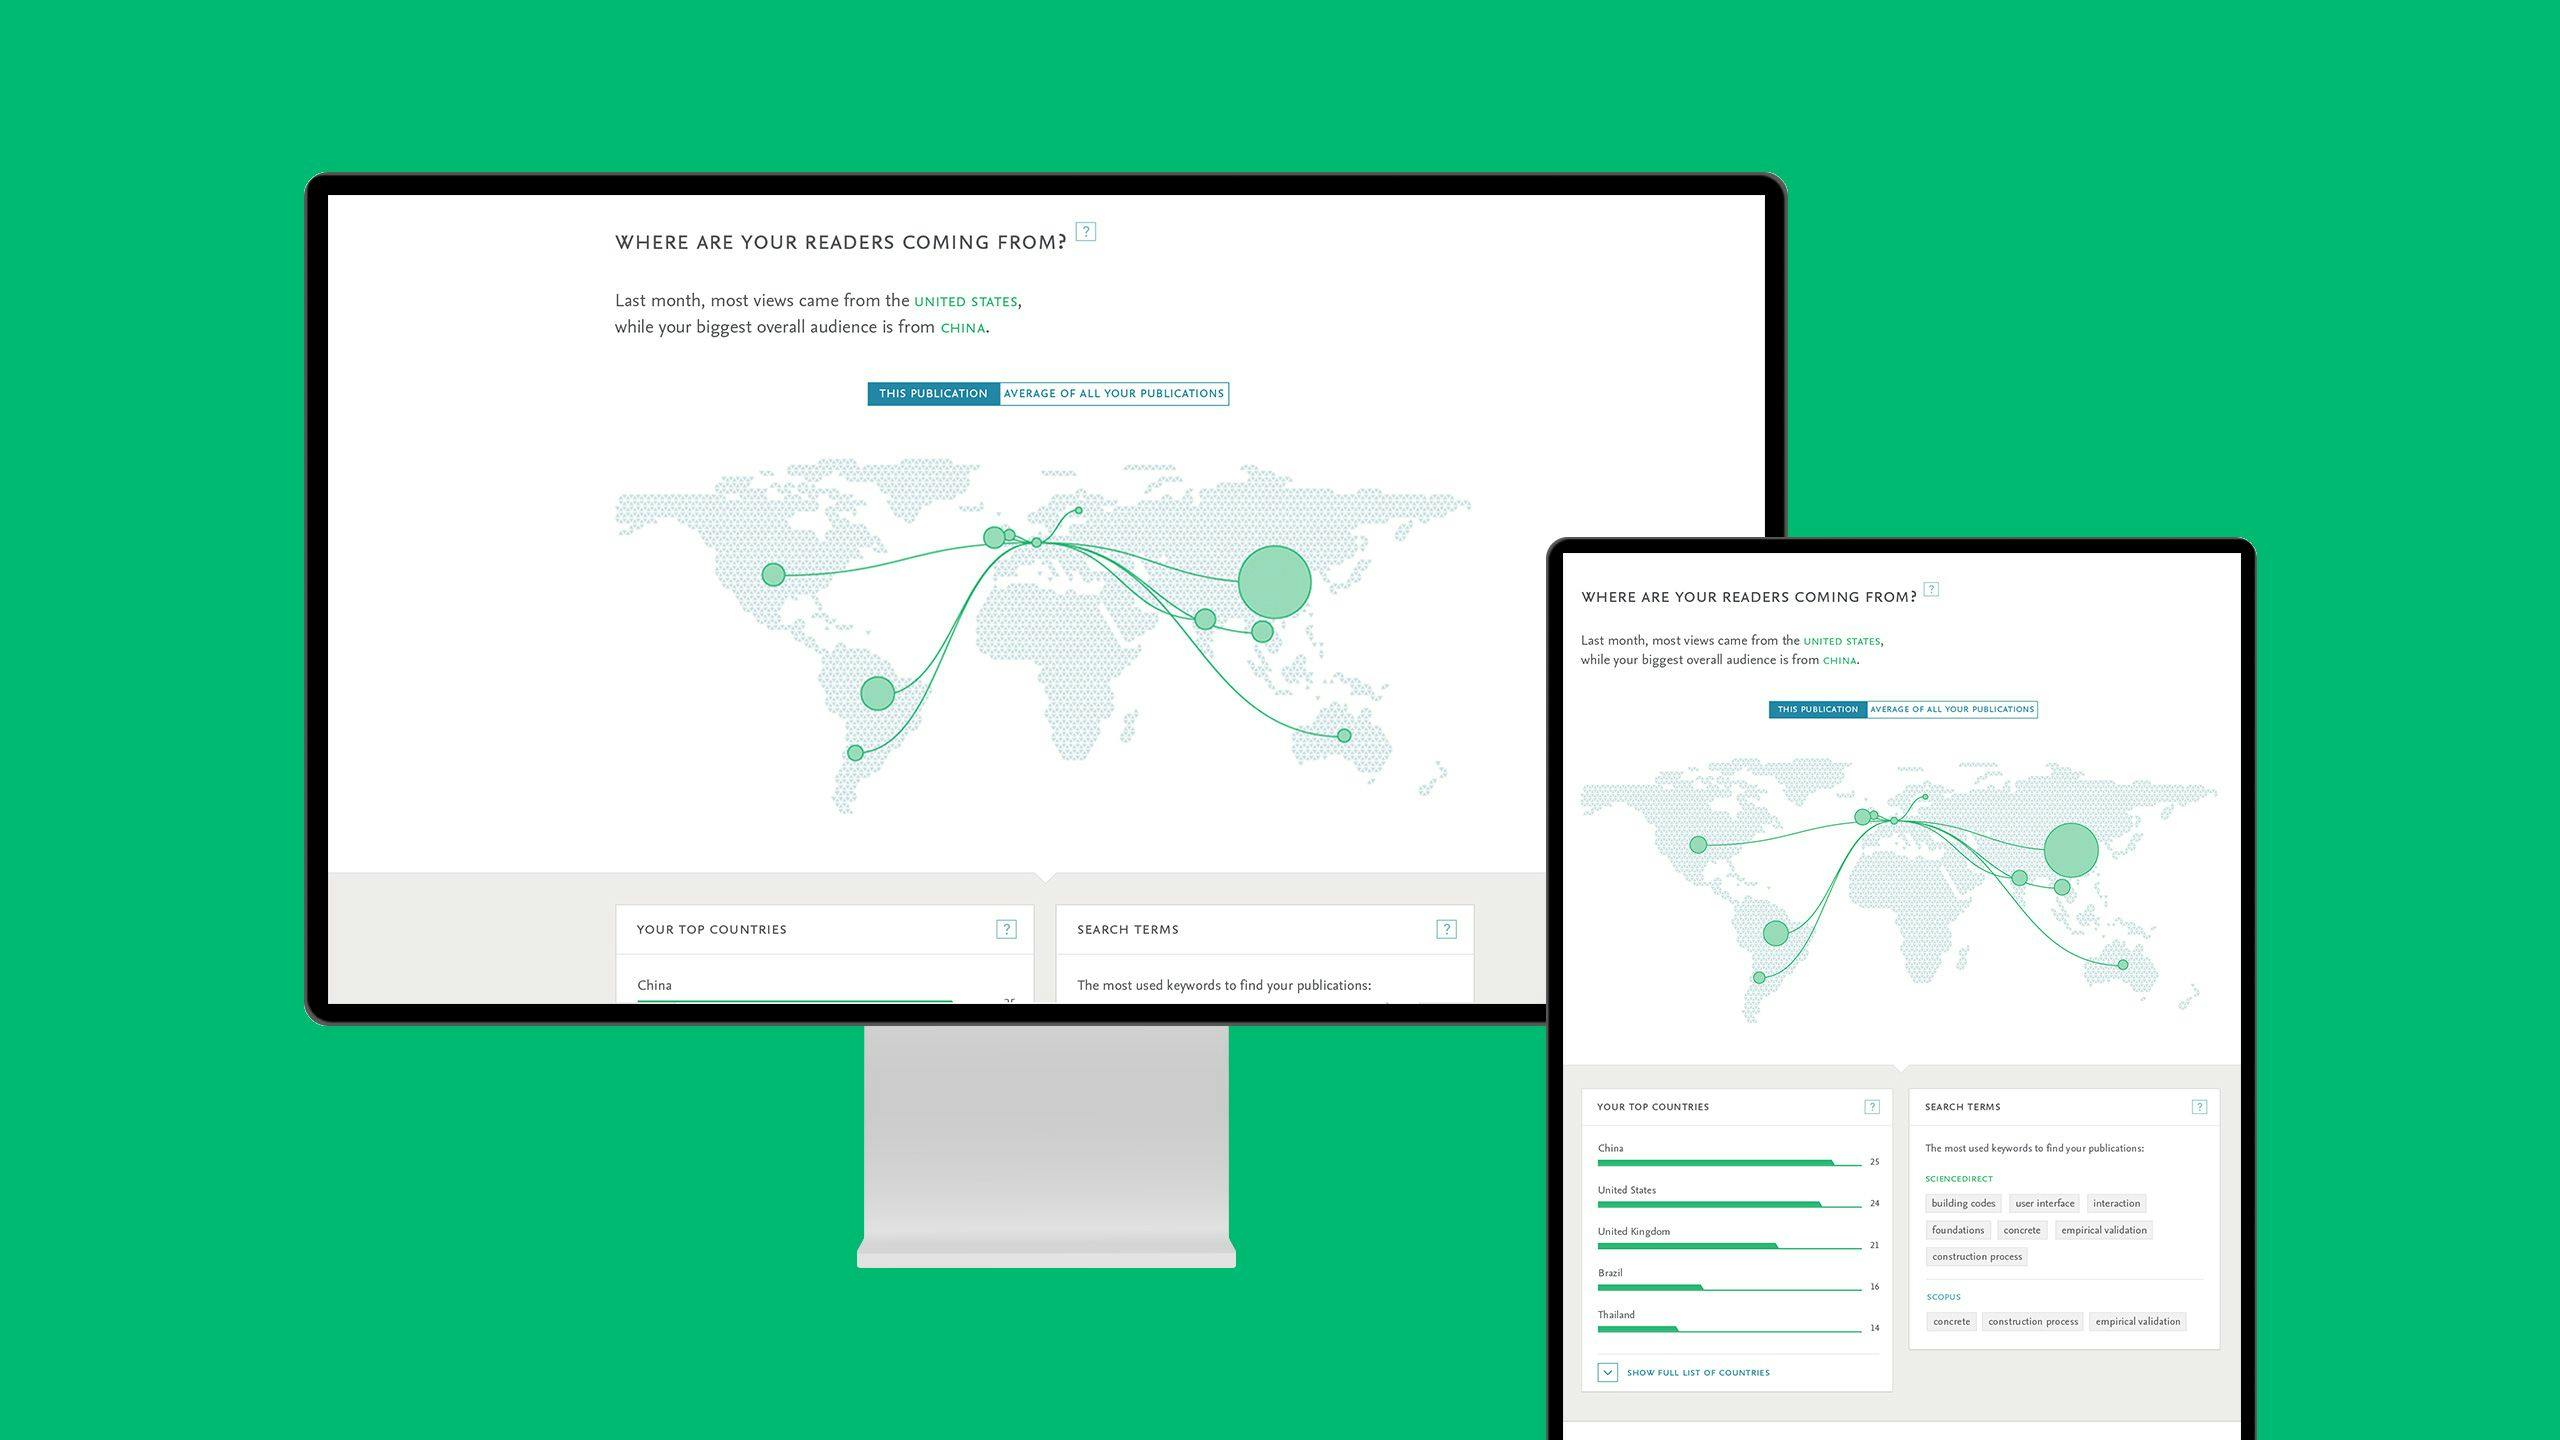
- data about readers, including their global location and profession;
- detailed information about how publications are being discovered;
- information on usage in social platforms, such as Mendeley;
- mentions in mass media through press releases or expert opinions.
For all of these topics, the platform highlights the most important information, as well as allowing the user to drill down to see the full details.
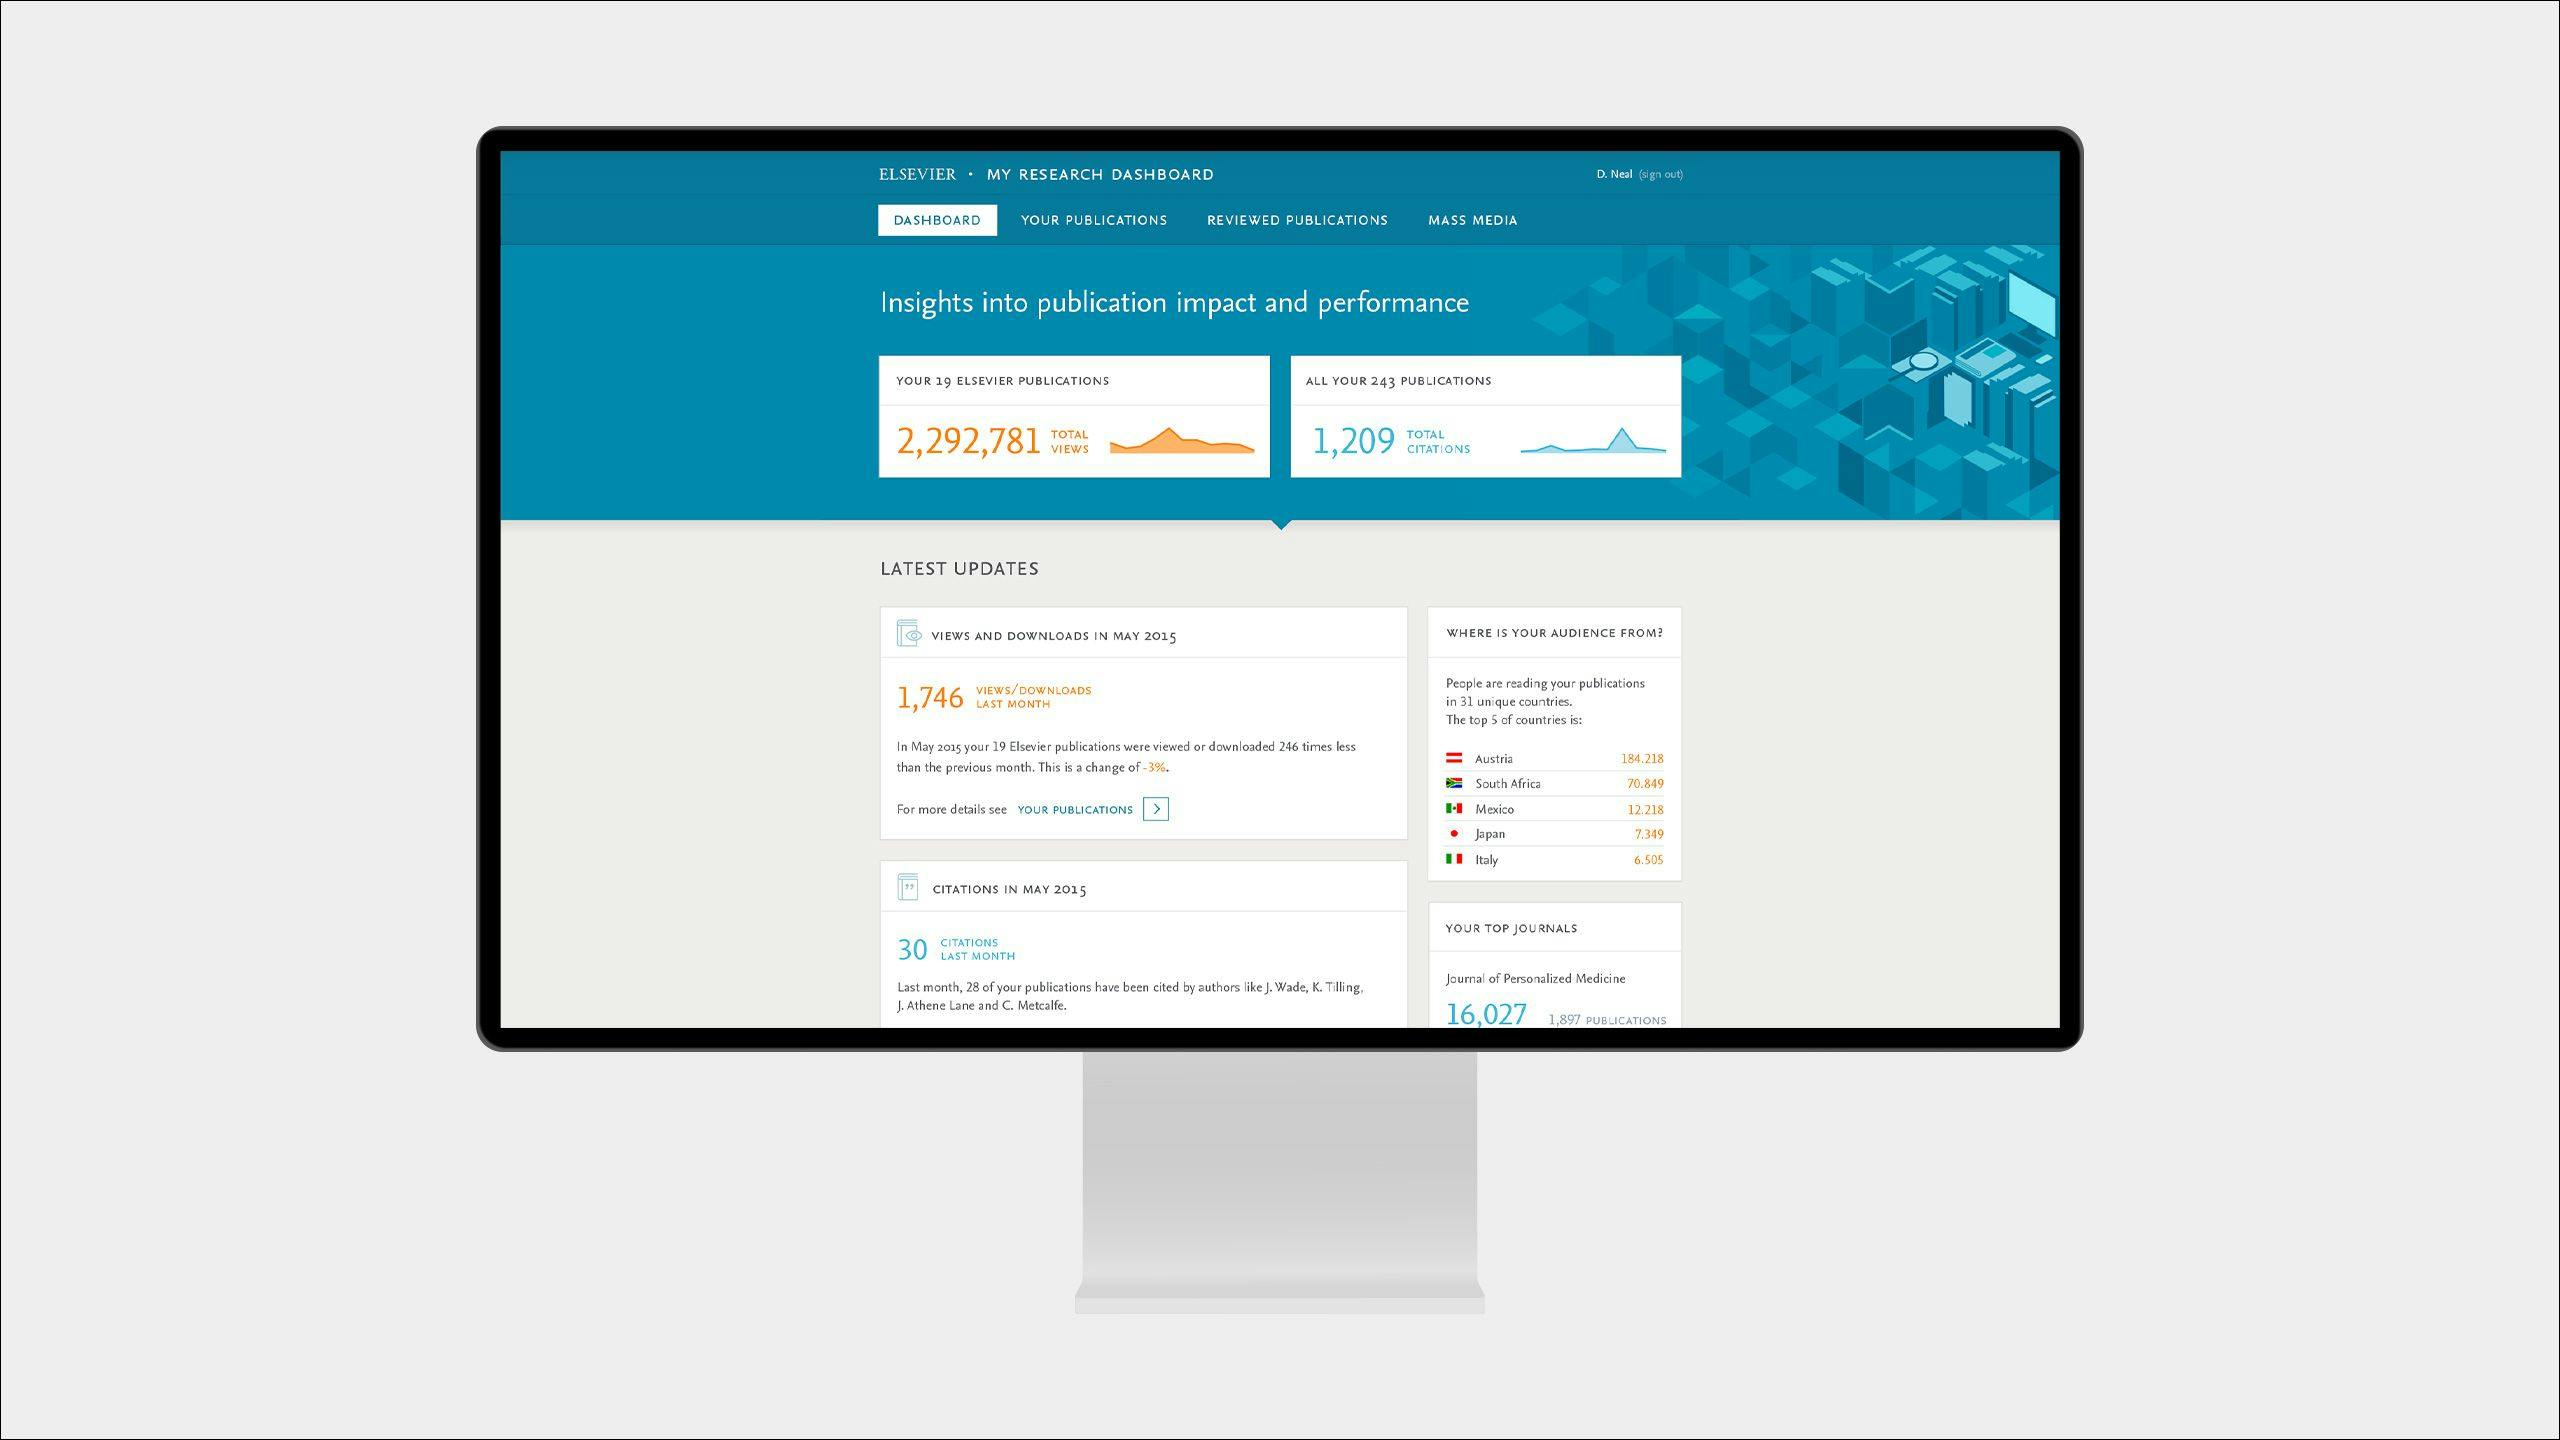
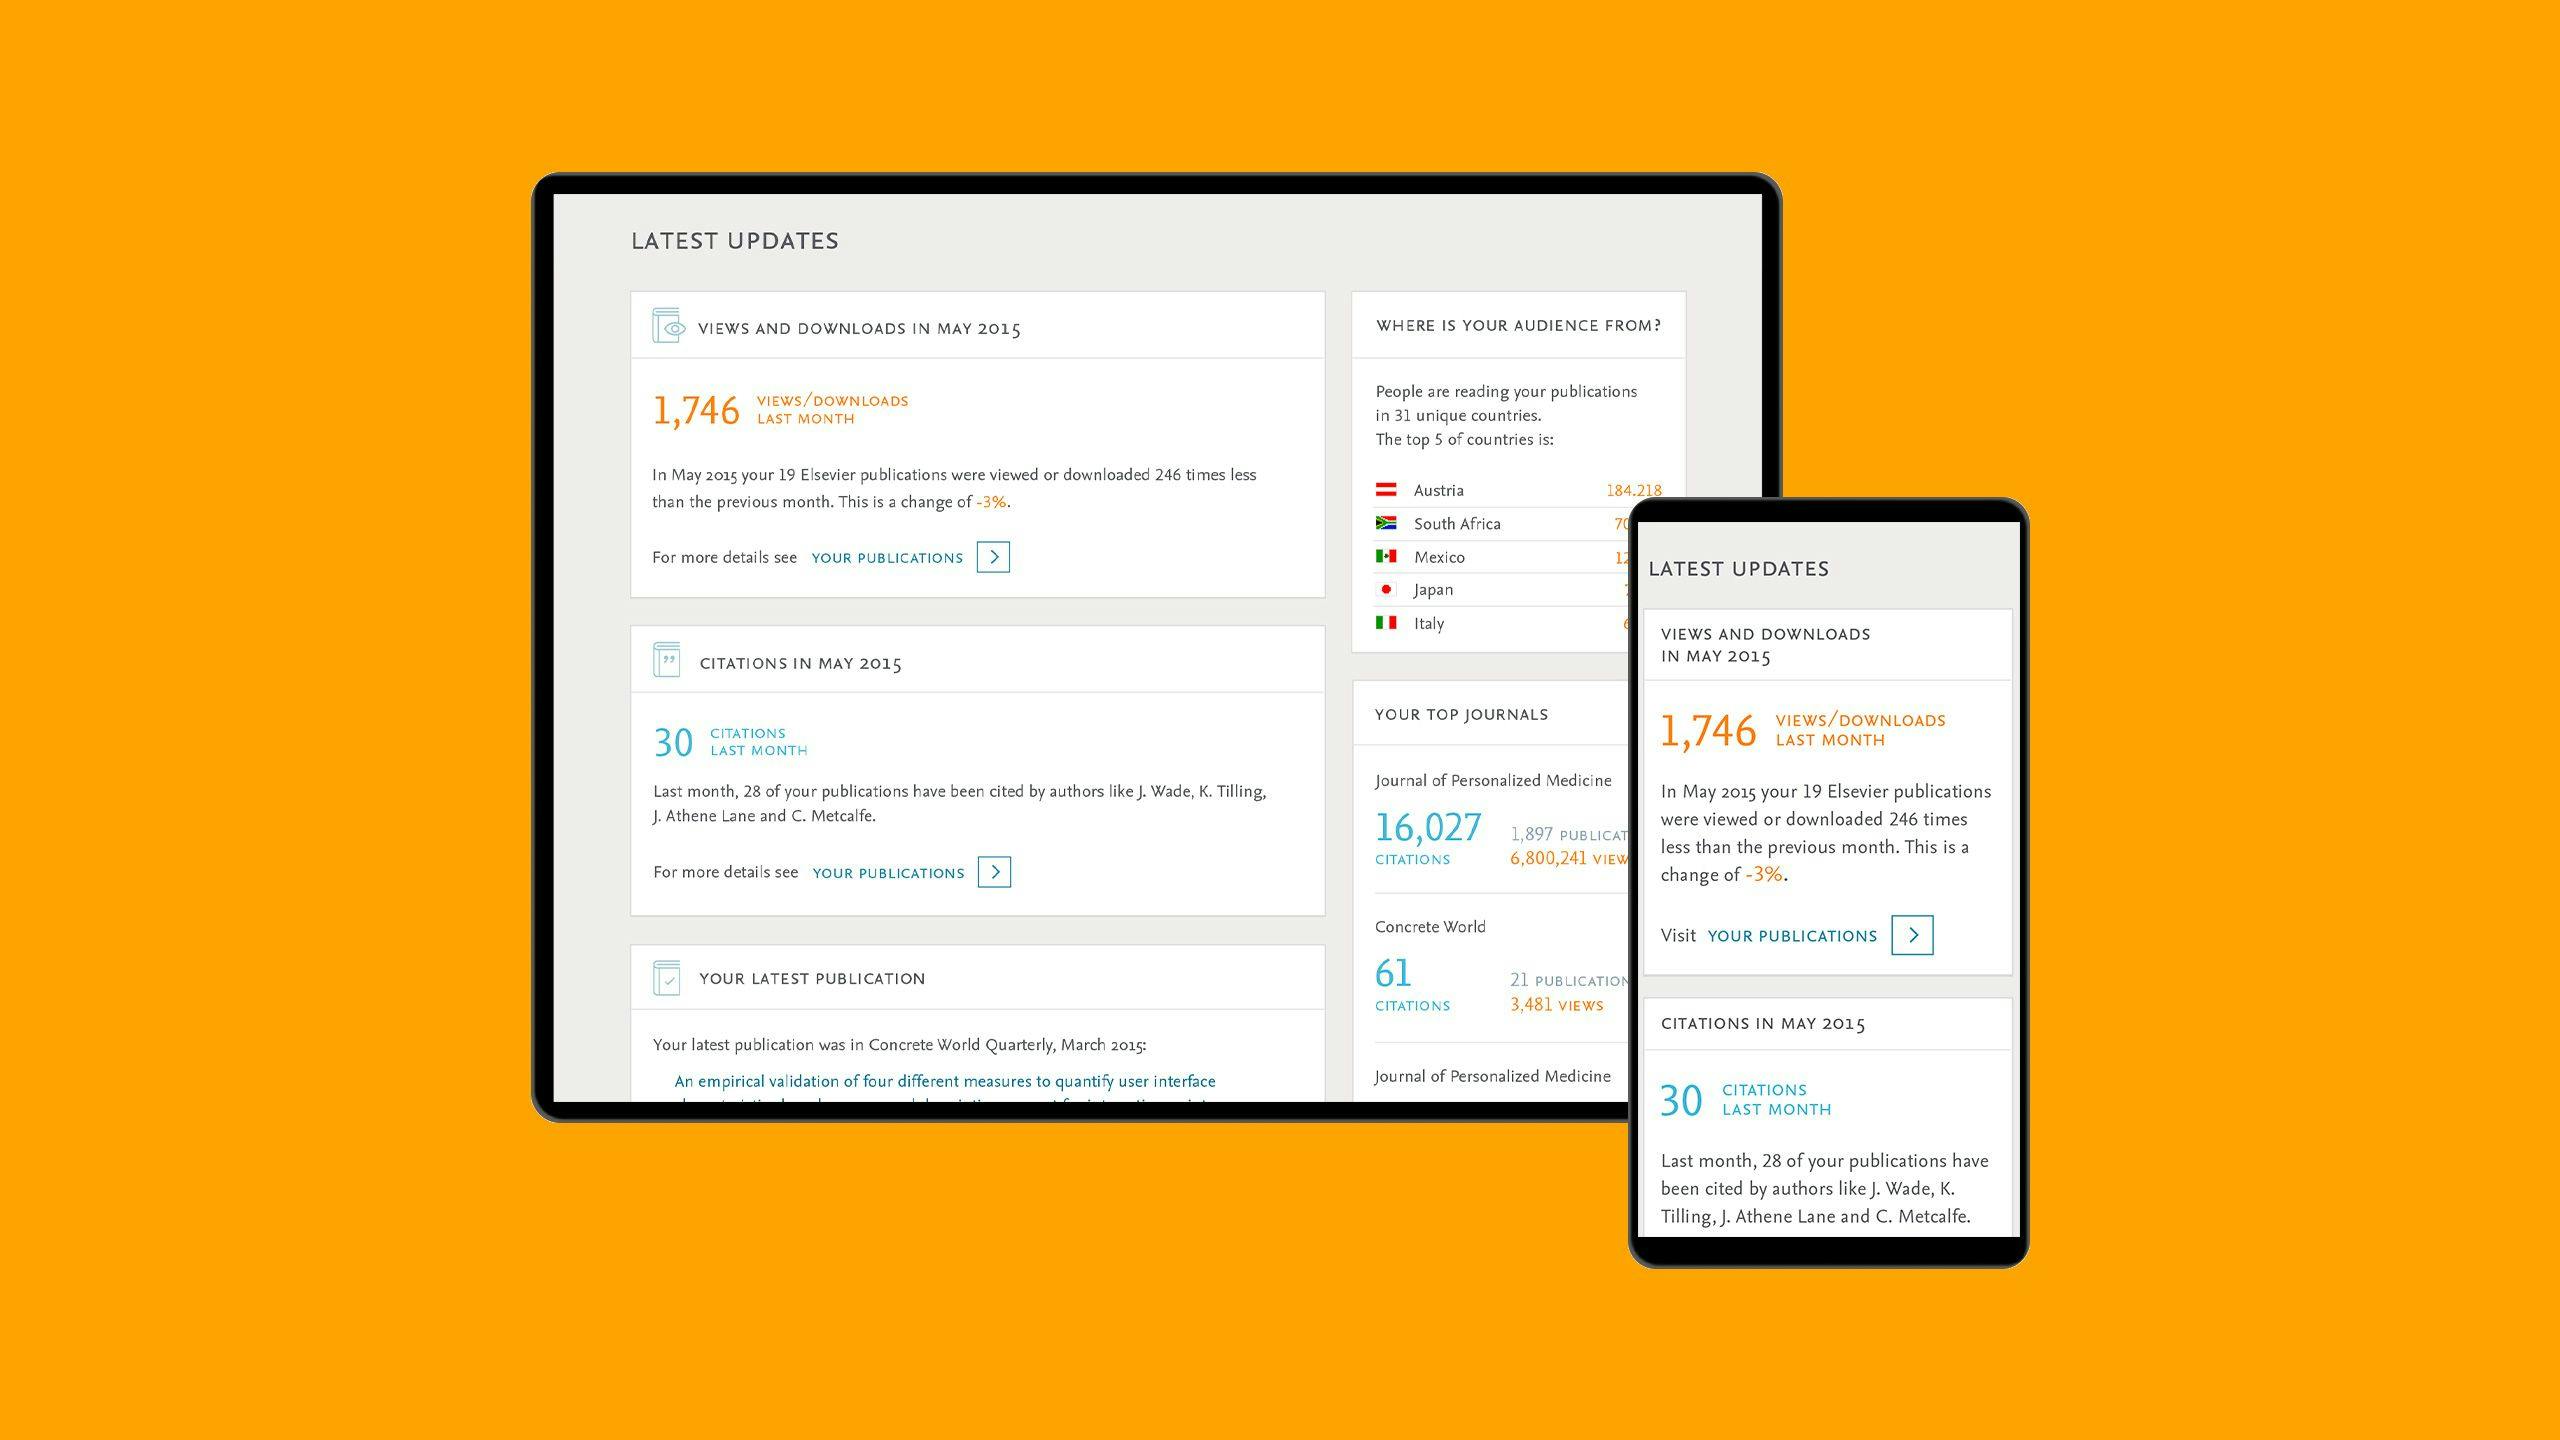
Homepage
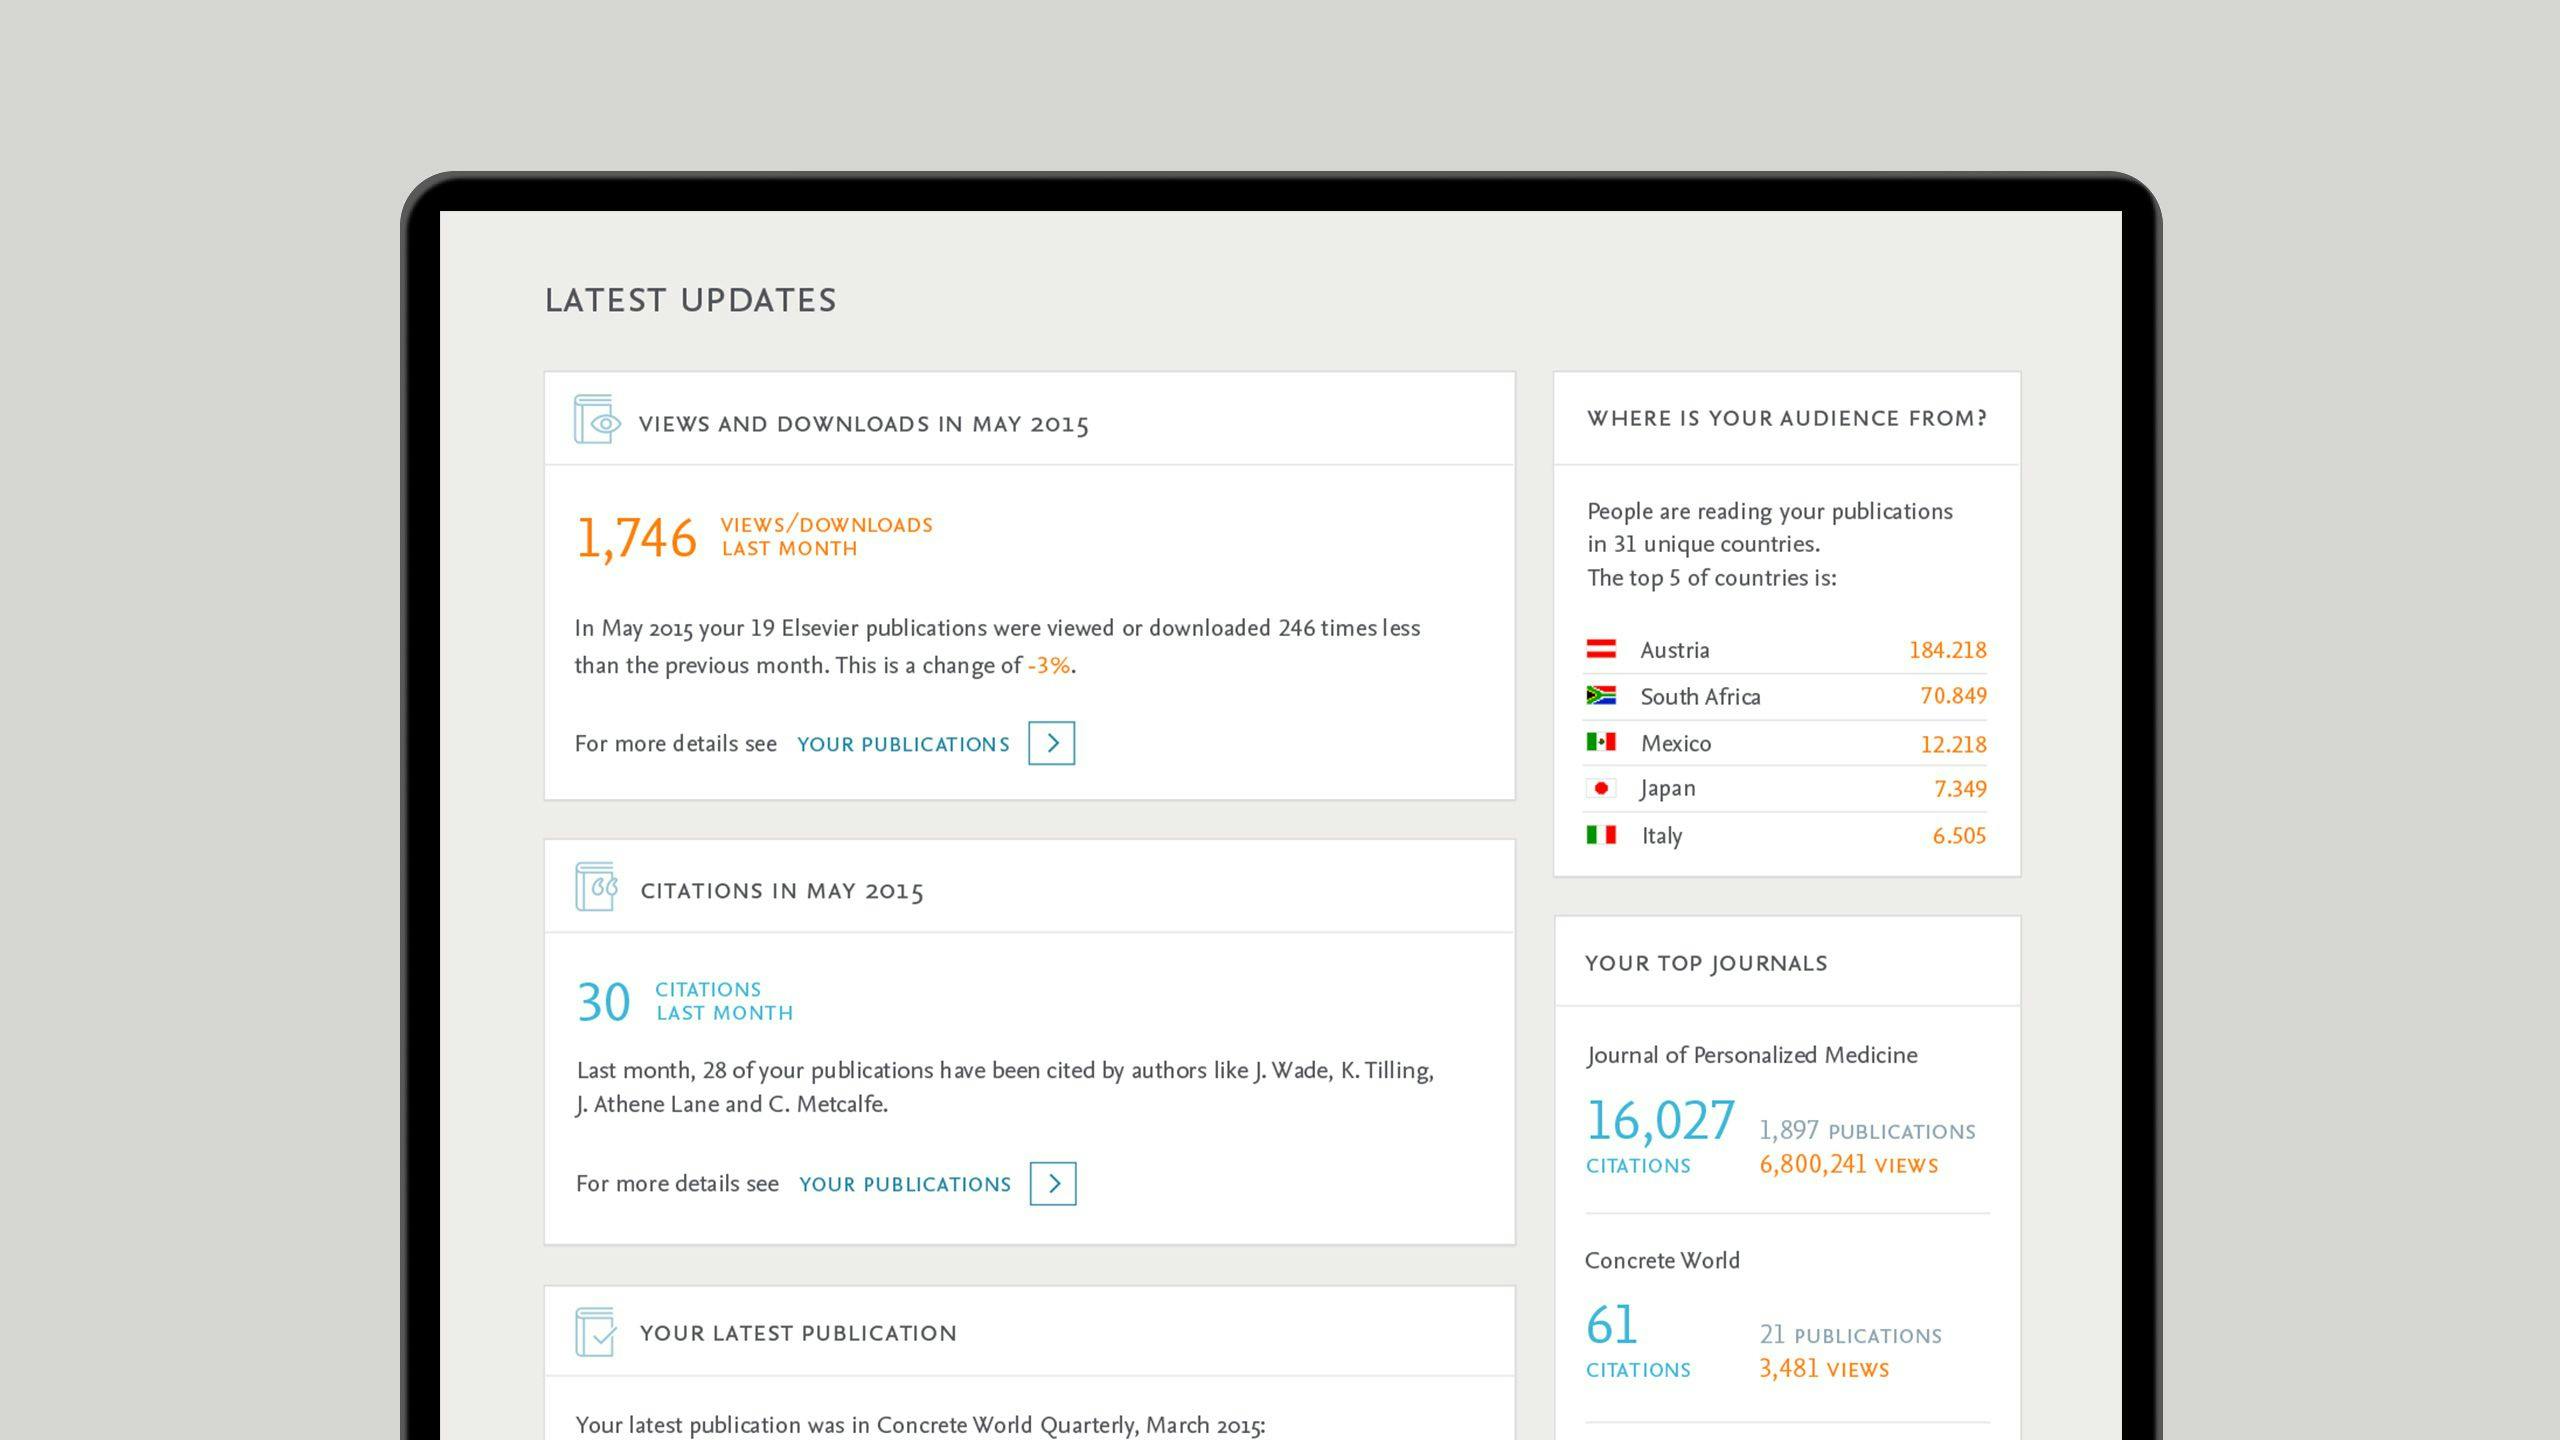
The homepage is a personalized welcome page for scientific authors, where they can get an overview of how their work is being perceived. In the header, we focus on the overall views (orange graph) and citations (blue graph) and when they occurred over time, providing a sense of performance and value for anything published so far.
The homepage provides a unique source of information with useful insights. Further down the page, authors can gain more detailed information about the most cited and viewed publications, where readers come from, and more.
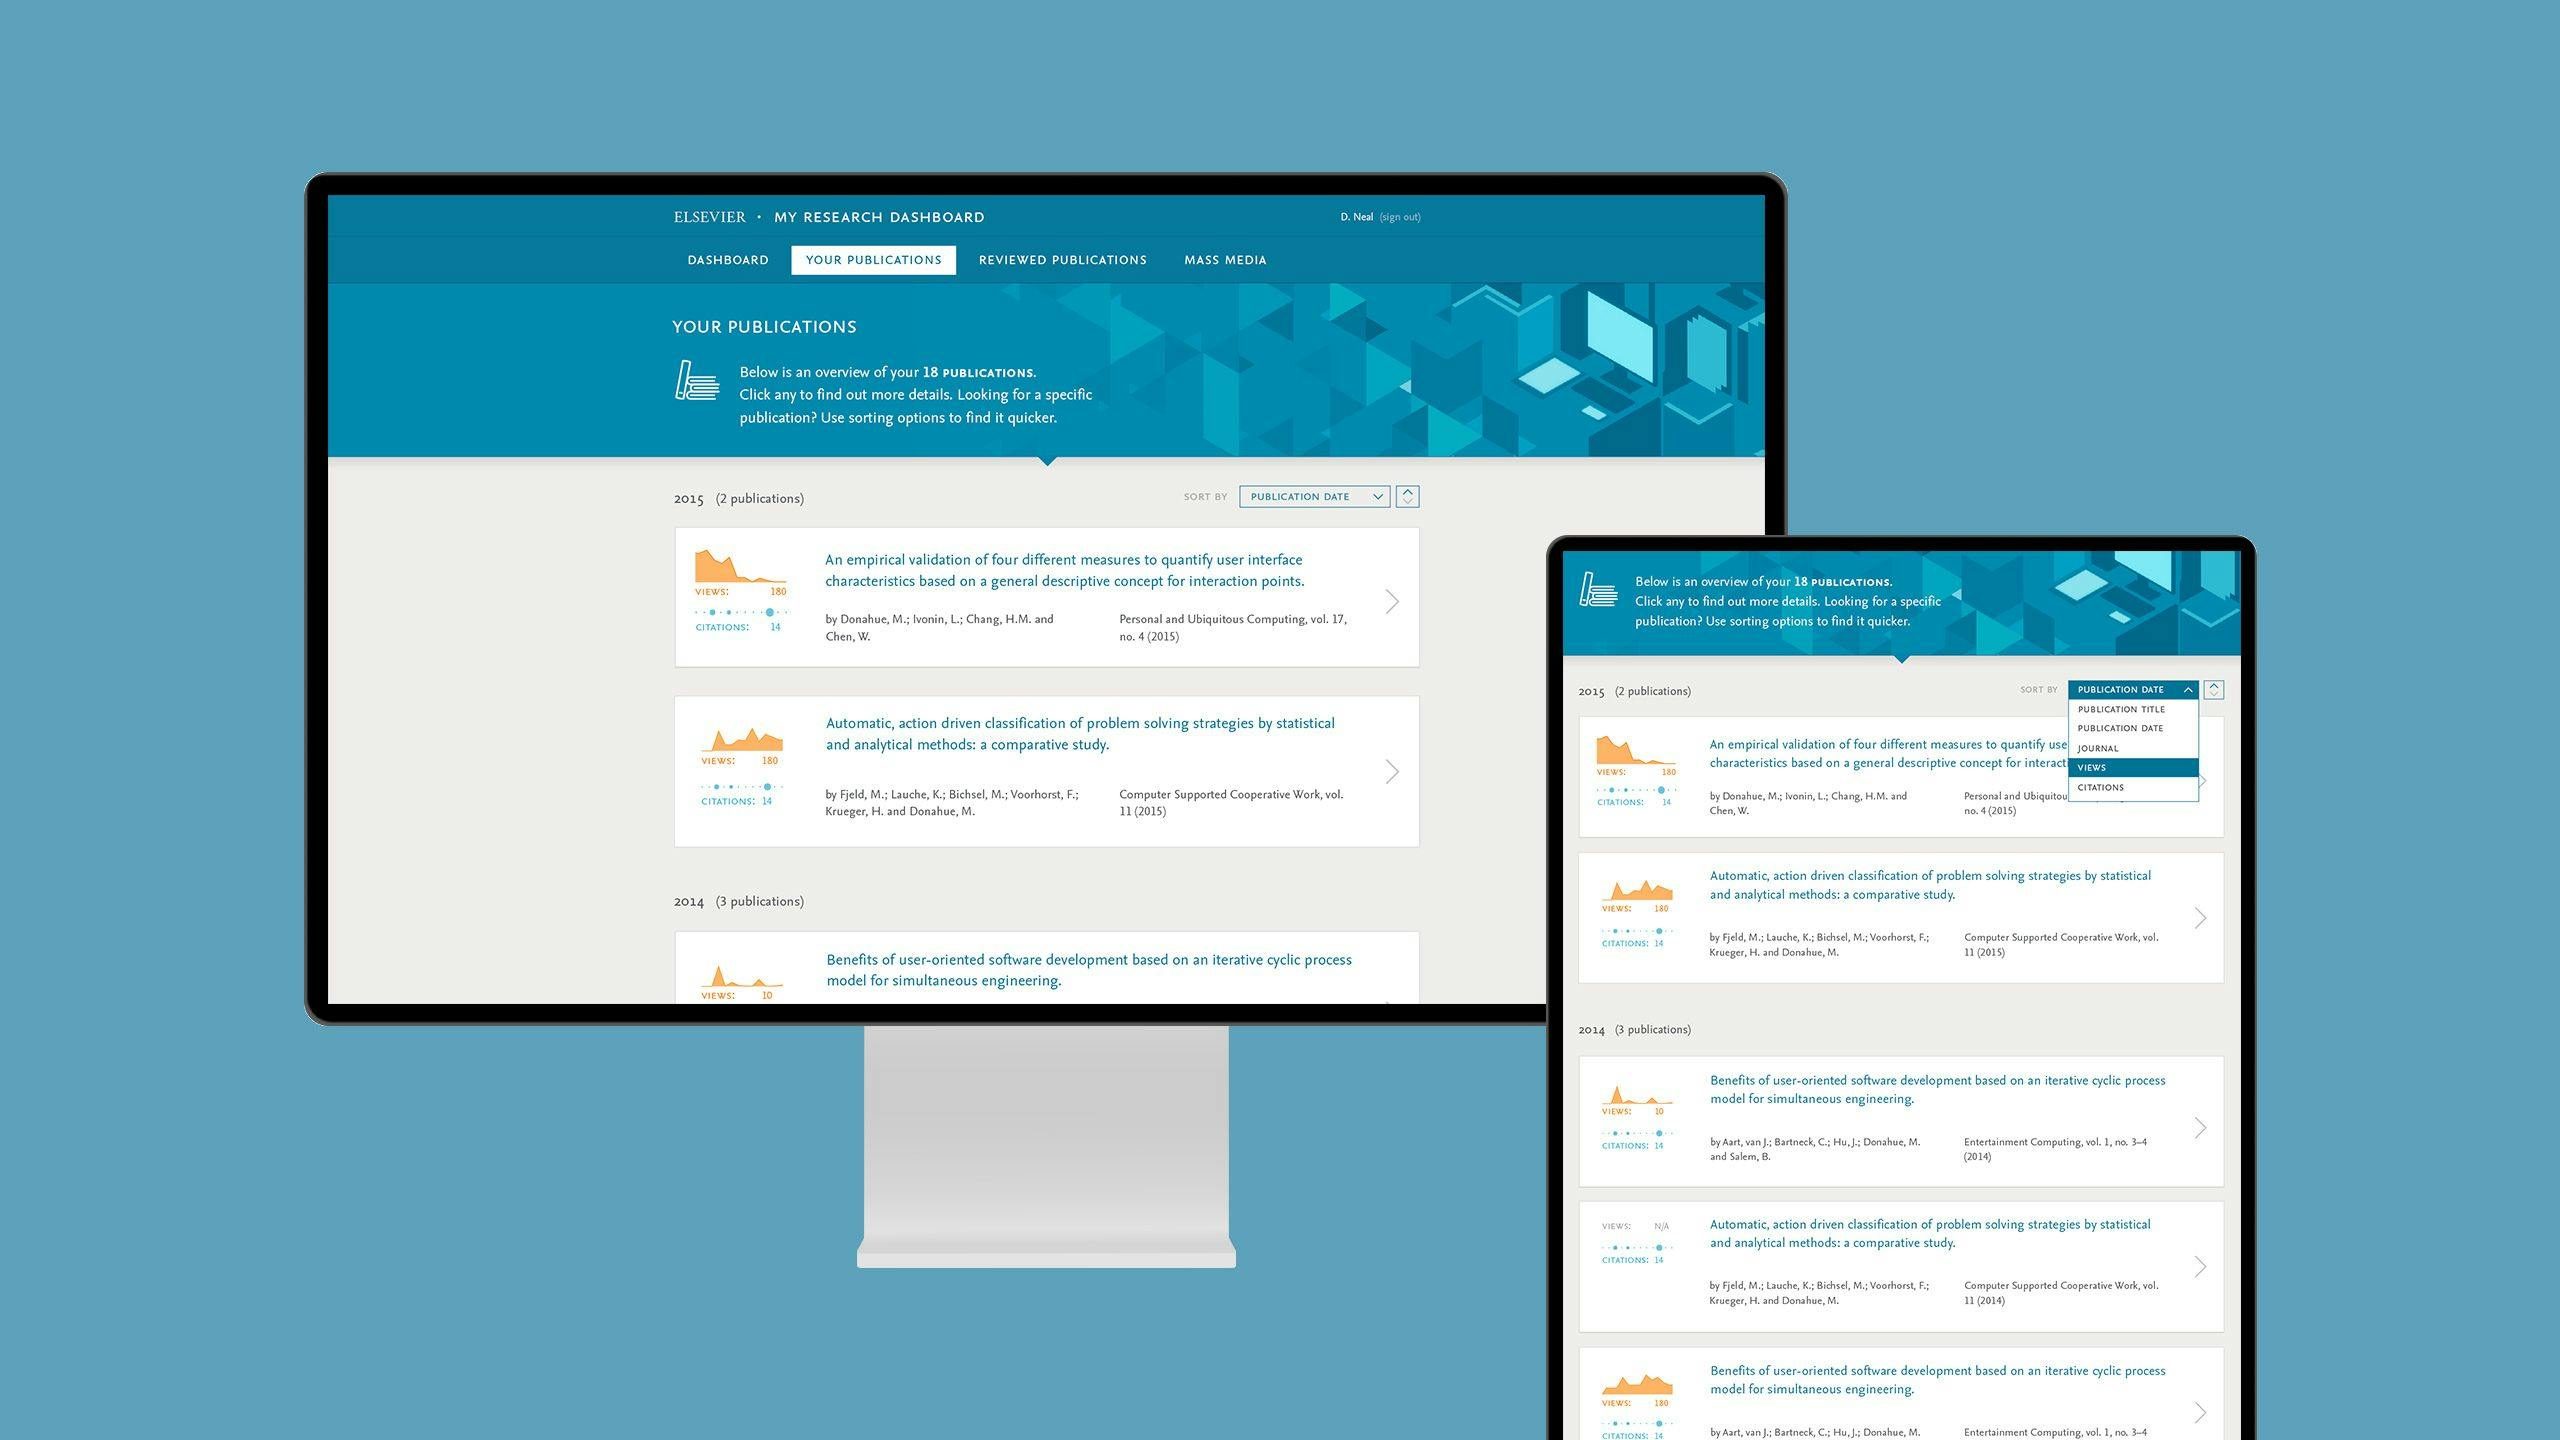
Publicationslist
On the publications list page, a list of all prior publications from the author can be found. Besides filters and sorting options, for each publication, a mini-chart shows views and citations over the past period.
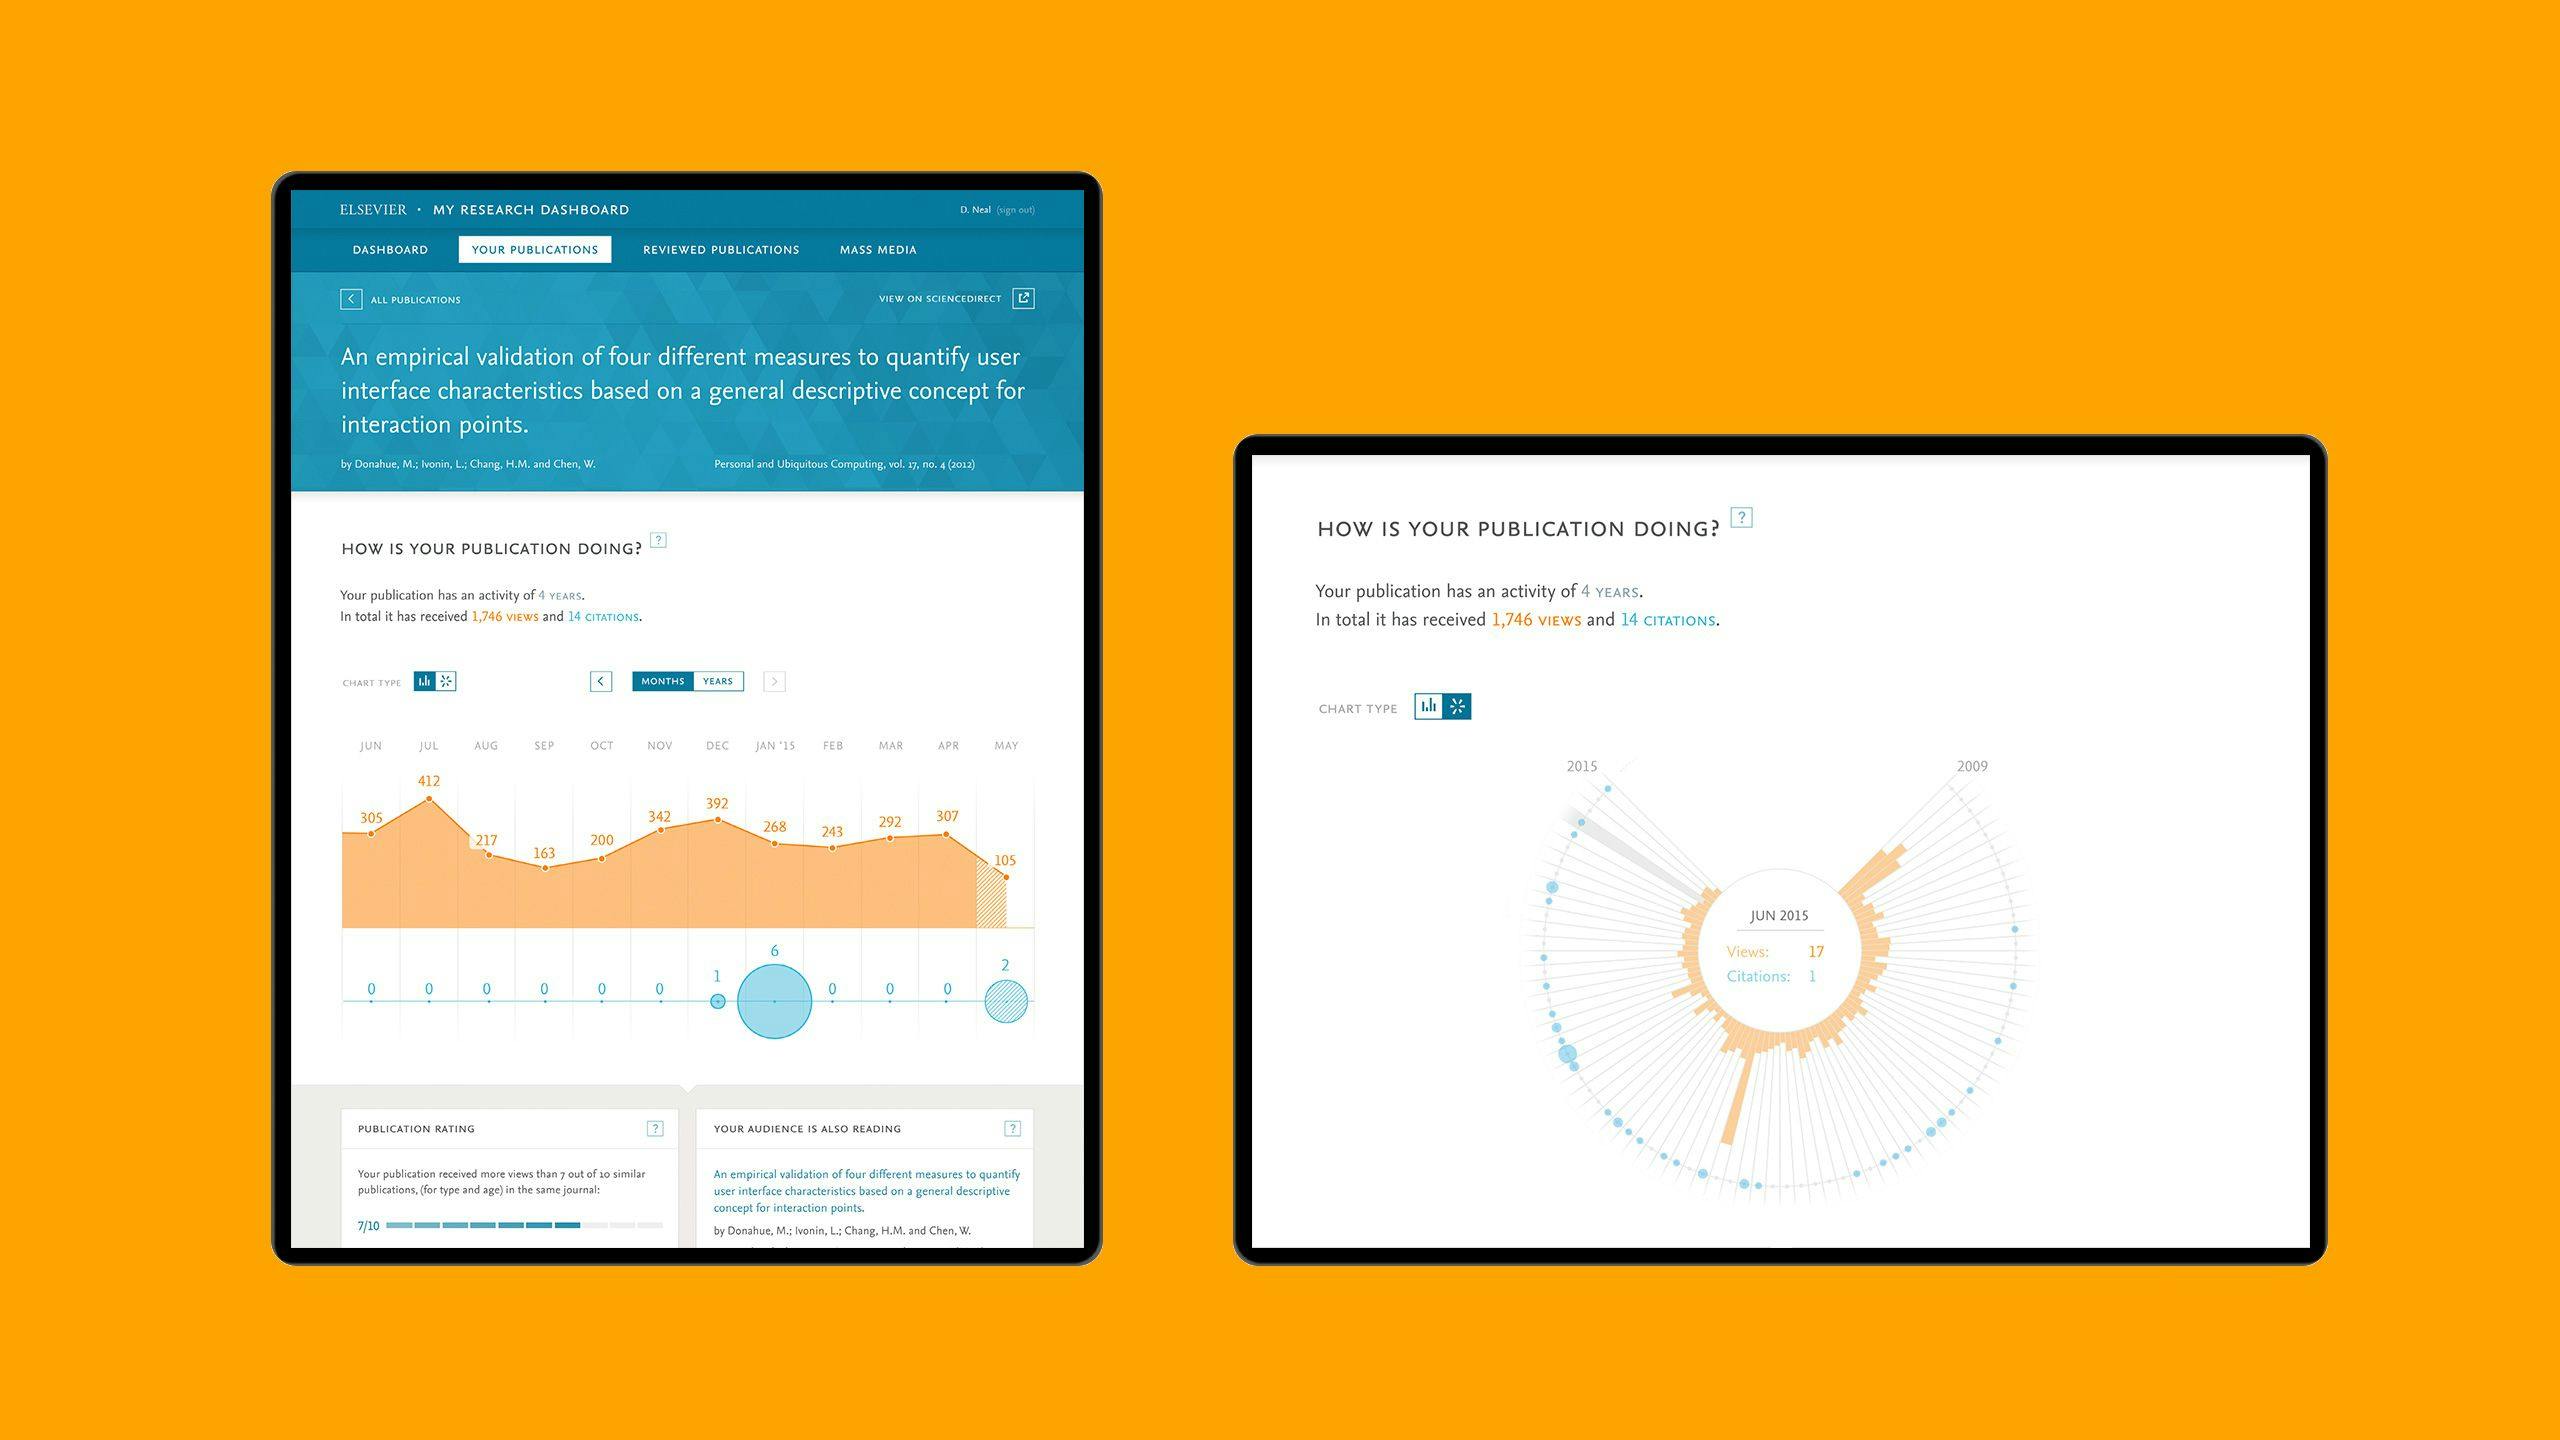
Publicationpage
On the publication page, an interactive chart shows views and citations of a specific publication. The chart exists in two views: horizontal and circular. The horizontal chart shows data aggregated by month or by year. The circular view is a unique chart showing the entire lifespan of the publication in a single overview view.
Technology
AngularJS was used as the core framework for the visualizations while the graphs were developed with the D3 visualization library.
Results
MRD is one of Elsevier’s key strategic projects in helping improve the productivity of academic authors globally. In C°F we found a partner that is truly professional and excellent in UI/UX design & development. The aim was to show new, attractive and comprehensible data, relating to the author’s publication. C°F has been a very proactive, fast and a truly agile & strategic partner. They have combined clean design with practical solutions to present complex data in a compelling way.
Matteo Ripamonti
Strategy Analyst, Elsevier