Showcasing how traffic data creates value for traffic managers
- Client
- HERE
- Awards
- European Design Award – Silver
- European Design Award – Finalist
- Red Dot Design Award
- Deliverables
- Interactive animation
- Data visualization suite
The challenge
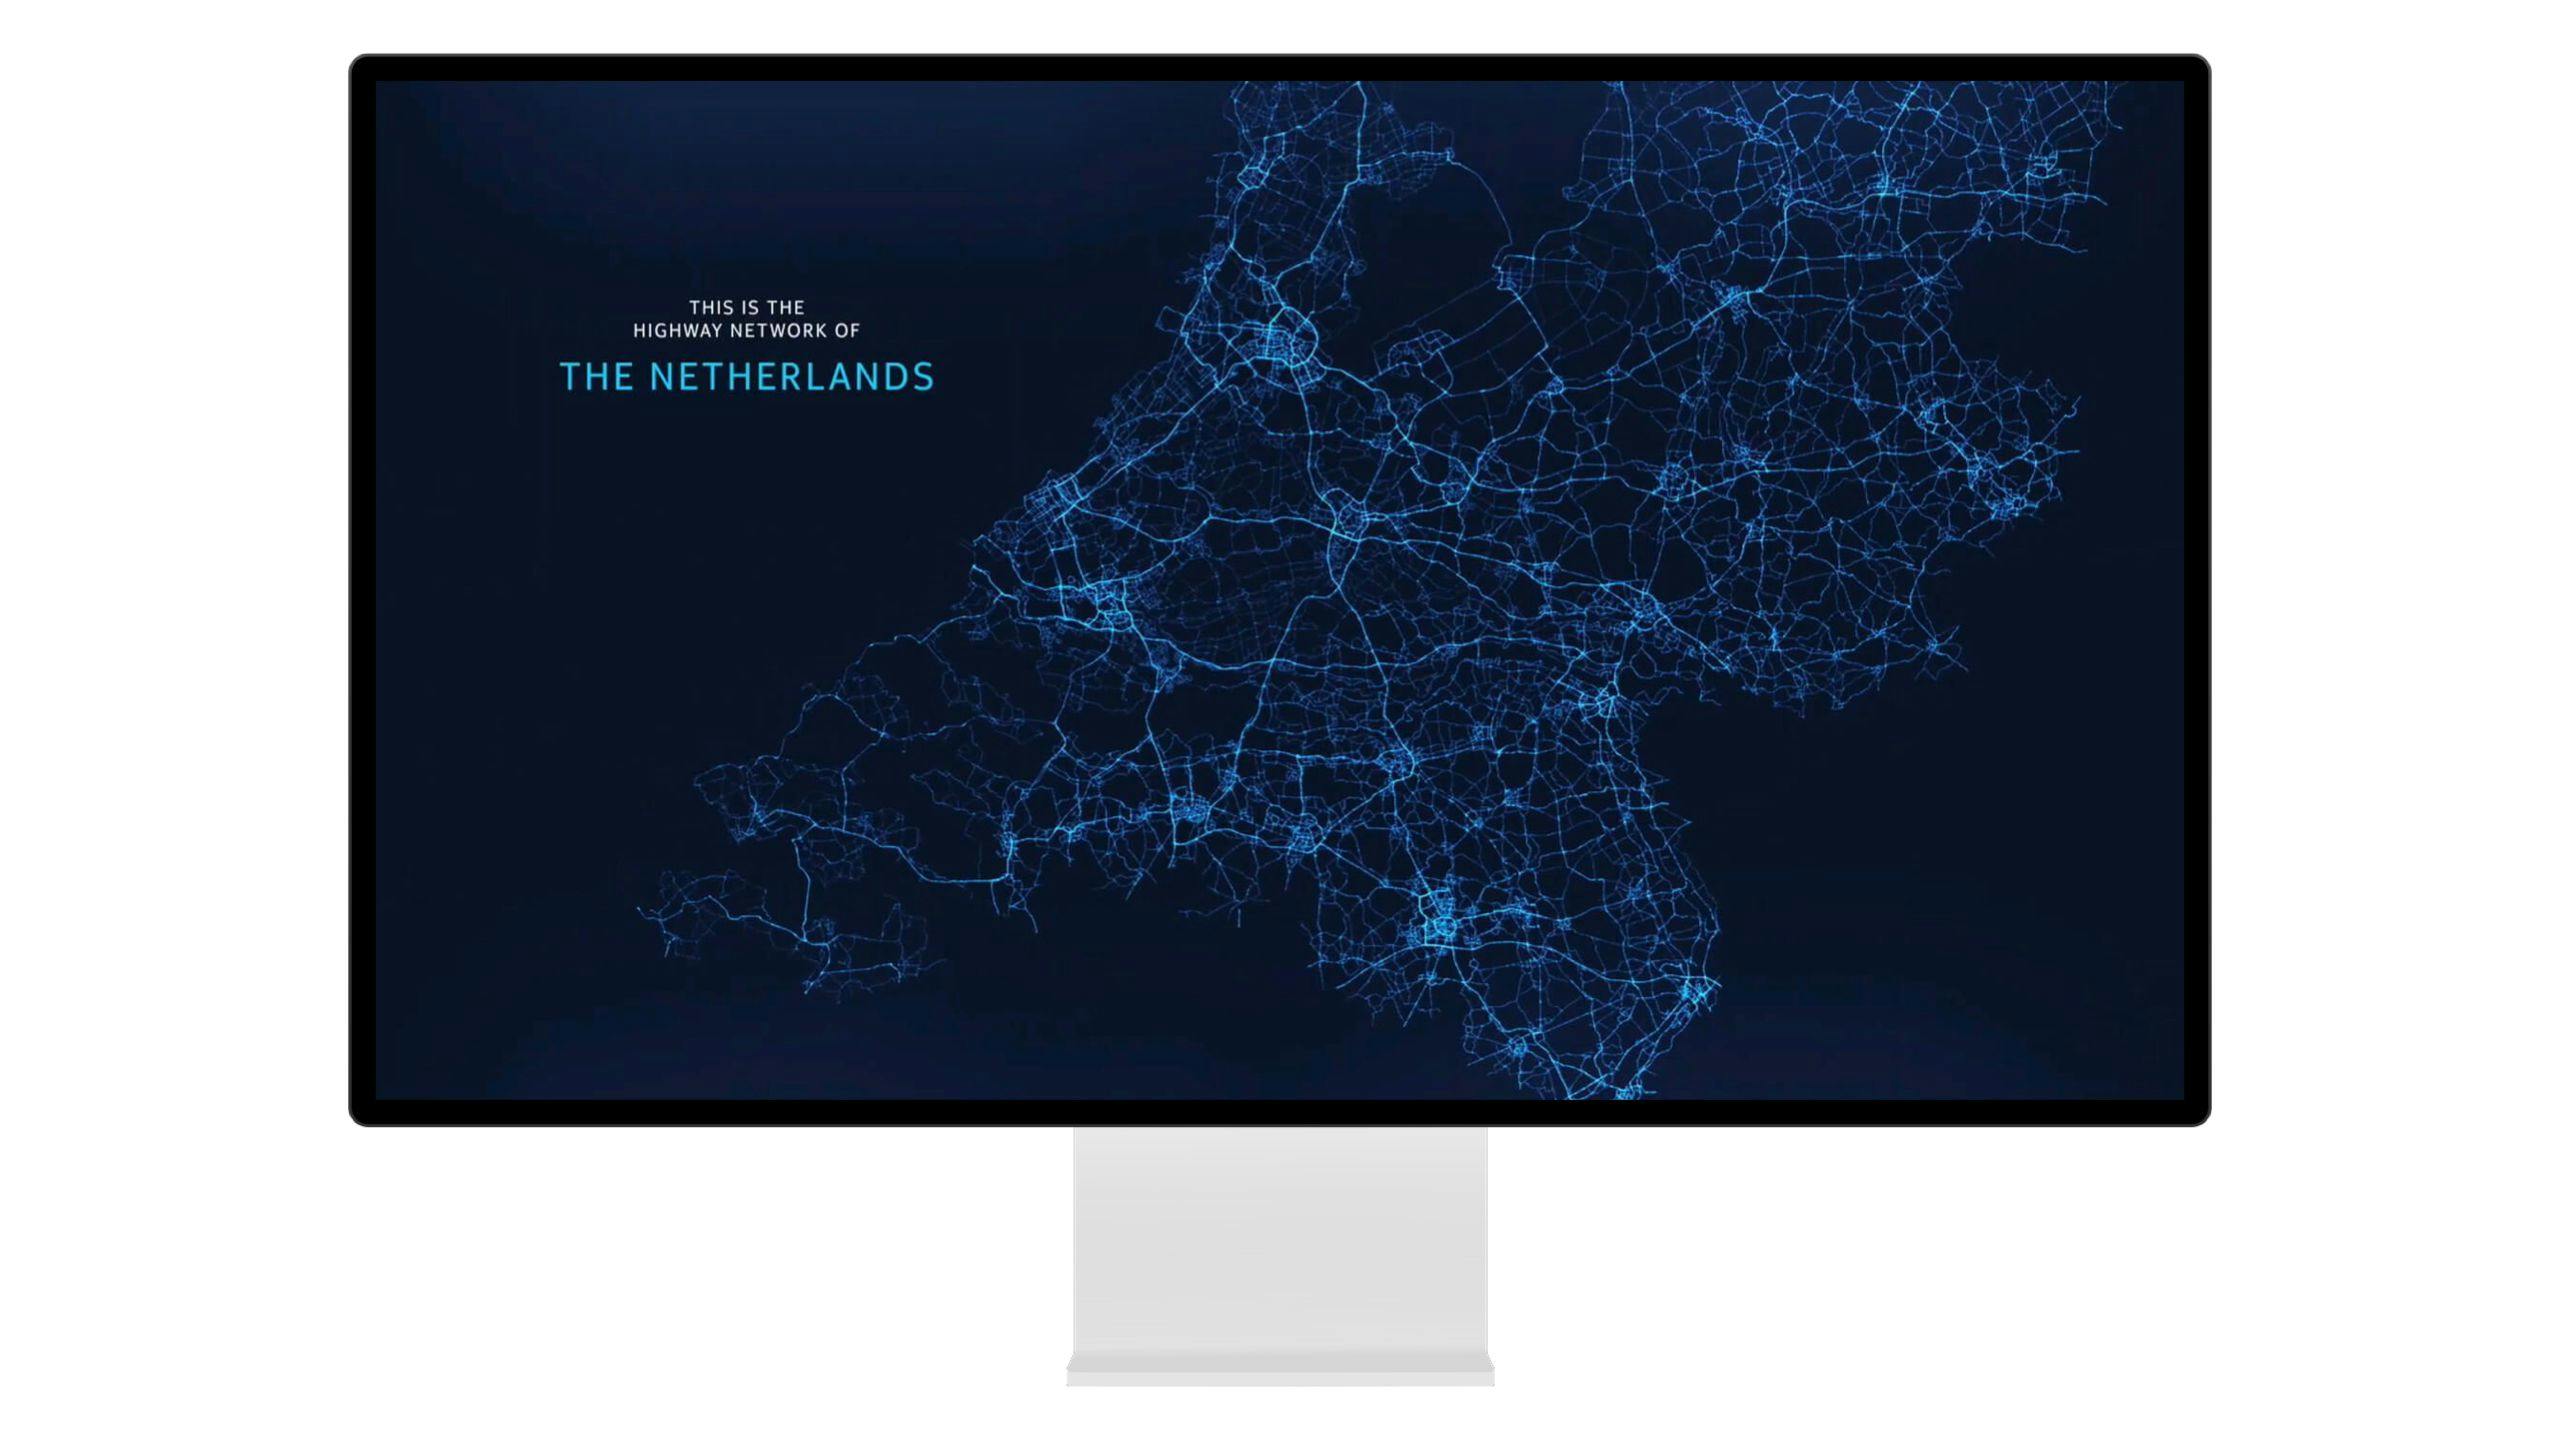
The HERE Traffic Analytics suite of data products provides business and government clients insights into what happens on roadways. It helps them make informed decisions, for example, on future traffic flow management, and improving road network performance.
CLEVER°FRANKE was asked to create a demo to feature all the Traffic Analytics products. Our challenge was to translate HERE Traffic Analytics data into an engaging visualization that showcases its capabilities and possibilities.
Value delivered
Showing the market value of a dataset and presenting possibilities within data, which inspire clients and demonstrate a range of practical applications of the suite.
Background
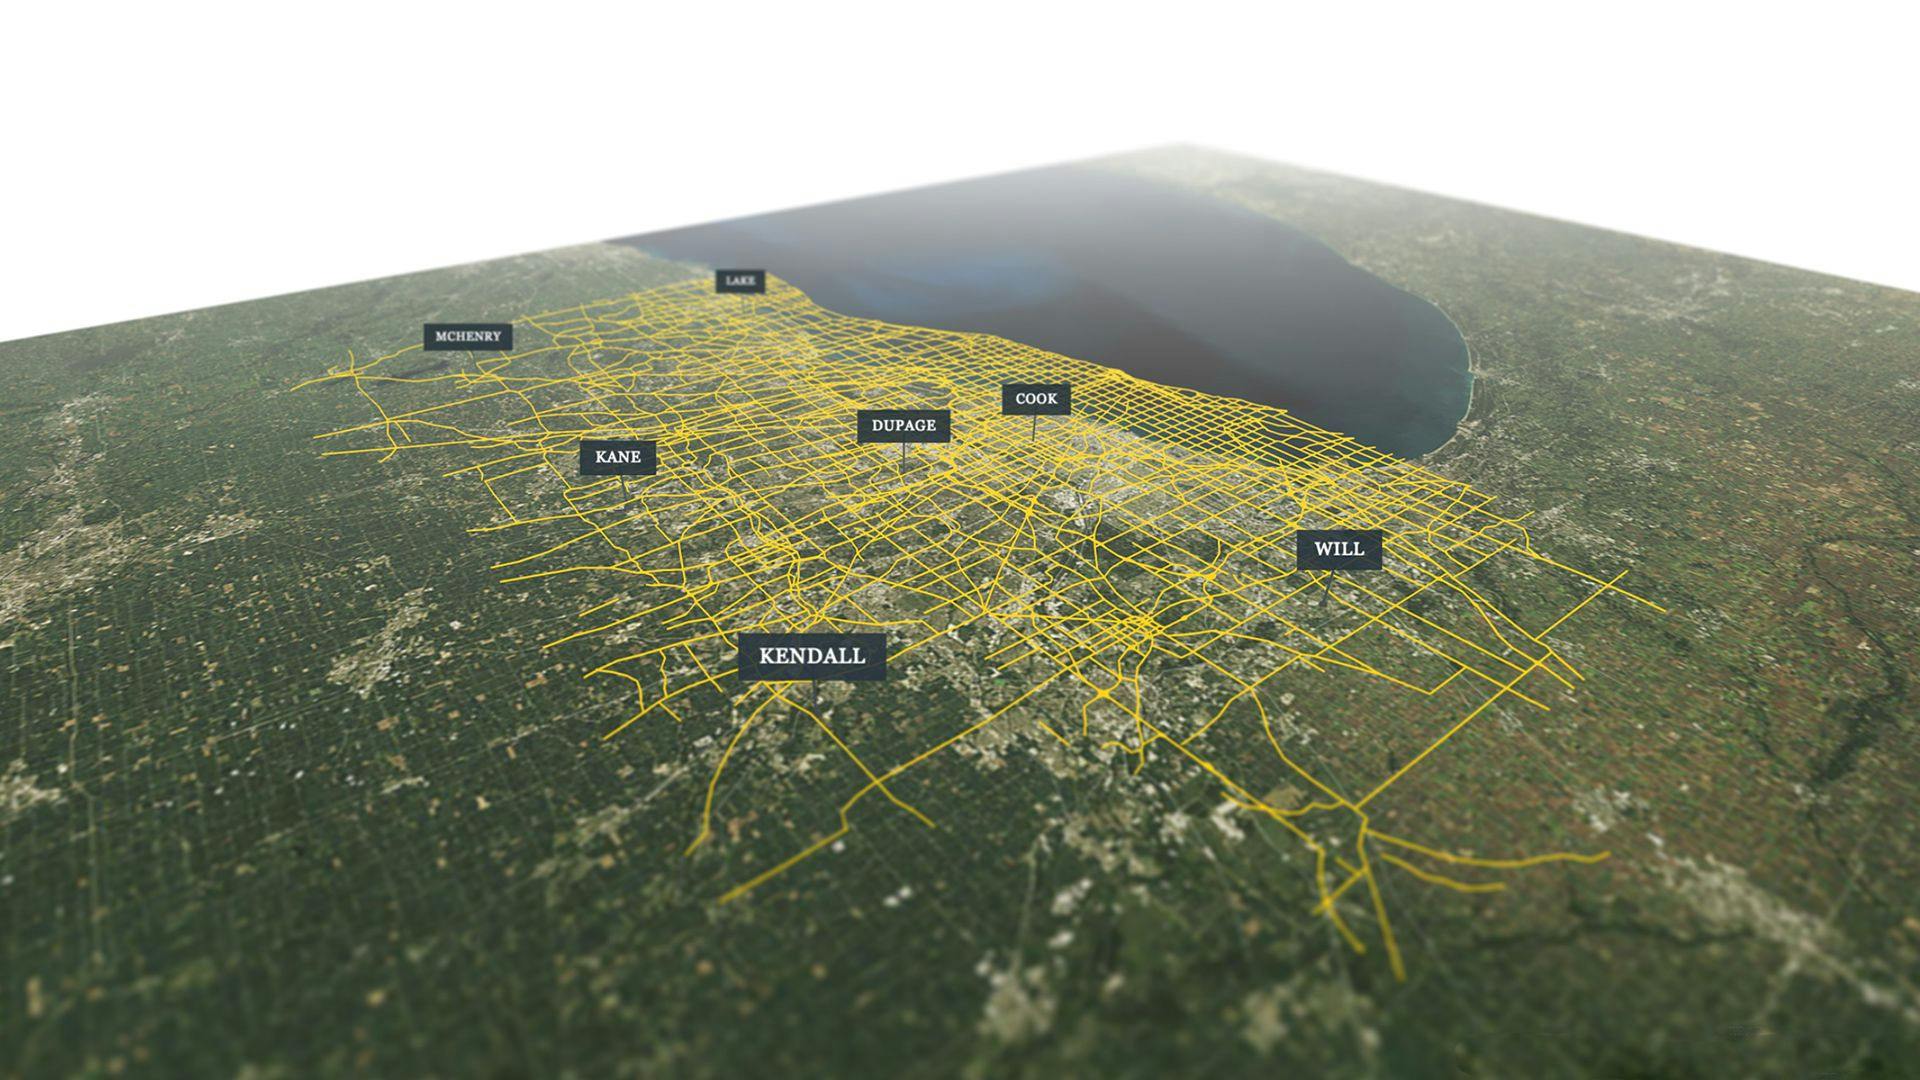
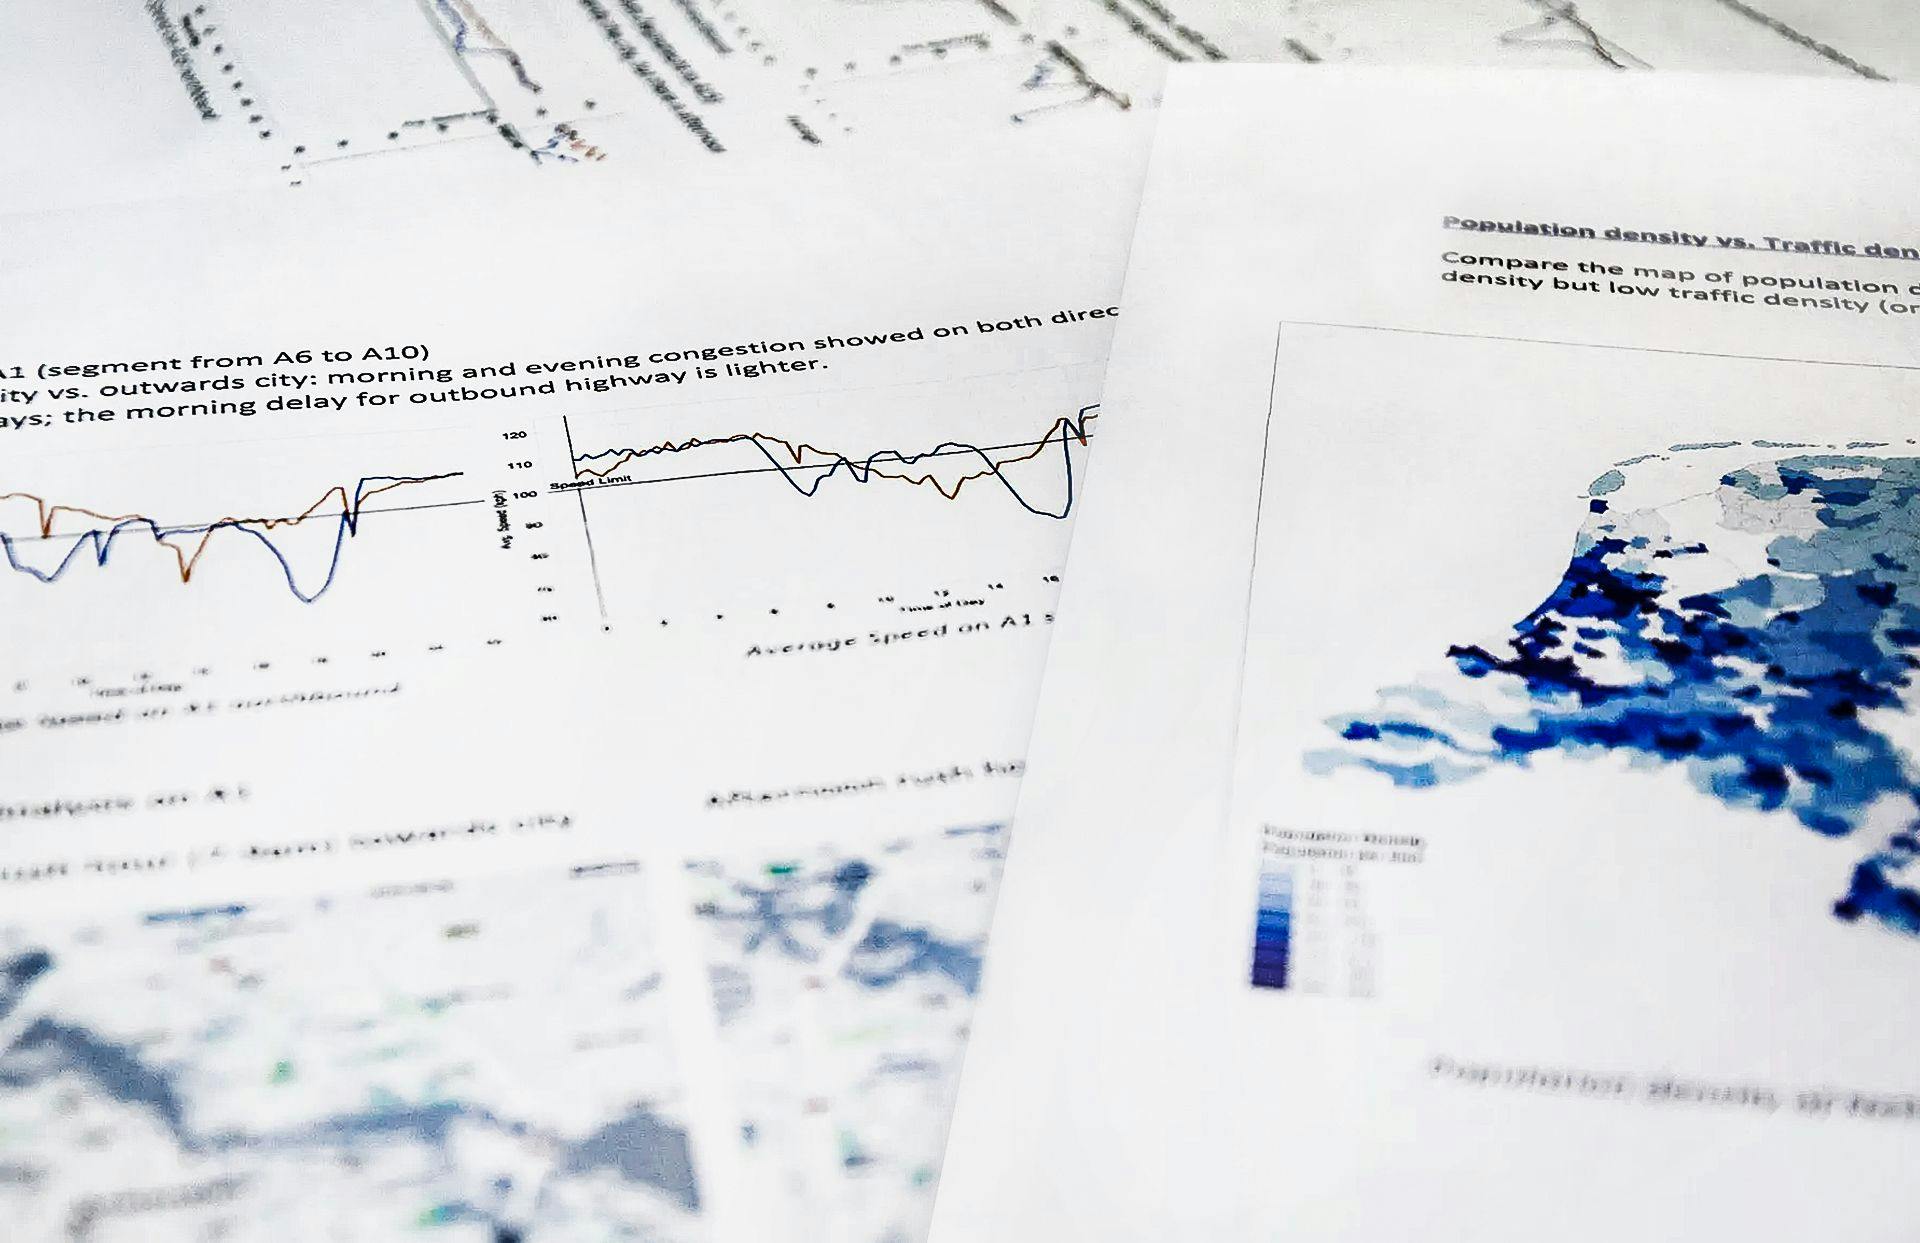
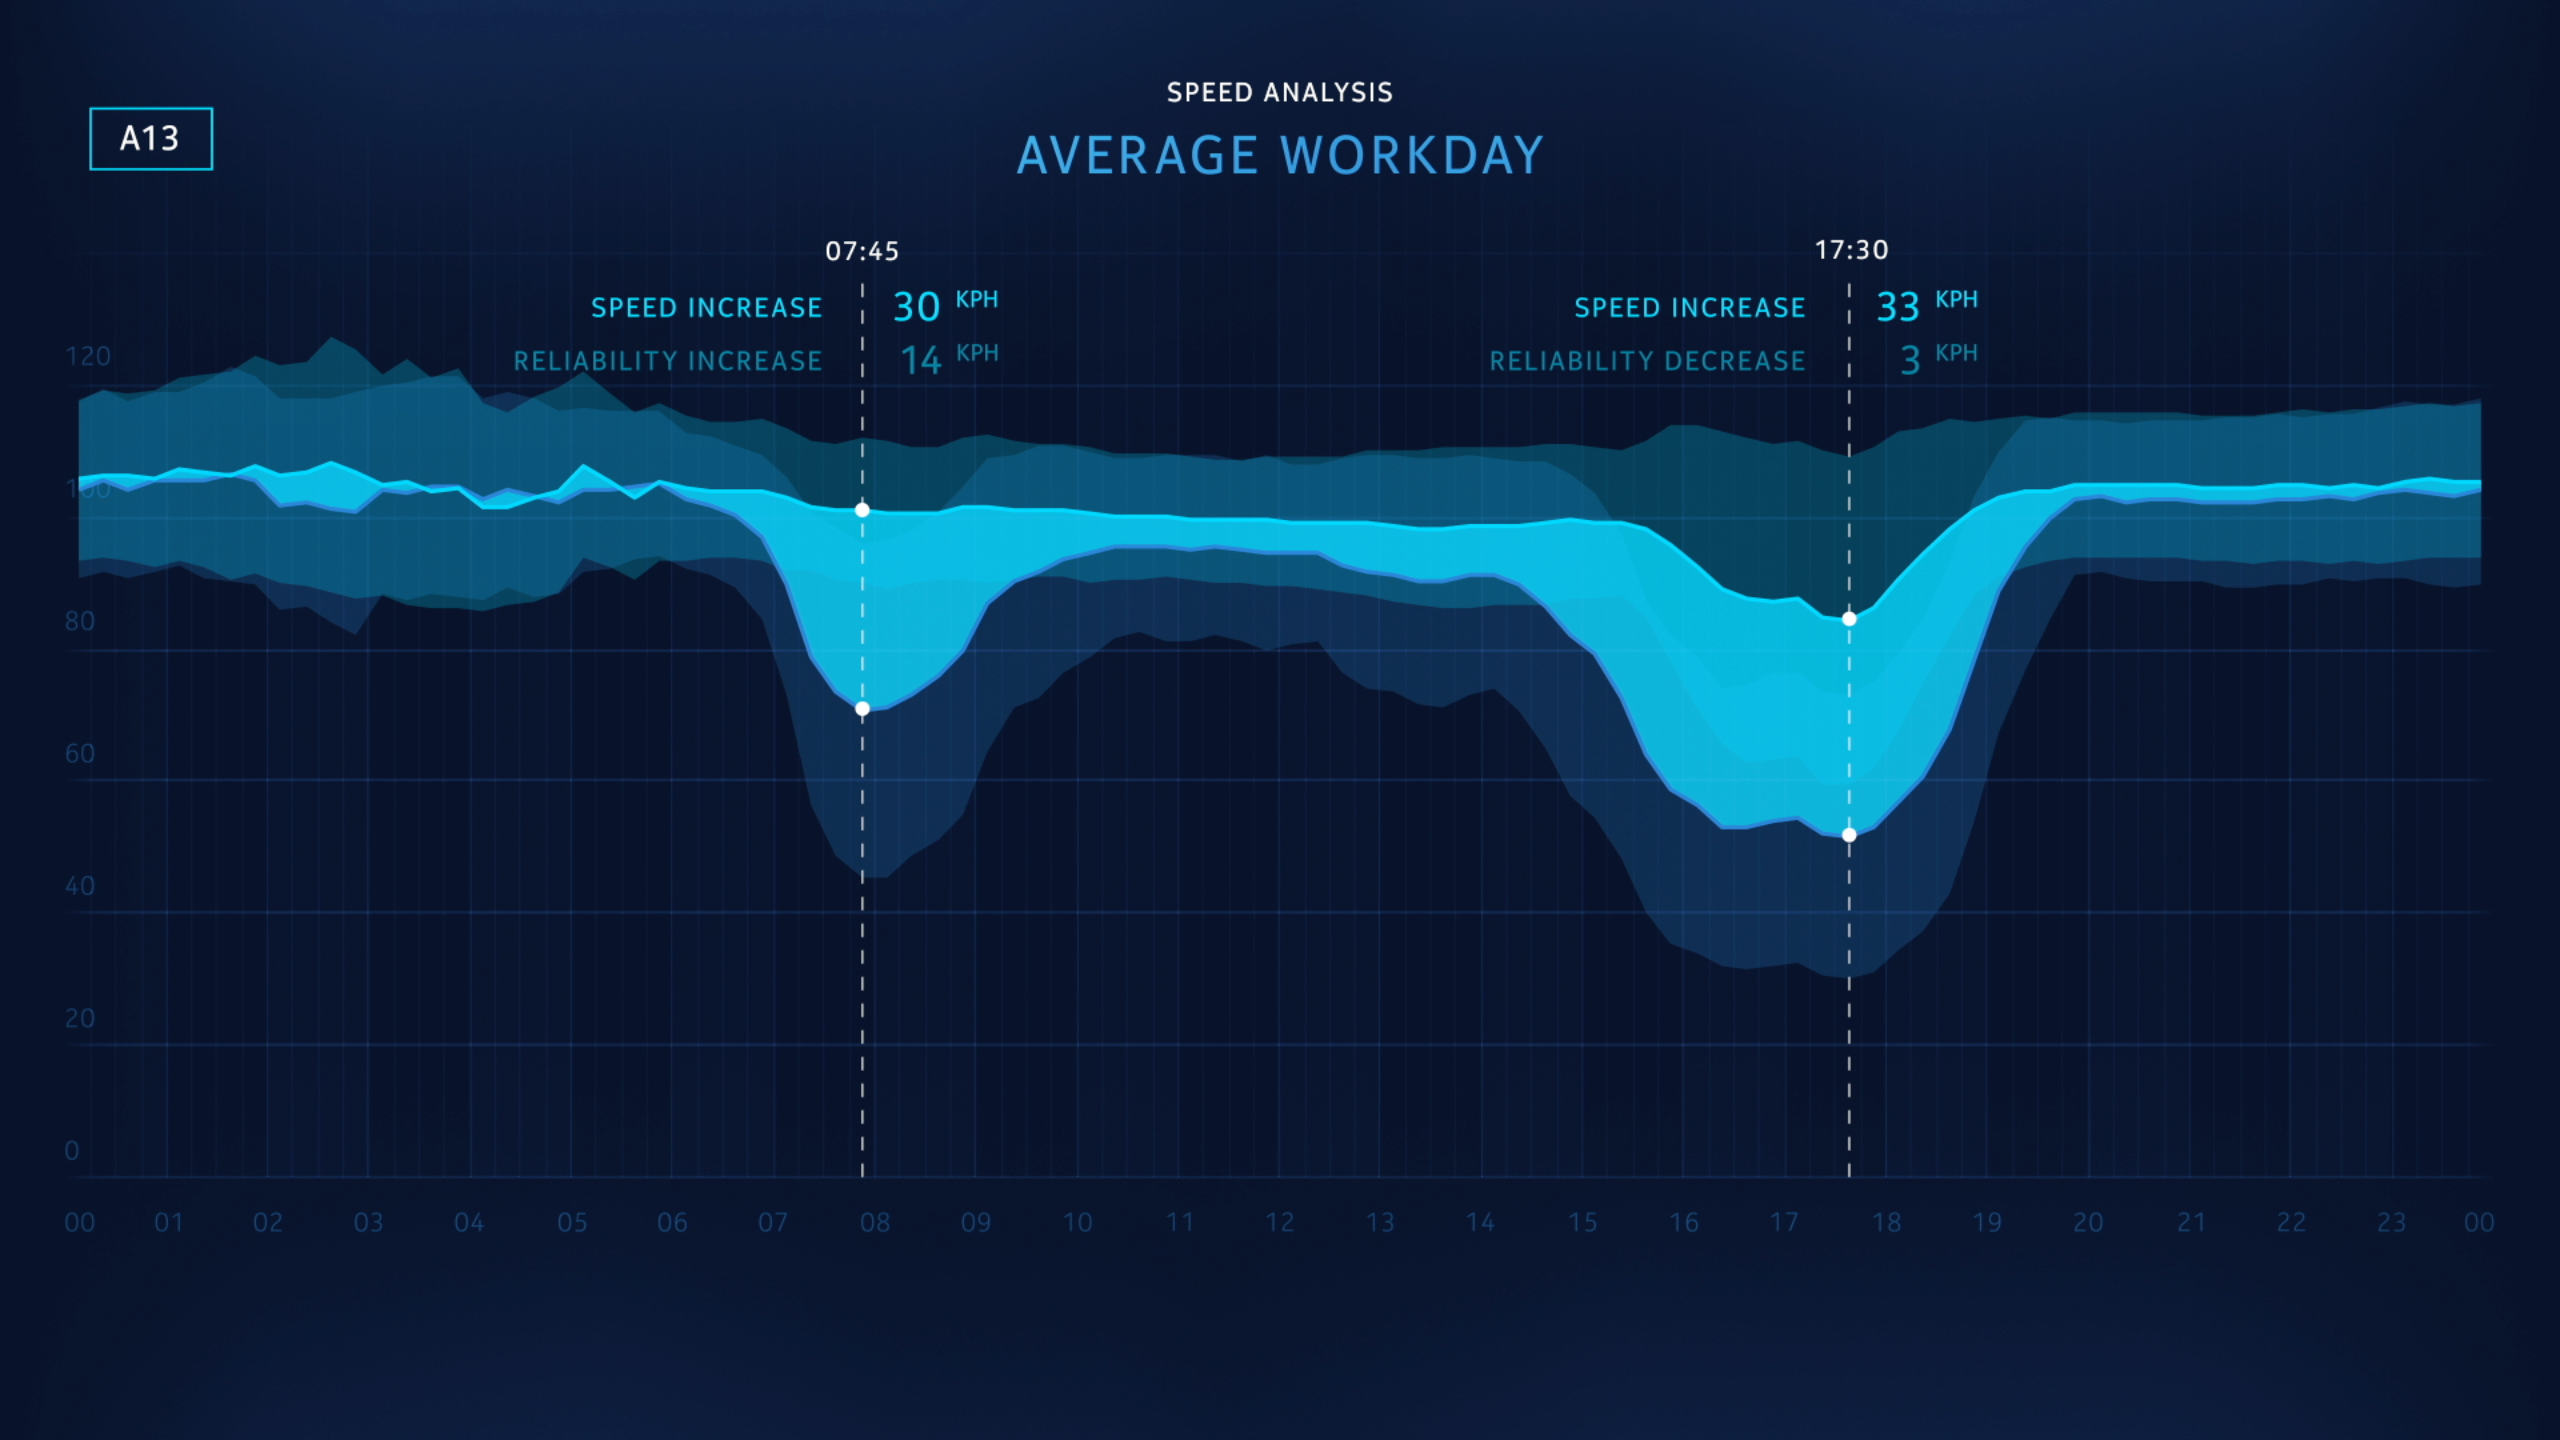
Together with HERE’s data scientists, we explored and analyzed traffic data sets to find hidden patterns and insights that demonstrate to the power of HERE's data products. For example, based on speed data we were able to show significant drops in travel times because of roadworks and before-and-after scenario’s
It was these types of insights that formed the foundation of our interactive experience and drove the overall narrative. Guiding a professional audience such as government officials and traffic managers through various scenarios and insights helped them understand the power of HERE’s real-time insights.

Phases and toolkit items used
Design
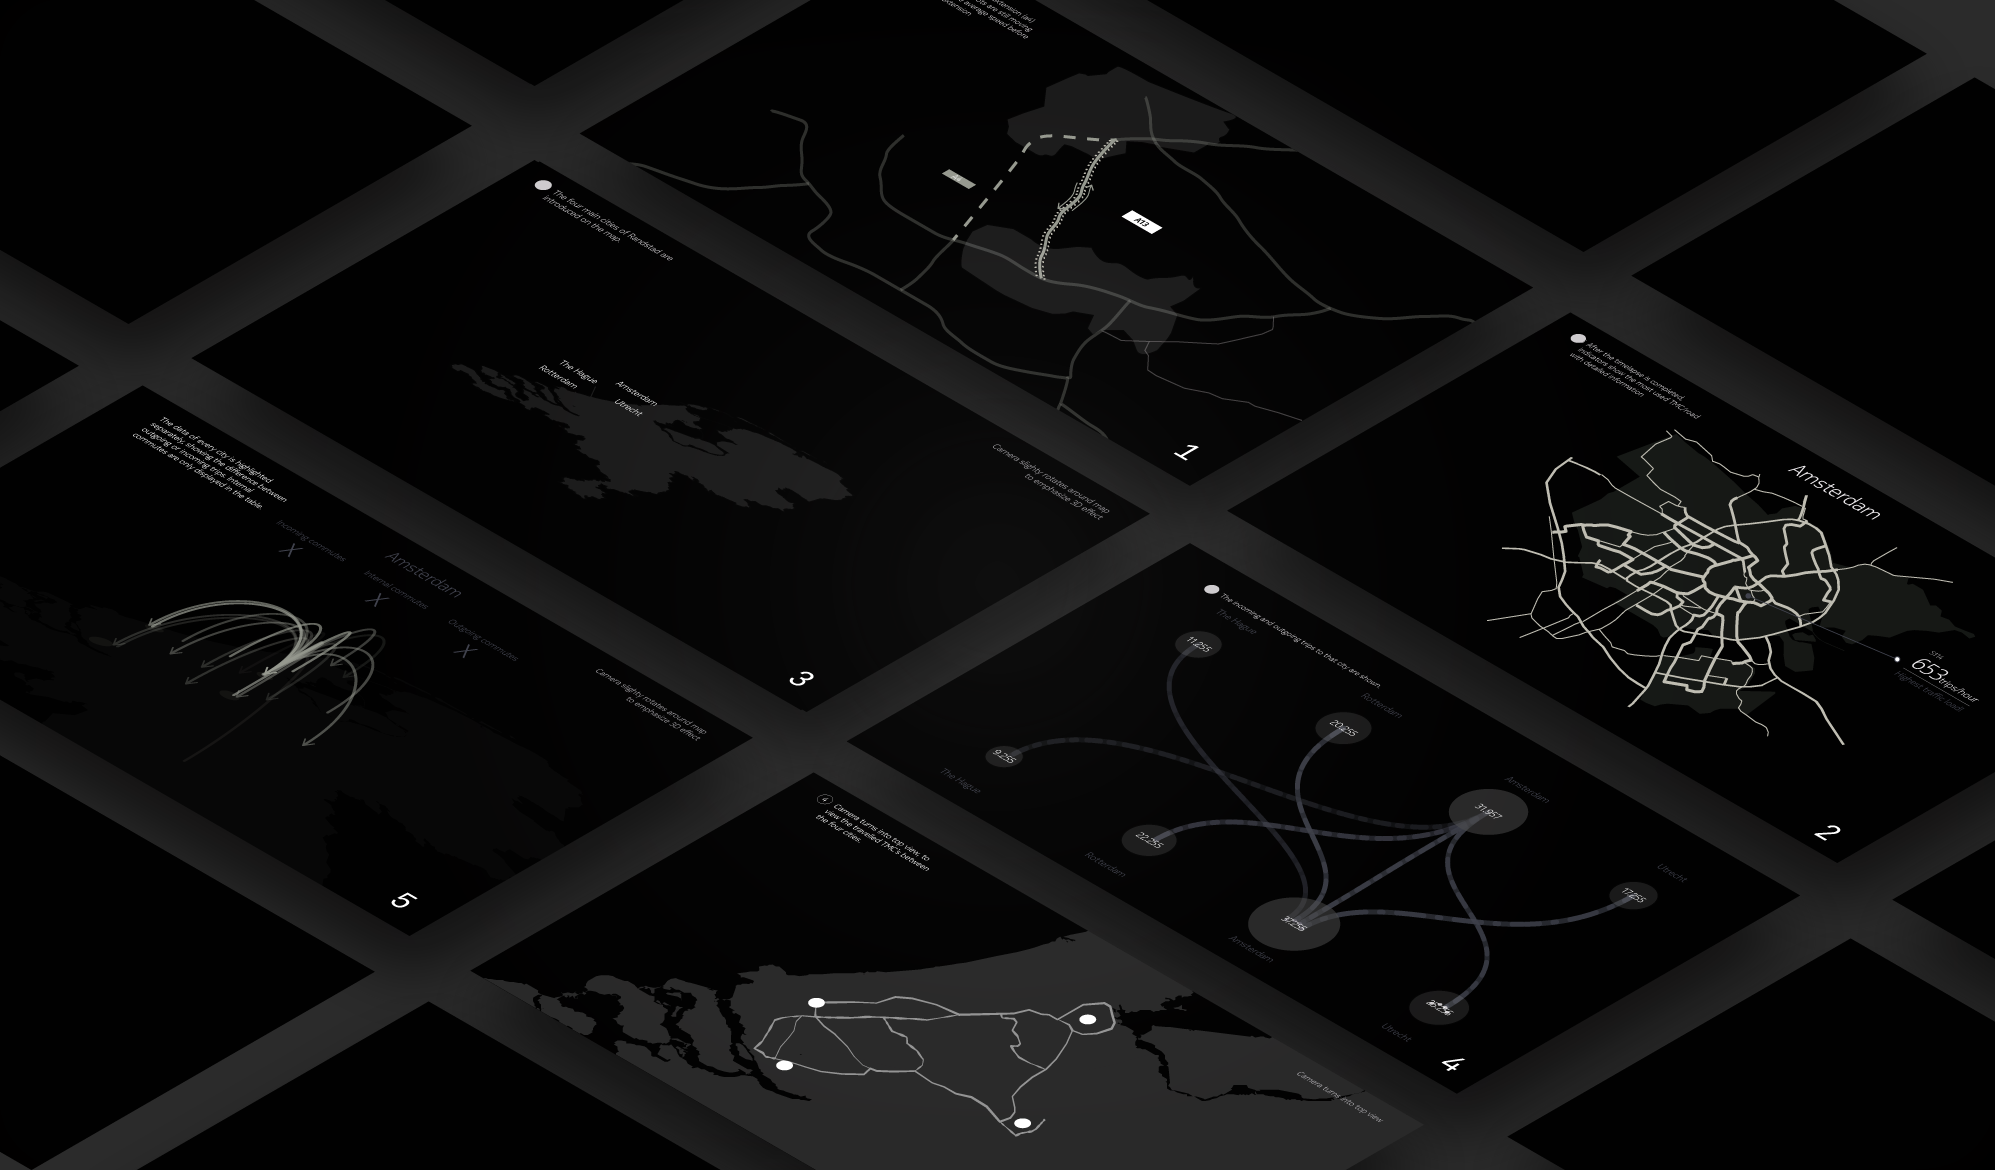
Storyboardcreation
With the outcome of our analysis as a guiding principle, we started to explore visualizations and scenarios to convey a meaningful storyline.
Visualstyle
Inspired by HERE’s identity, we created a visual style that provides a vibrant experience, but does not overrule the messaging.
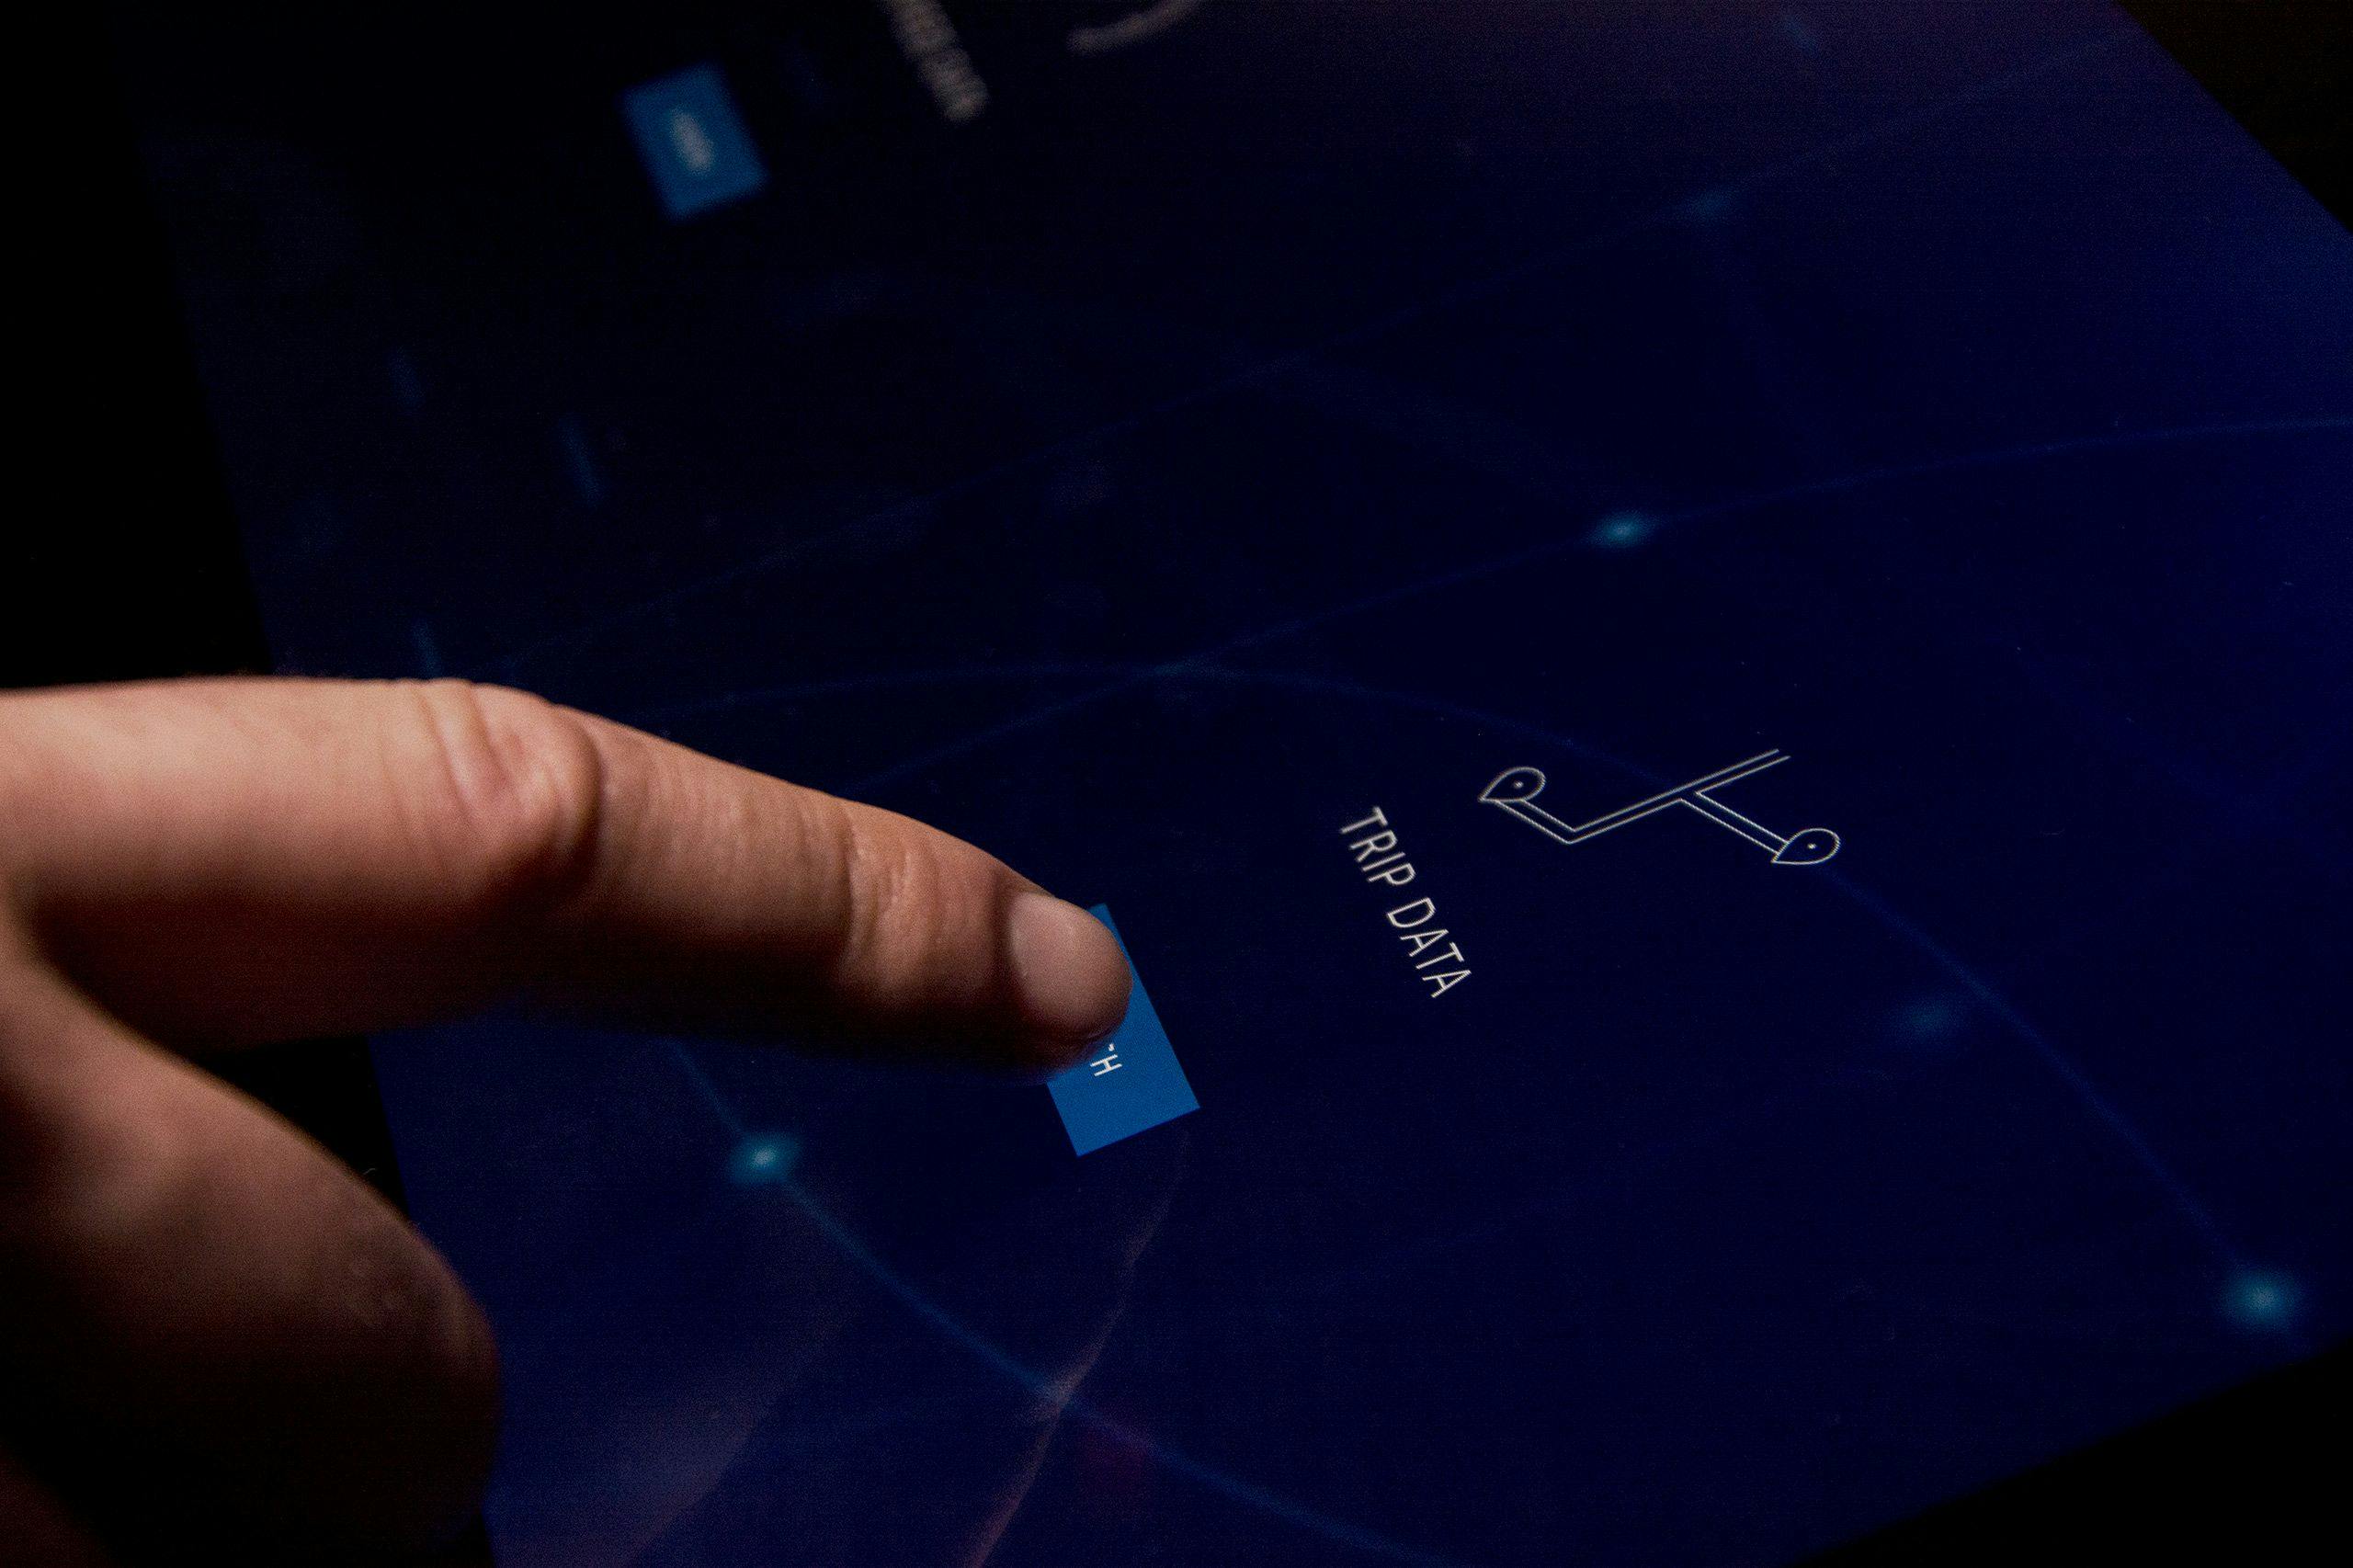
Application
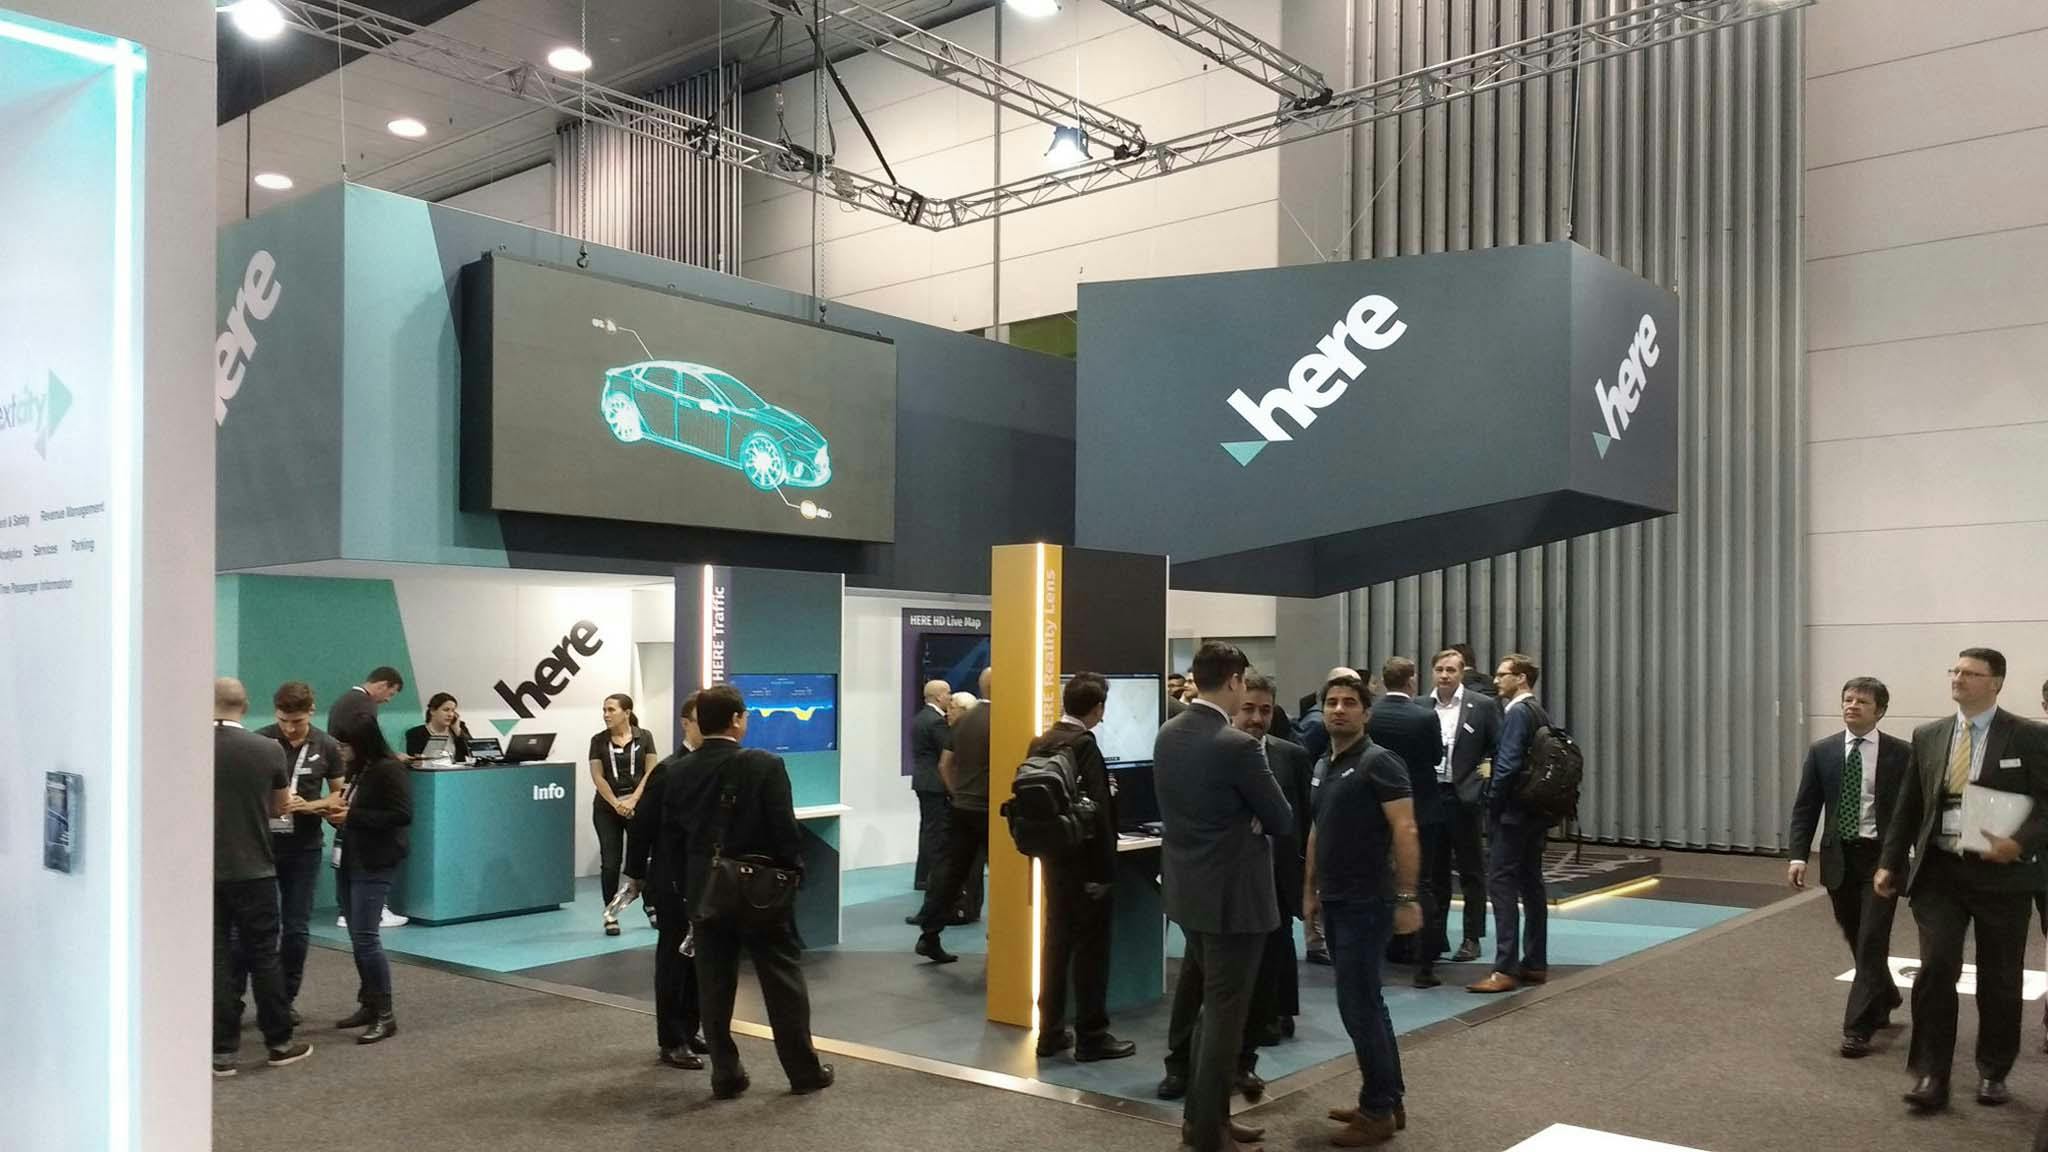
The interactive demo was developed into a stand-alone application that seamlessly guides the user in exploring different scenario's and visualizations. Without the need of staff or internet connection, the application allows vistors of trade shows to the experience the Traffic Analytics product suite at their own discretion.
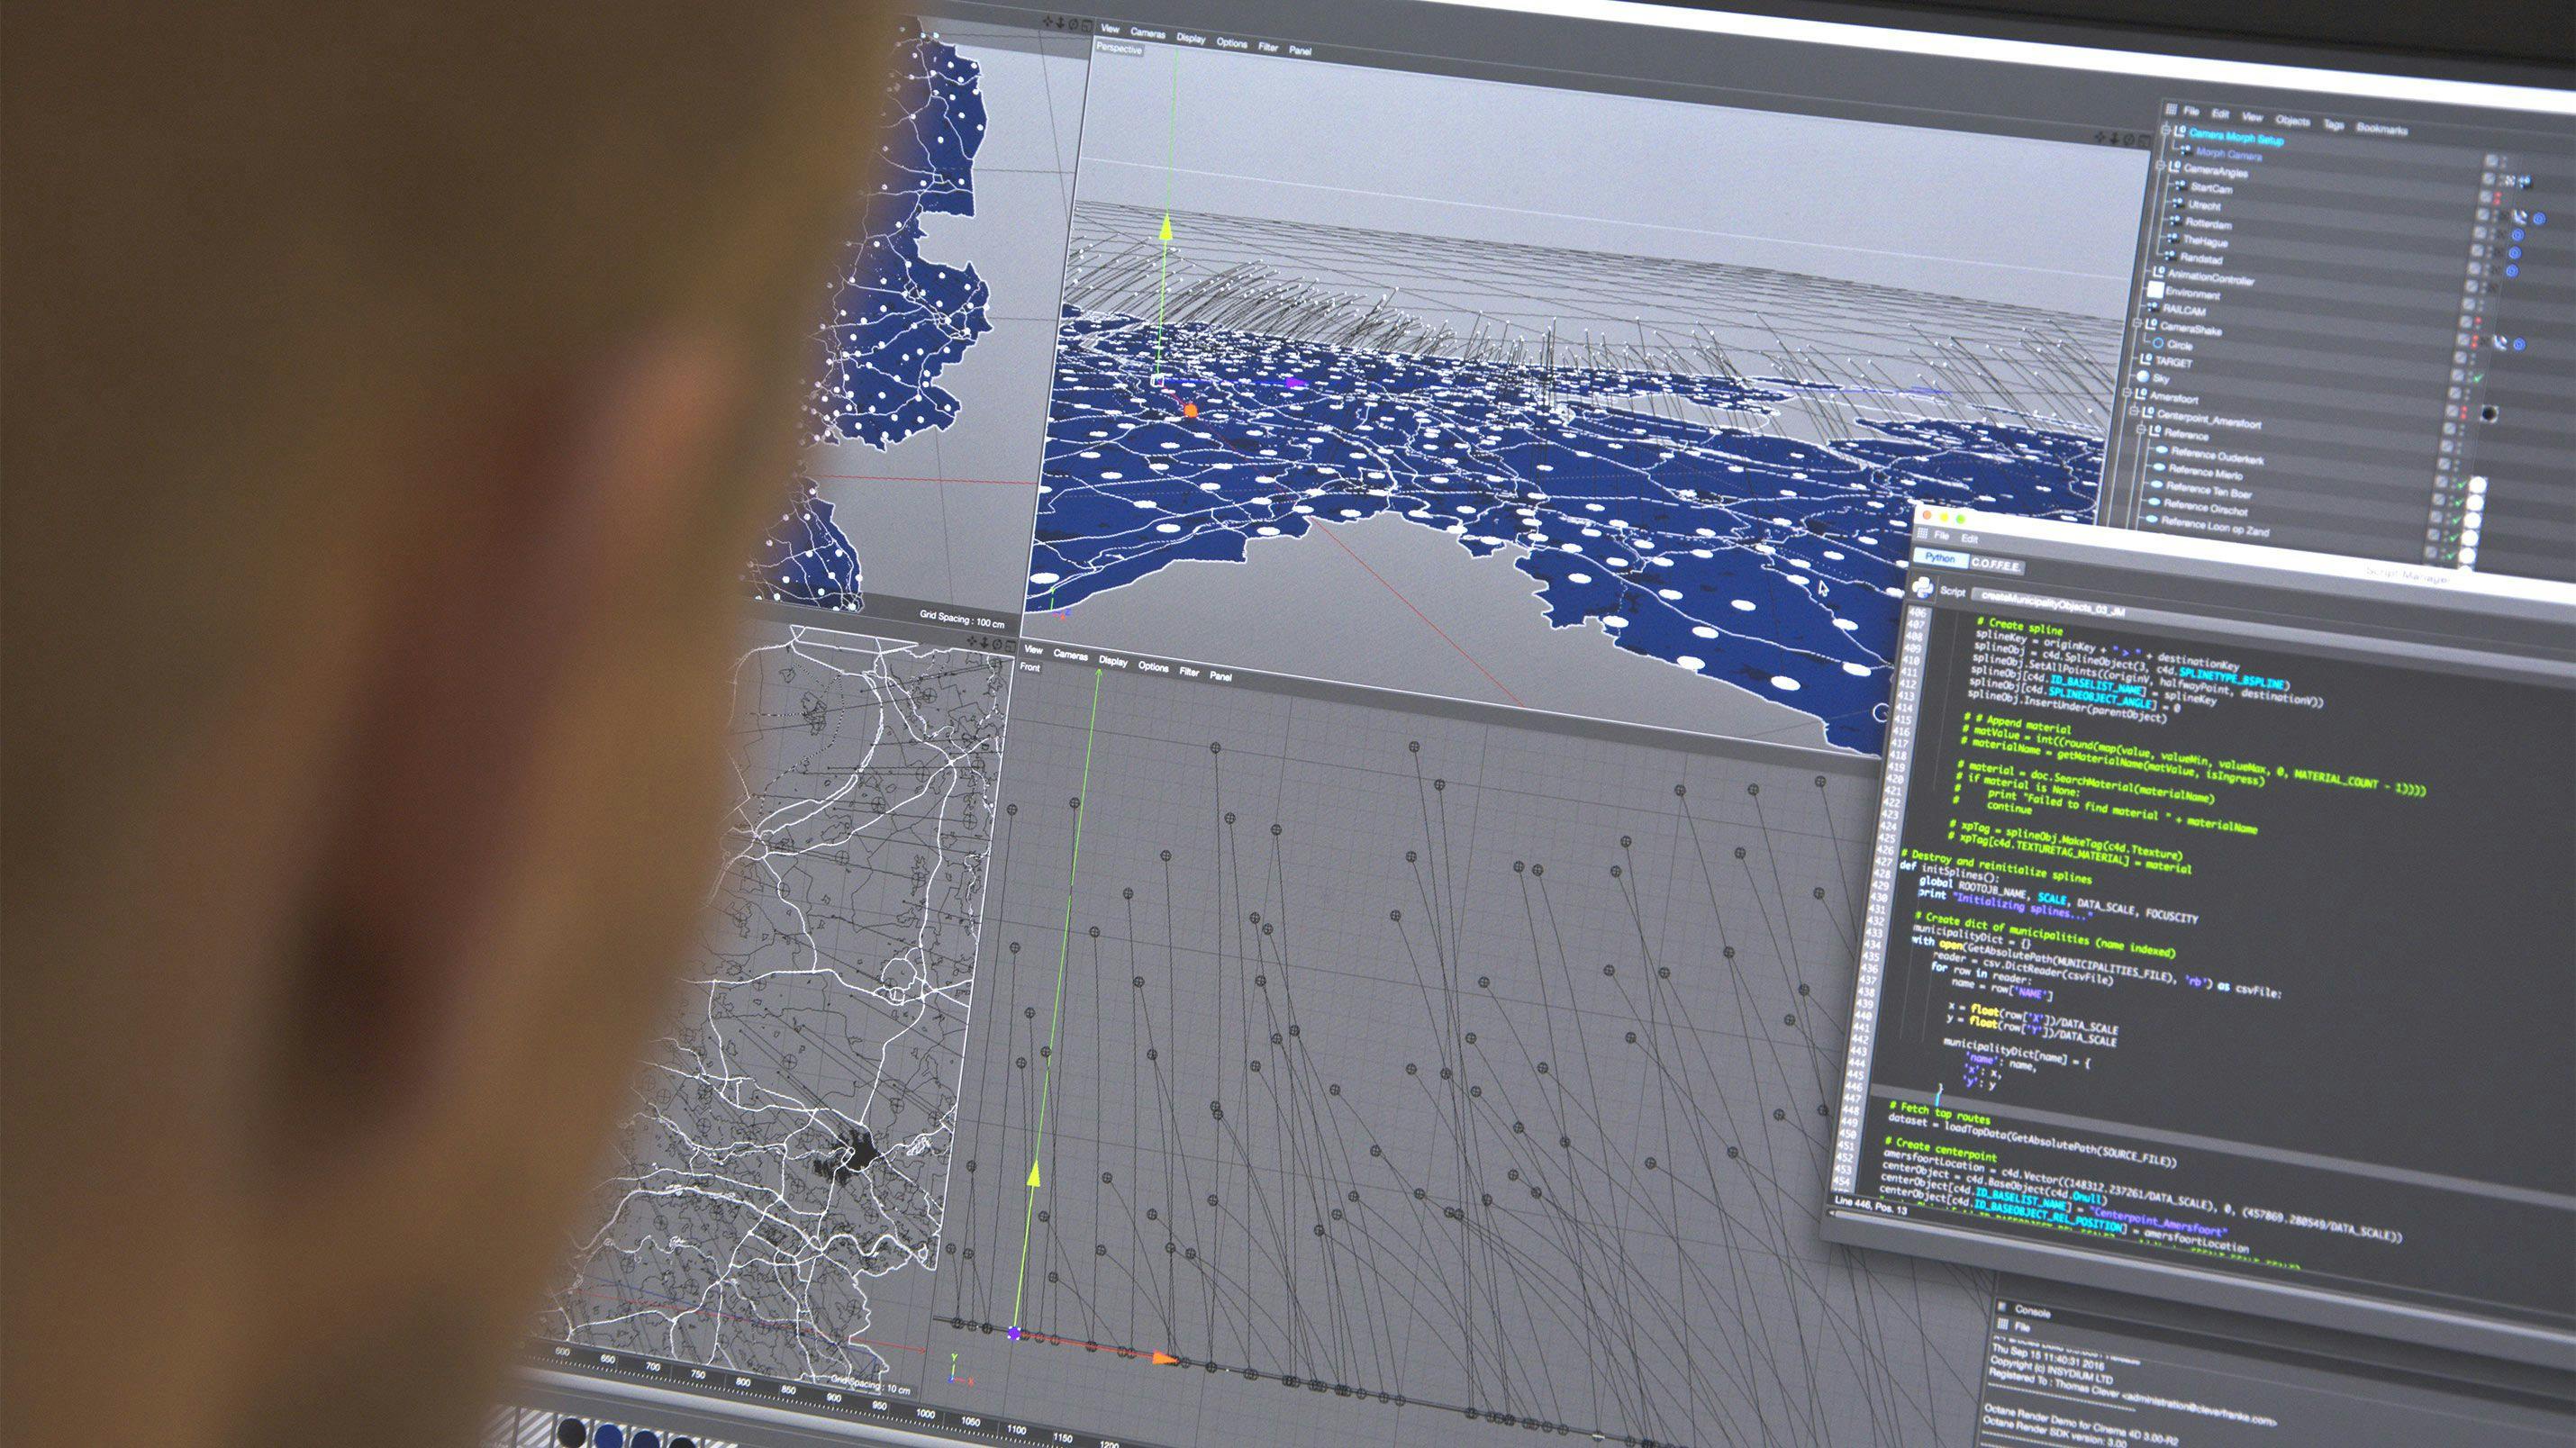
Data-drivendesign
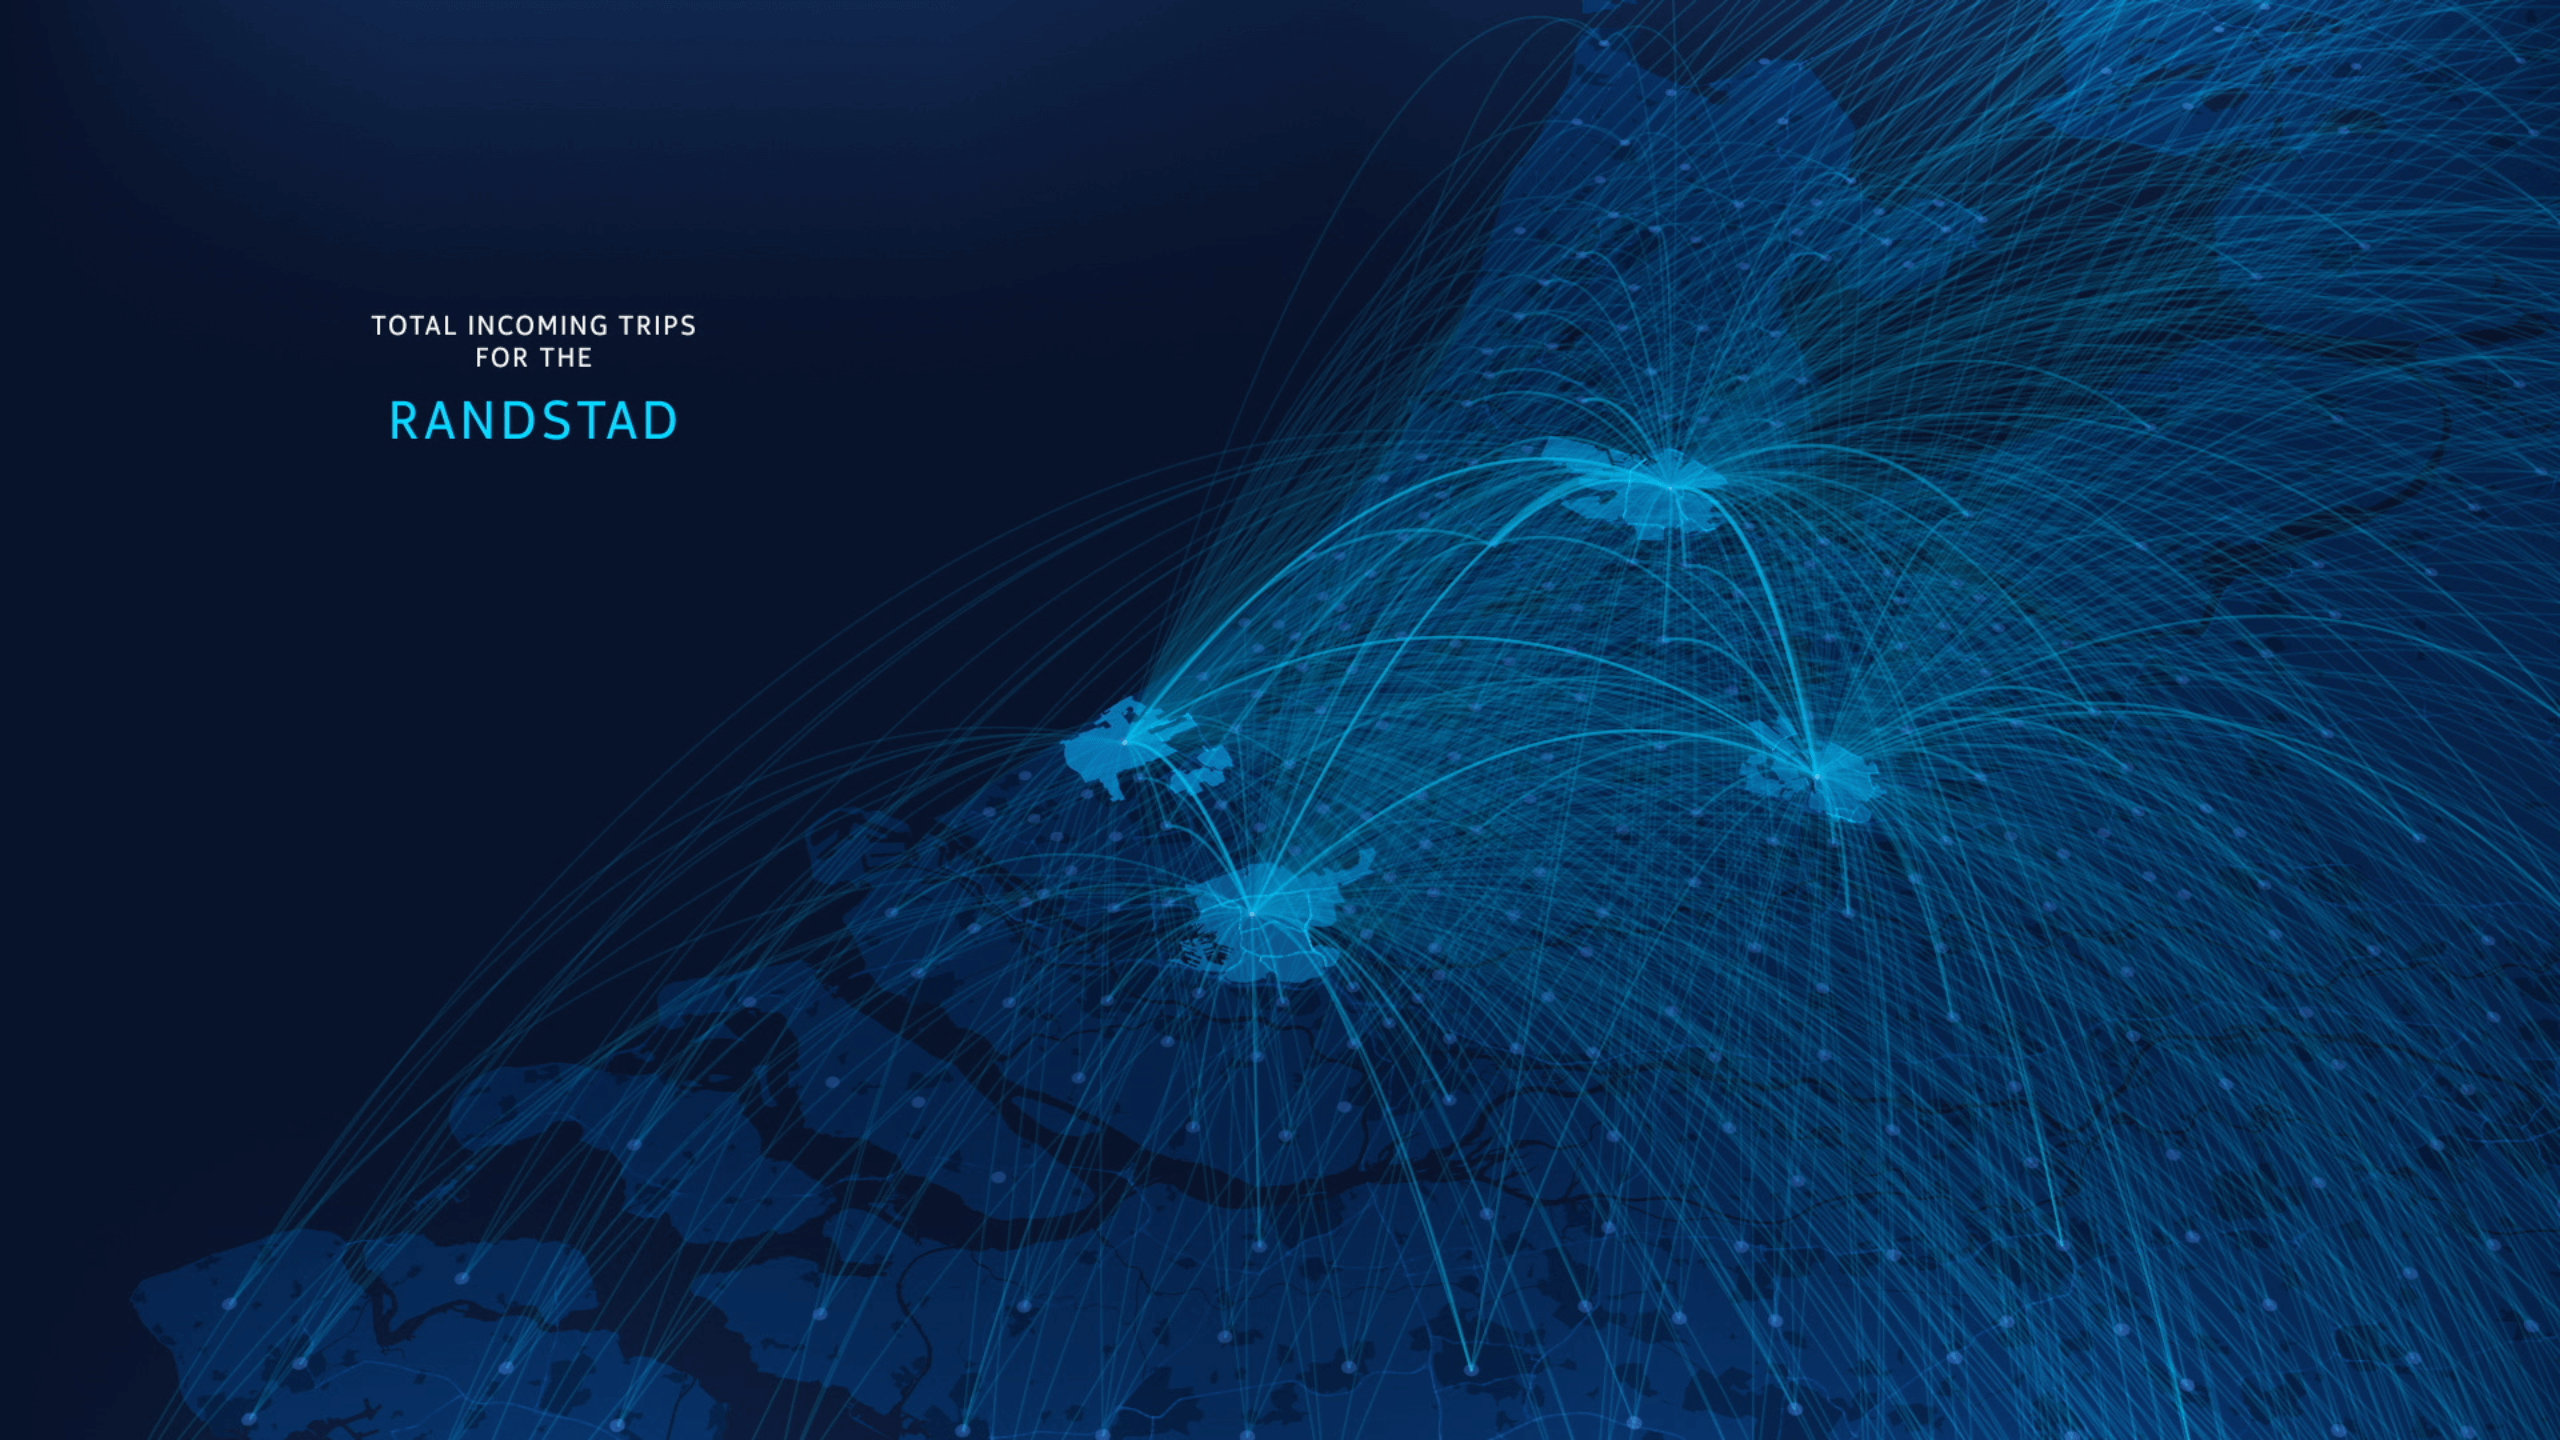
We transformed and supplemented client-supplied data into a format that could be easily processed by a 3D application using Python. Using this application, we generated and rendered animated objects based on the data that represented different scenarios, such as traffic routes and speed patterns over time. Likewise, we used the same data to create a data-driven system that generated all the 2D data visualizations accompanying the 3D renders.
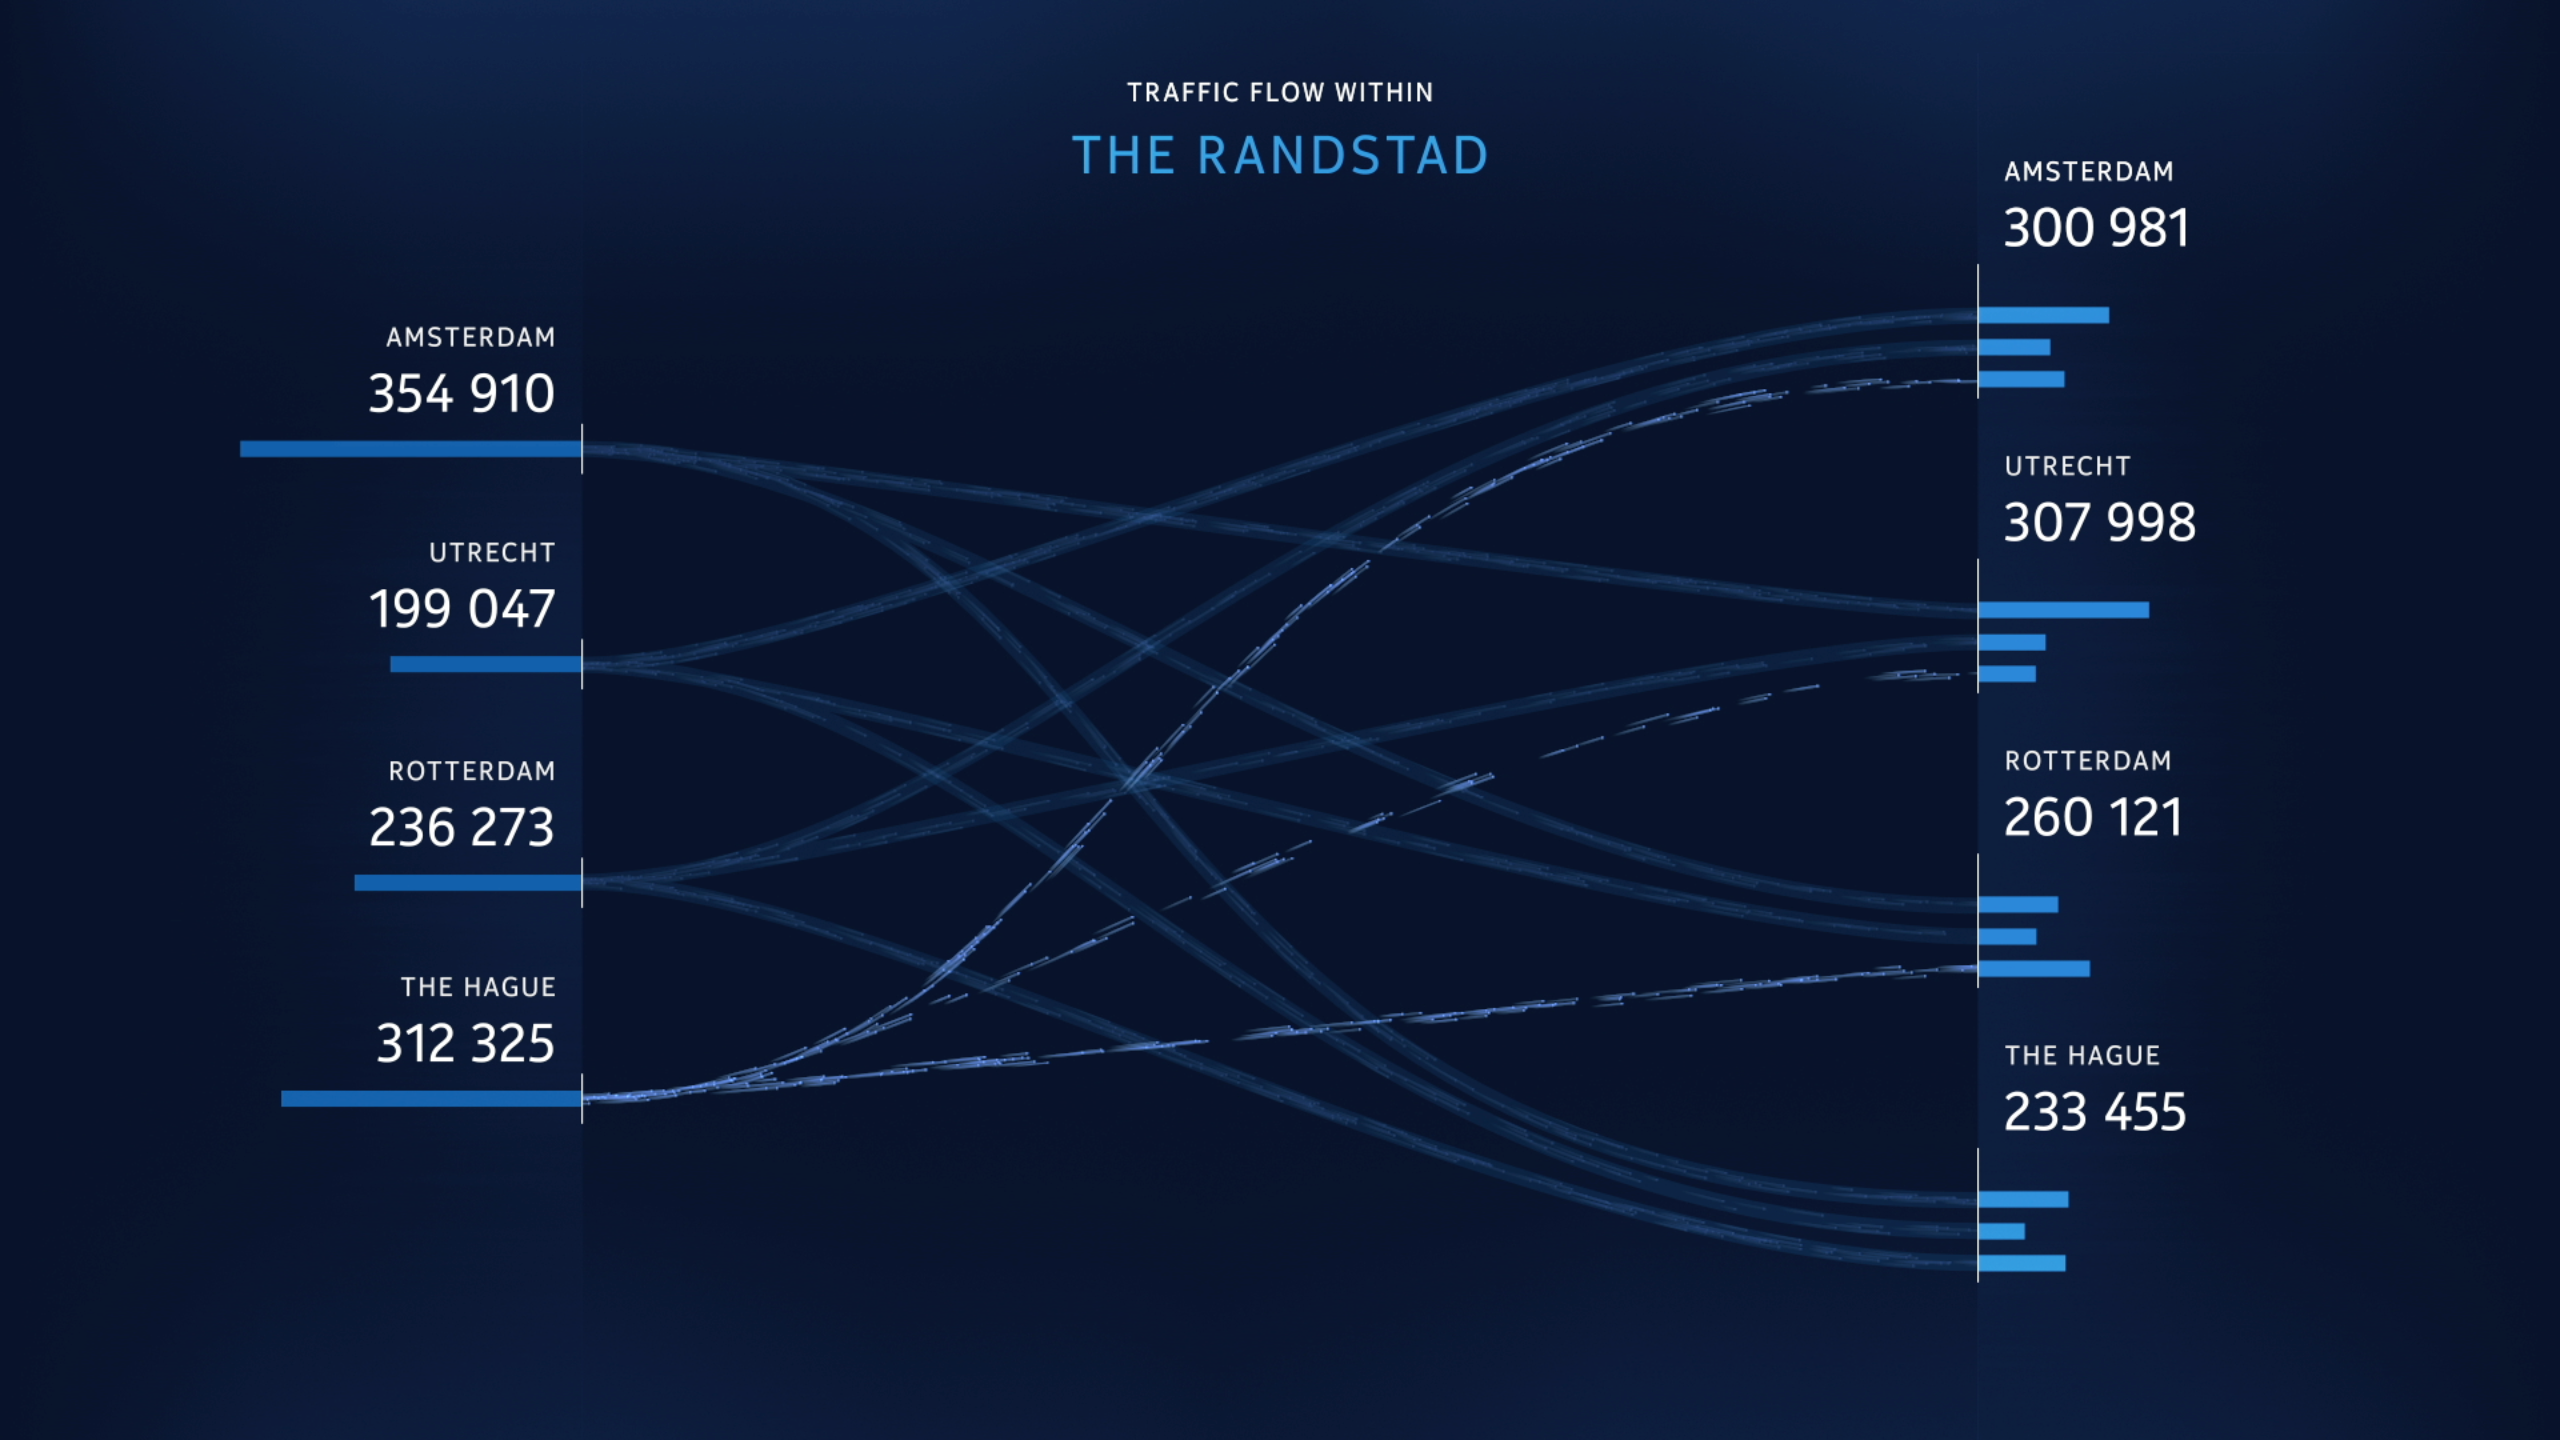
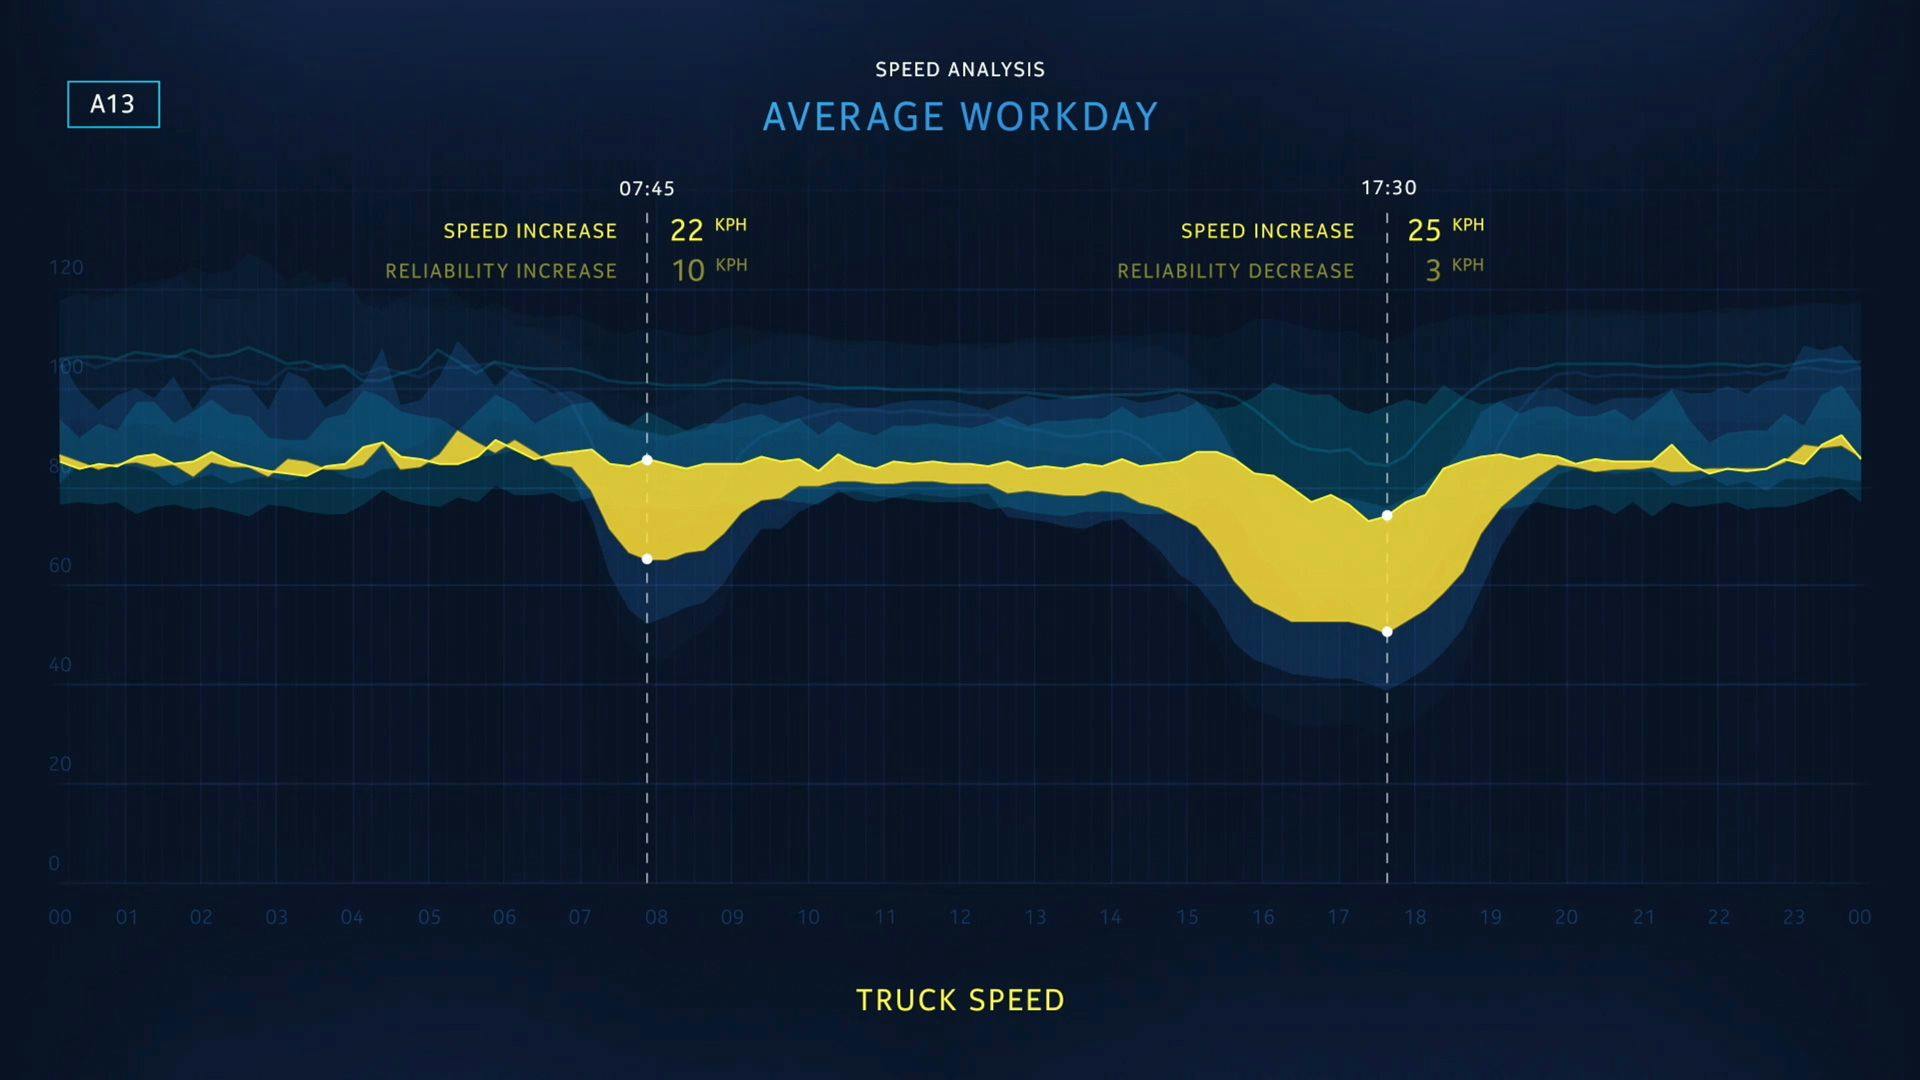
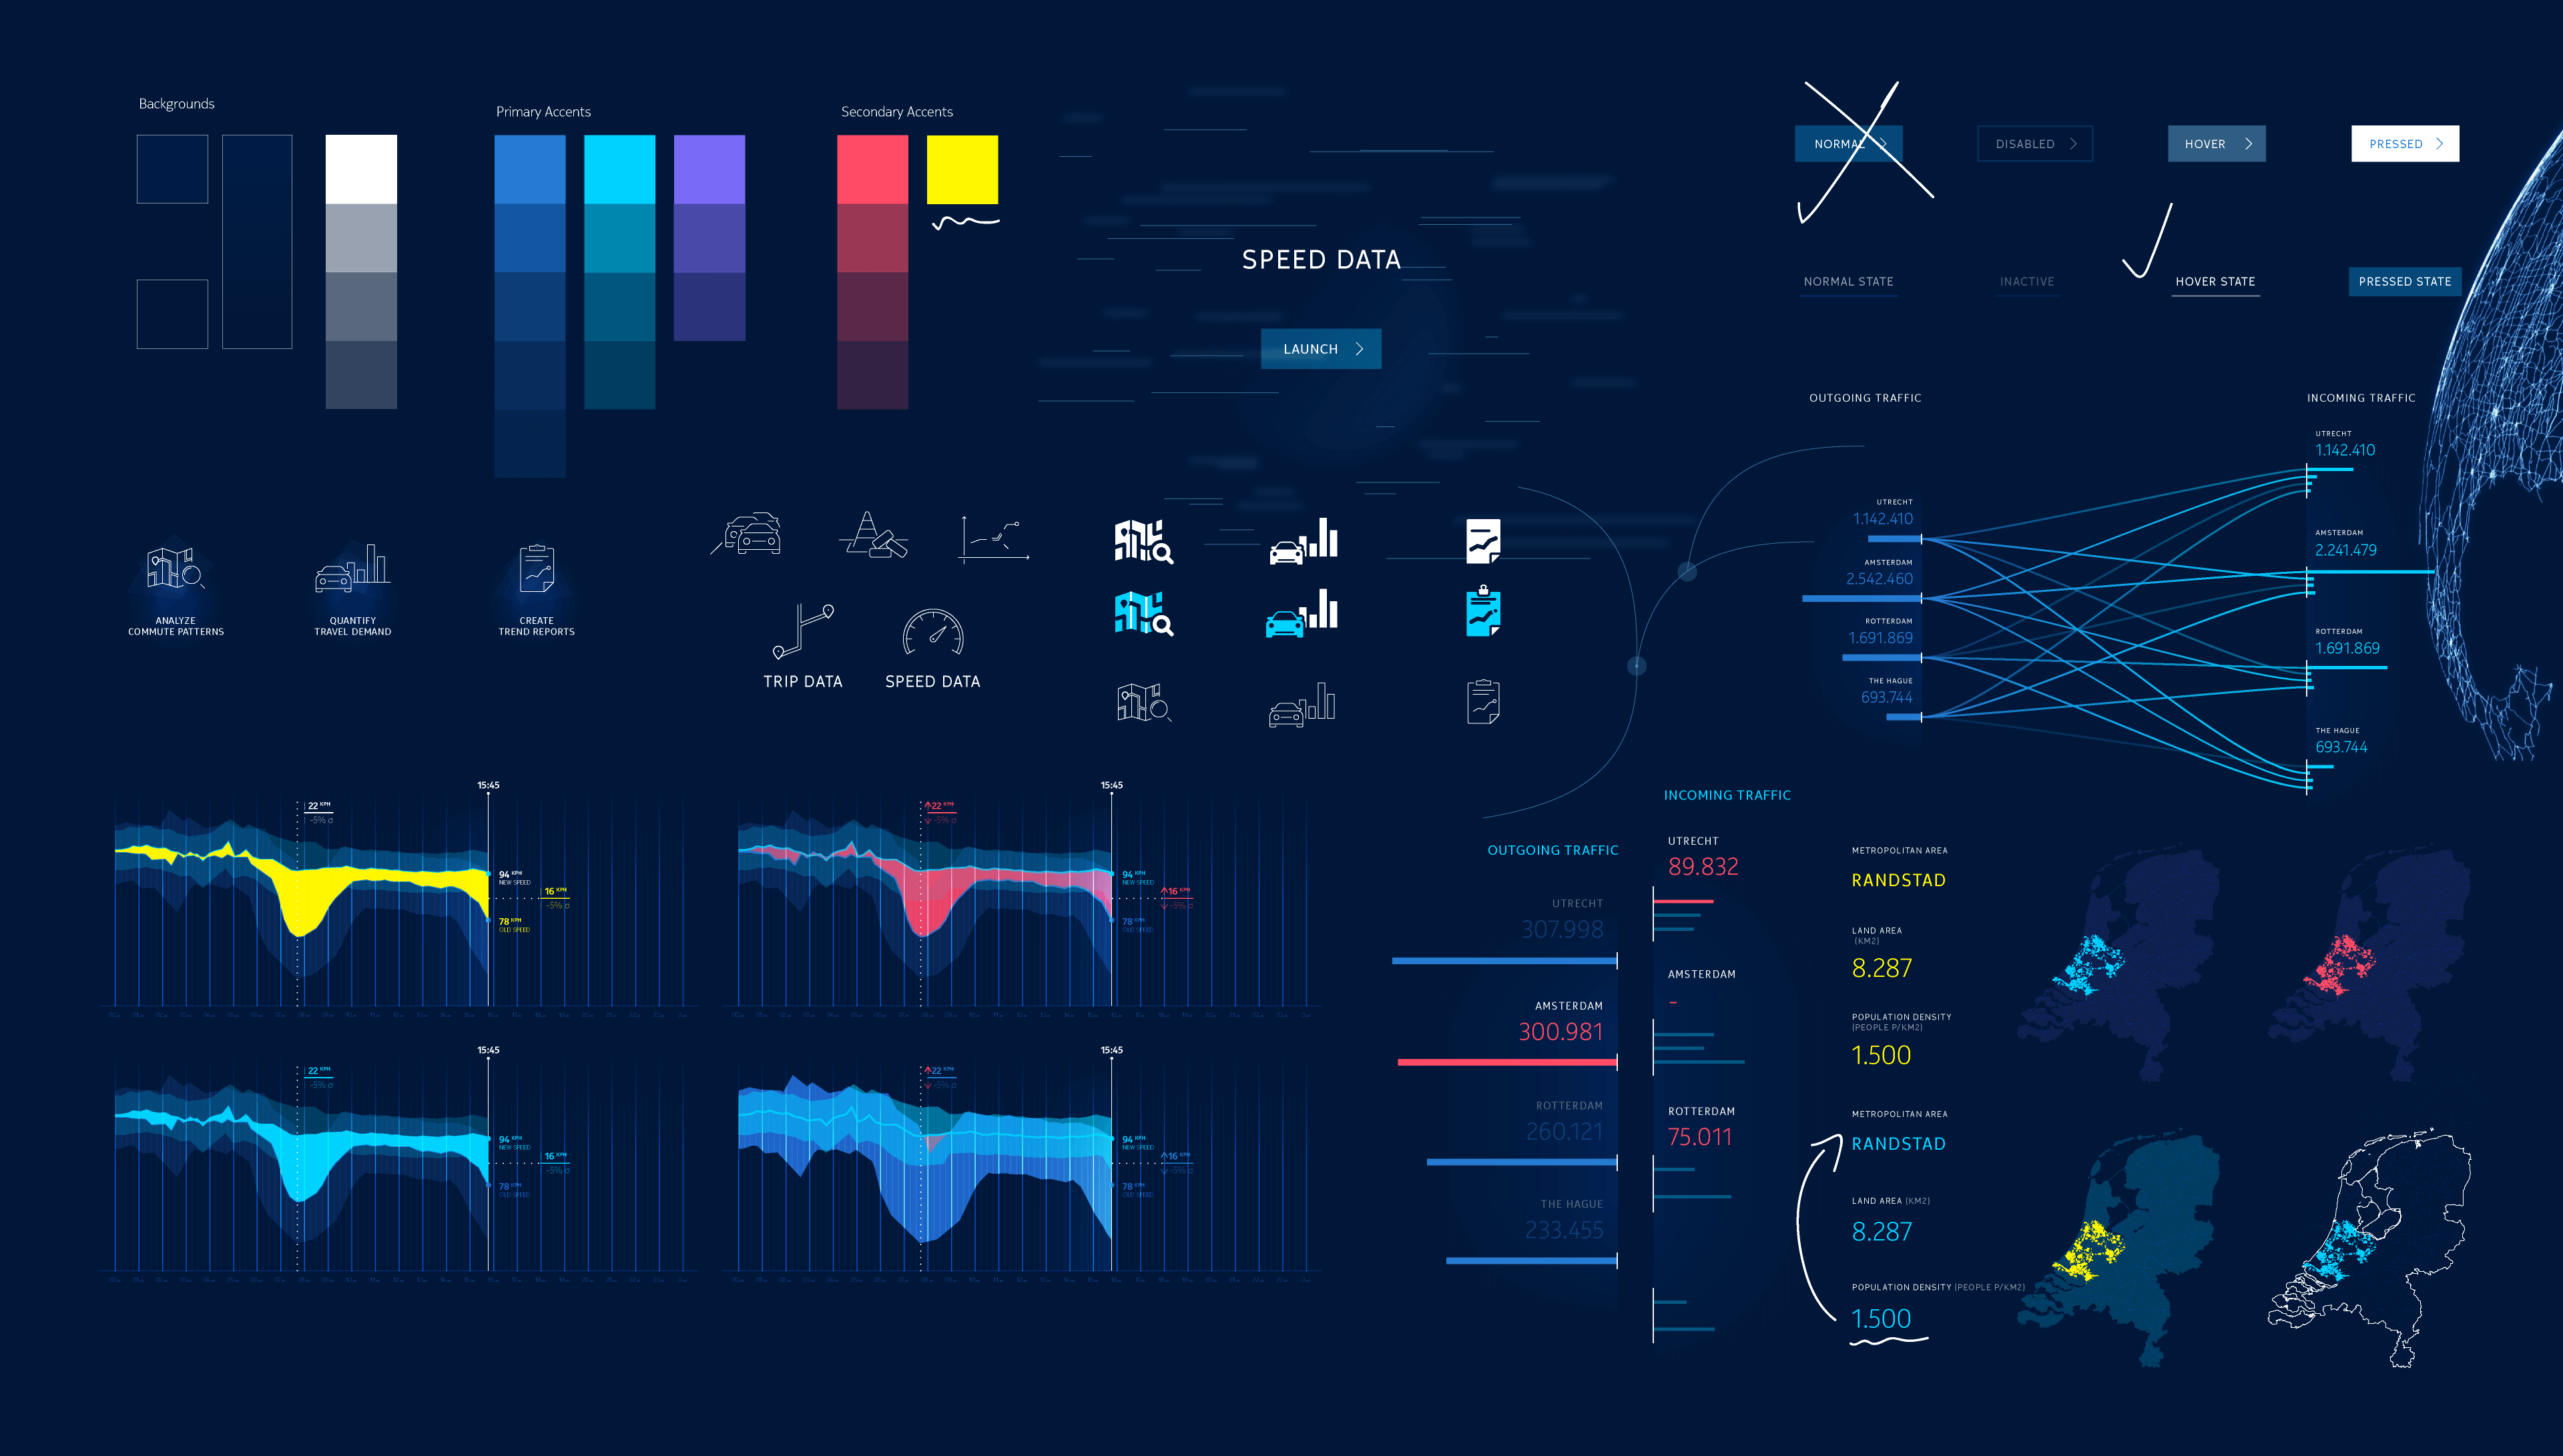
Datavisualizations
In order to create data visualizations that are both informative and cinematic, we have developed a combination of traditional 2D visualizations with more experimental 3D visualizations. These were then enriched by adding motion as an extra dimension, which allowed us to strengthen the storyline and convey key insights even better.
Technology
We used Cinema4D to generate the 3D data-driven visualizations and Adobe After Effects for 2D visualizations and compositing. The videos were then embedded in a touch-enabled presentation application that we custom built in C++/QML using the Qt Framework.
Results
Collaborating with CLEVER°FRANKE was a surprising experience. Their ways of bringing our complex data to life with their visualizations, turned our demonstration into something I could have never imagined. C°F showed the power and value of our product datasets in a very creative way.
Amy Zuchero / Product Marketing Manager, HERE