A data design system for the global digital experience product suite
- Client
- Cisco
- Deliverables
- Data visualization library
- Data design guidelines
The challenge
More than any other sector, businesses in the technology sector are expected to quickly adapt to digital transformations and provide swift solutions for their clients.
Cisco is the largest networking company in the world. It develops, manufactures, and sells networking hardware, telecommunications equipment, and other high-technology services and products. To provide better service for their users, Cisco needed a clear and impactful way to communicate through data.
CLEVER°FRANKE was asked to create a coherent data visualization and charting library that harmonized data visualization structures across Cisco’s extensive product suite.
Value delivered
Helping Cisco to communicate their data more consistently and in an efficient way, as well as enabling internal and external stakeholders to make better-informed decisions.
Background
Starting with data inventory research, we looked into different existing graph types and ranked these across parameters such as legibility, actionability and complexity.
After that, we analyzed Cisco’s existing design system ‘Momentum Design’ and ensured that the data design & visualization system would be in-keeping with the existing brand and components already in place.
By doing so, we ensured that we deliver a seamless extension and integration of the brand and provide consistency across all data touch-points.
Phases and toolkit items used

Solution
Datavisualizationsystem
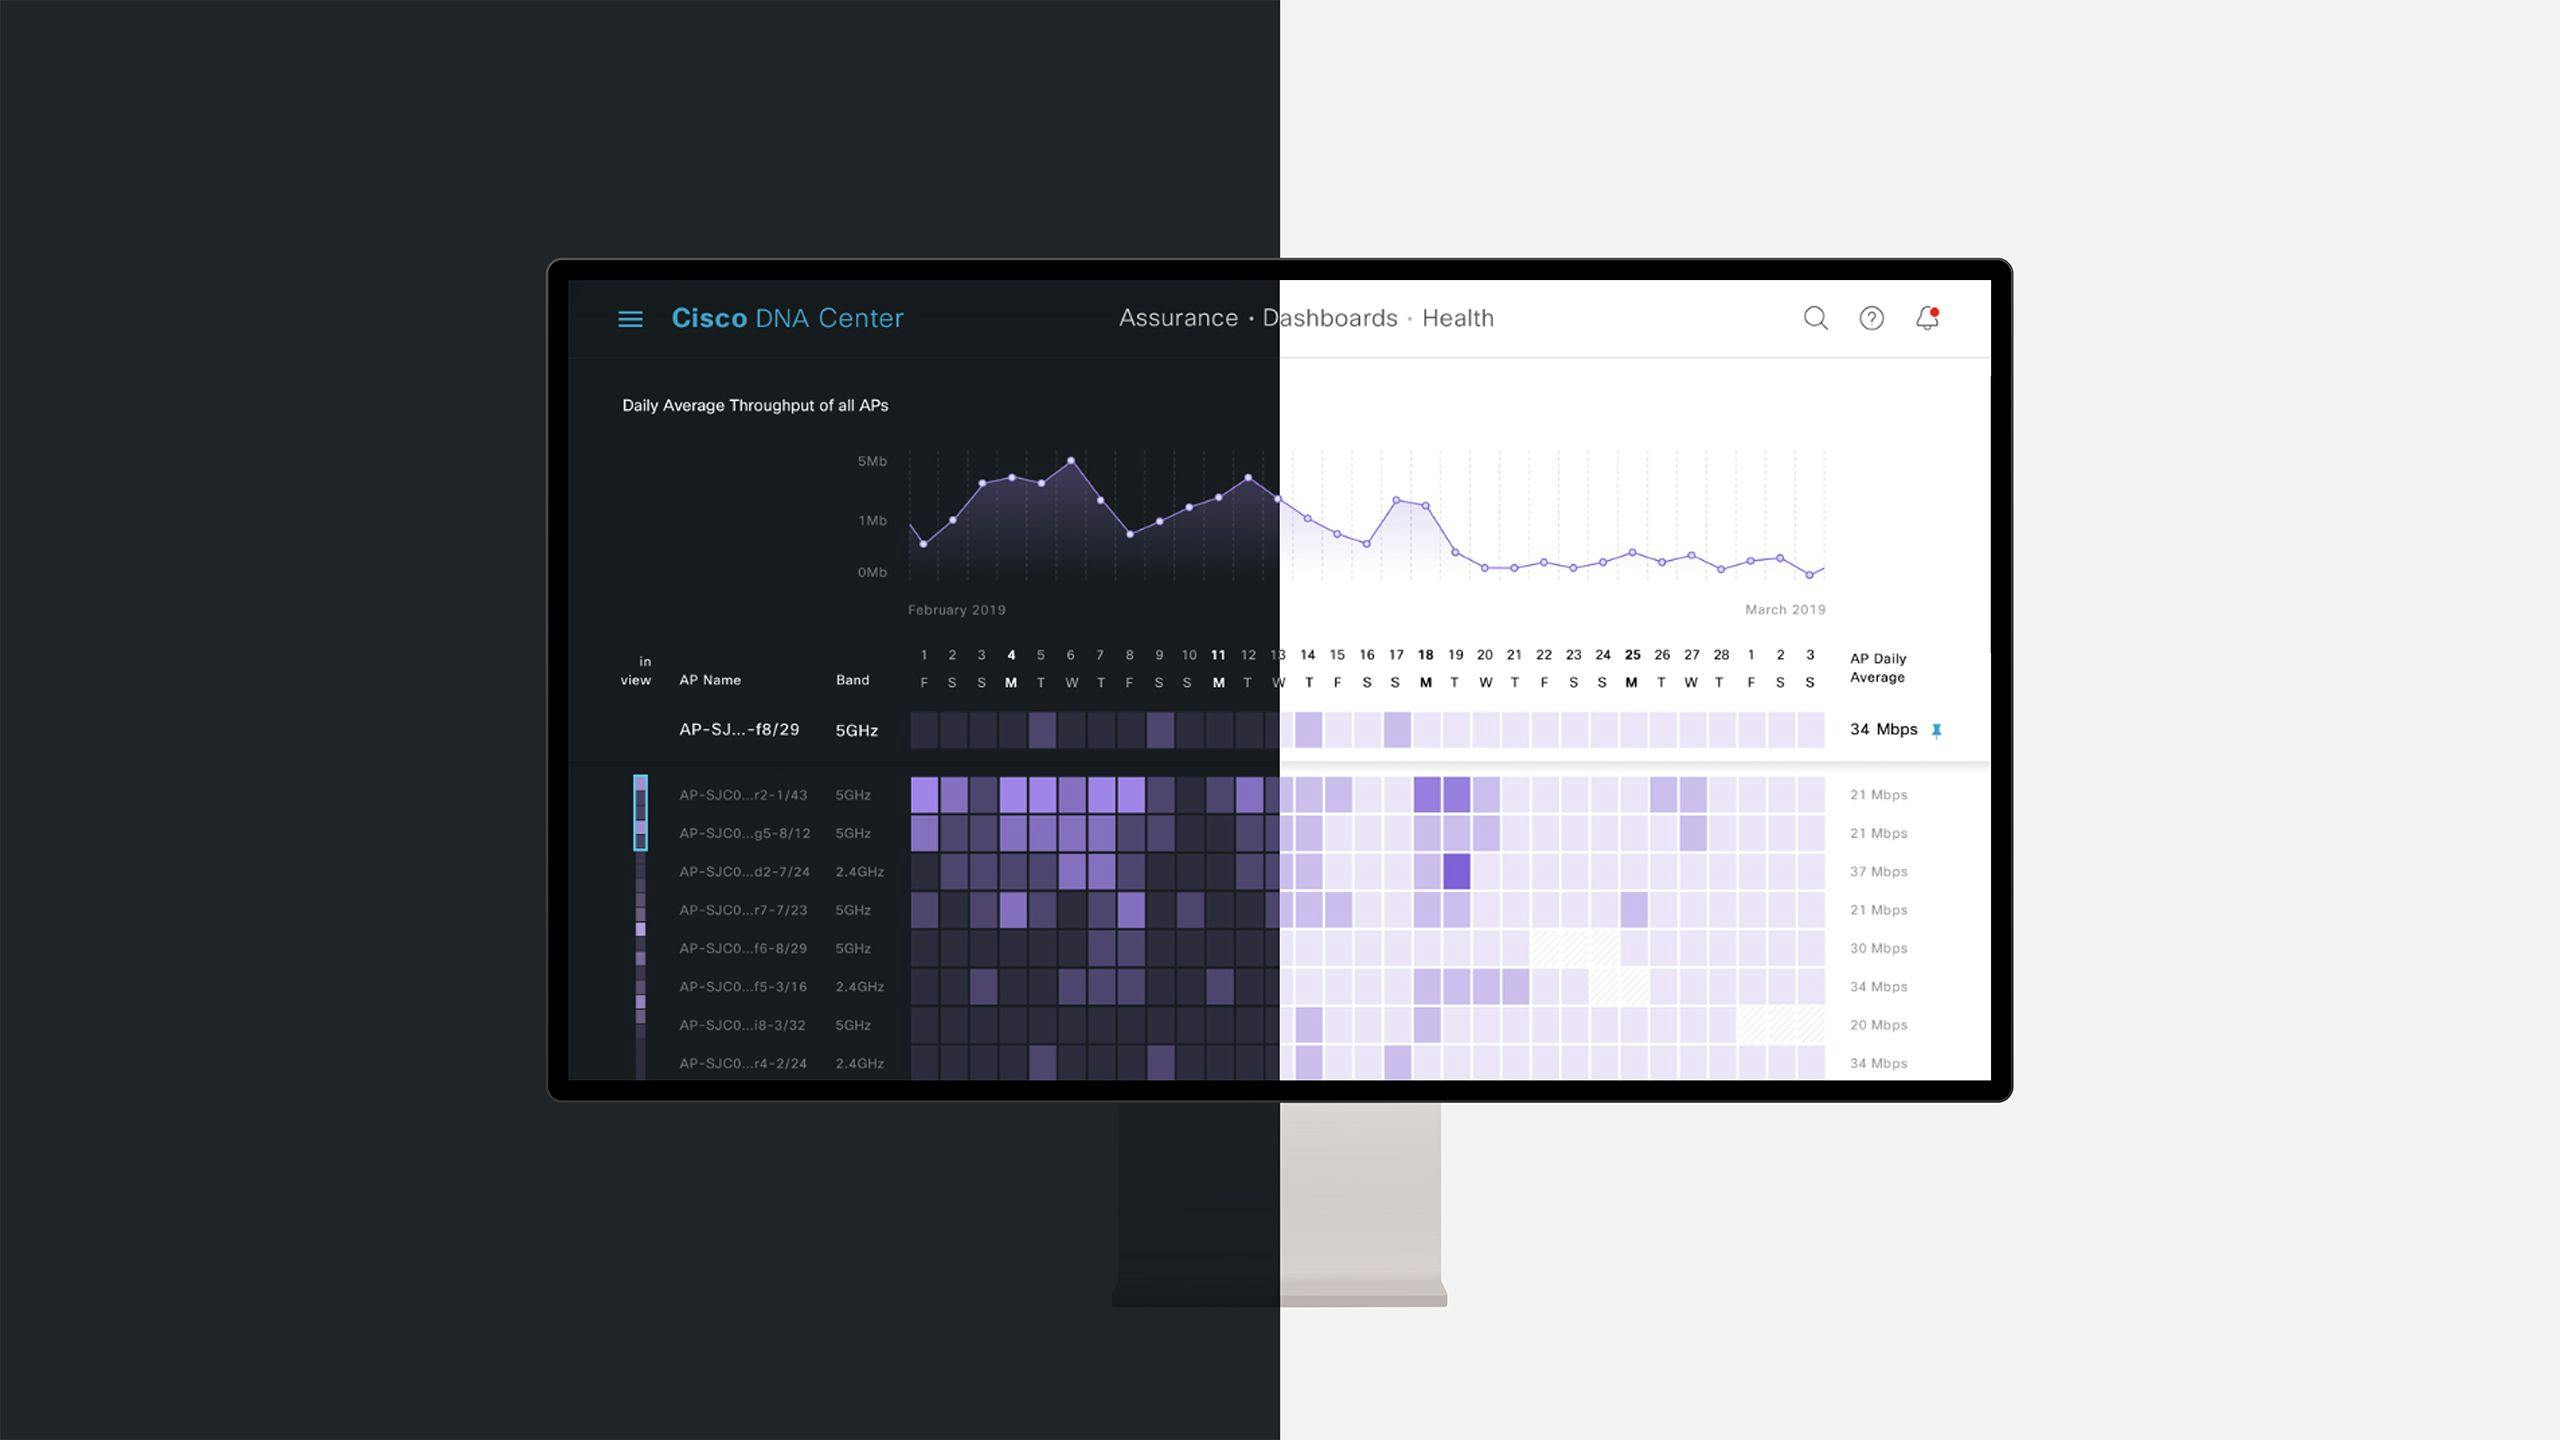
We developed a unique data design system that brought visual unity to the chart designs. The main goal was to present the data as insightfully as possible, and maintain consistency with the brand guidelines.
We were challenged to find a good symbiosis between scientific best practices in data visualization and company-specific edge cases.
The design system includes options and guidelines for legends, labels, axis, grids. We looked at time-formatting, interactive legends, and other special edge cases.
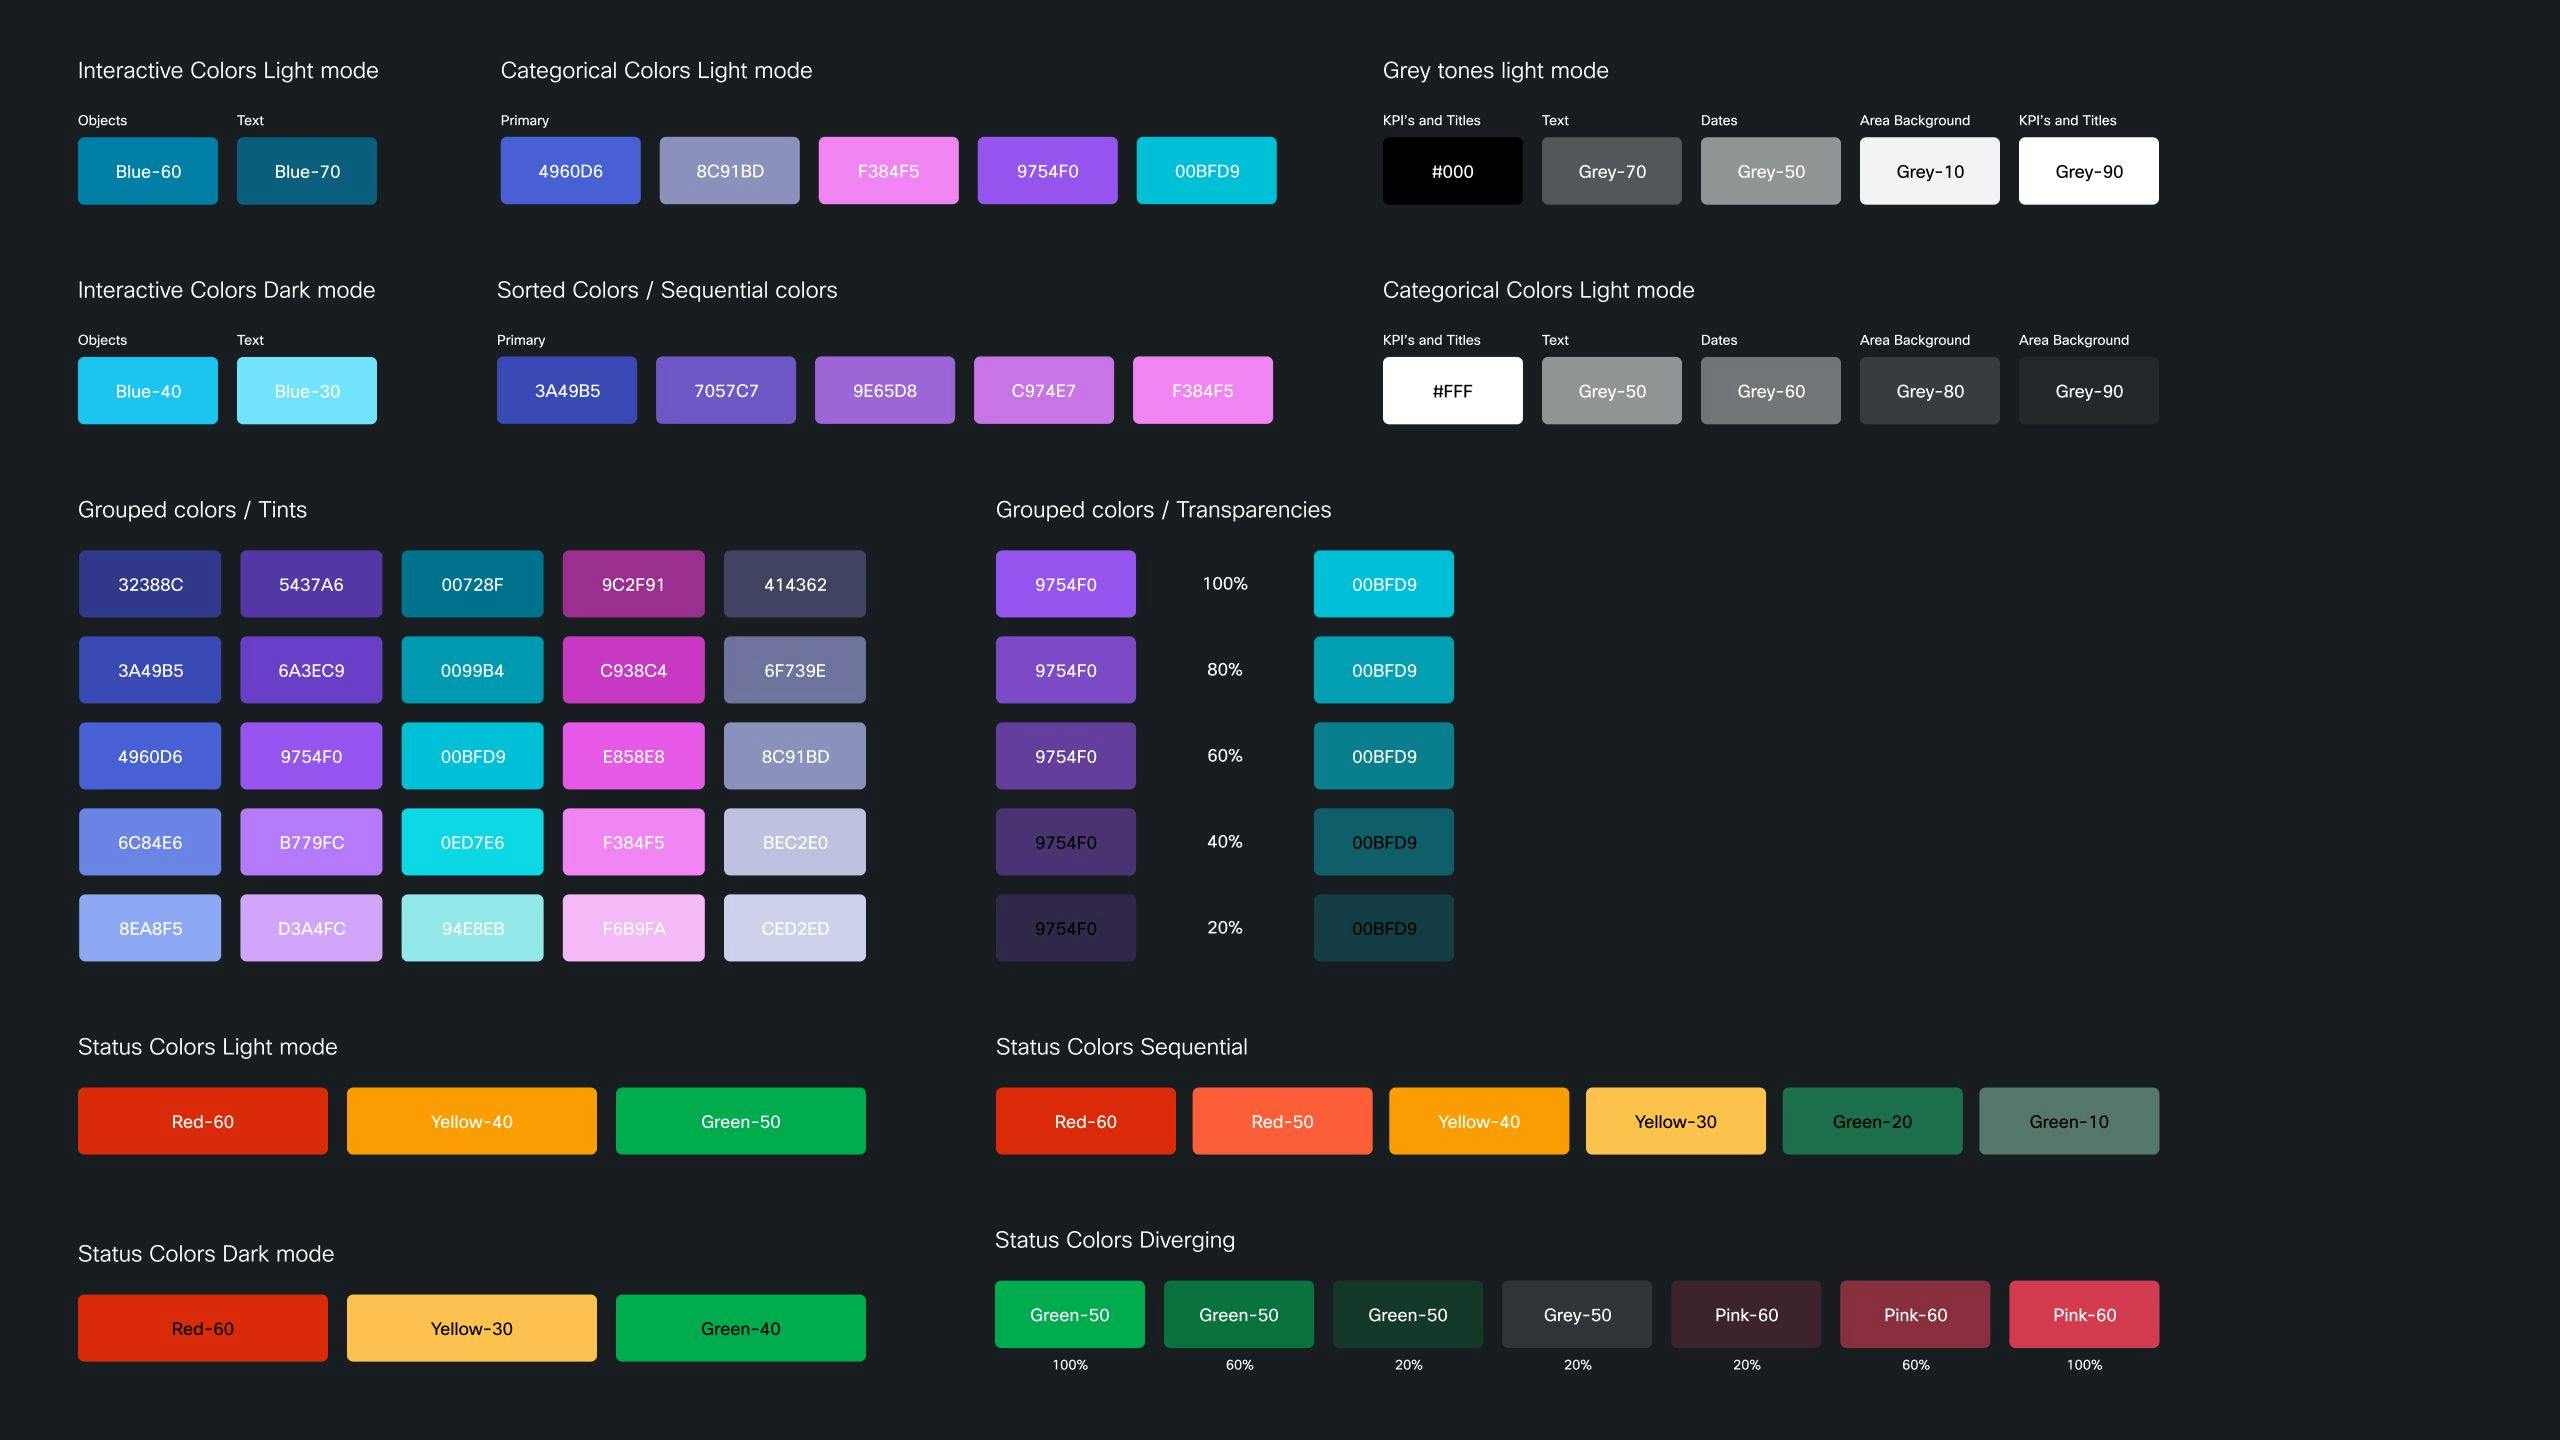
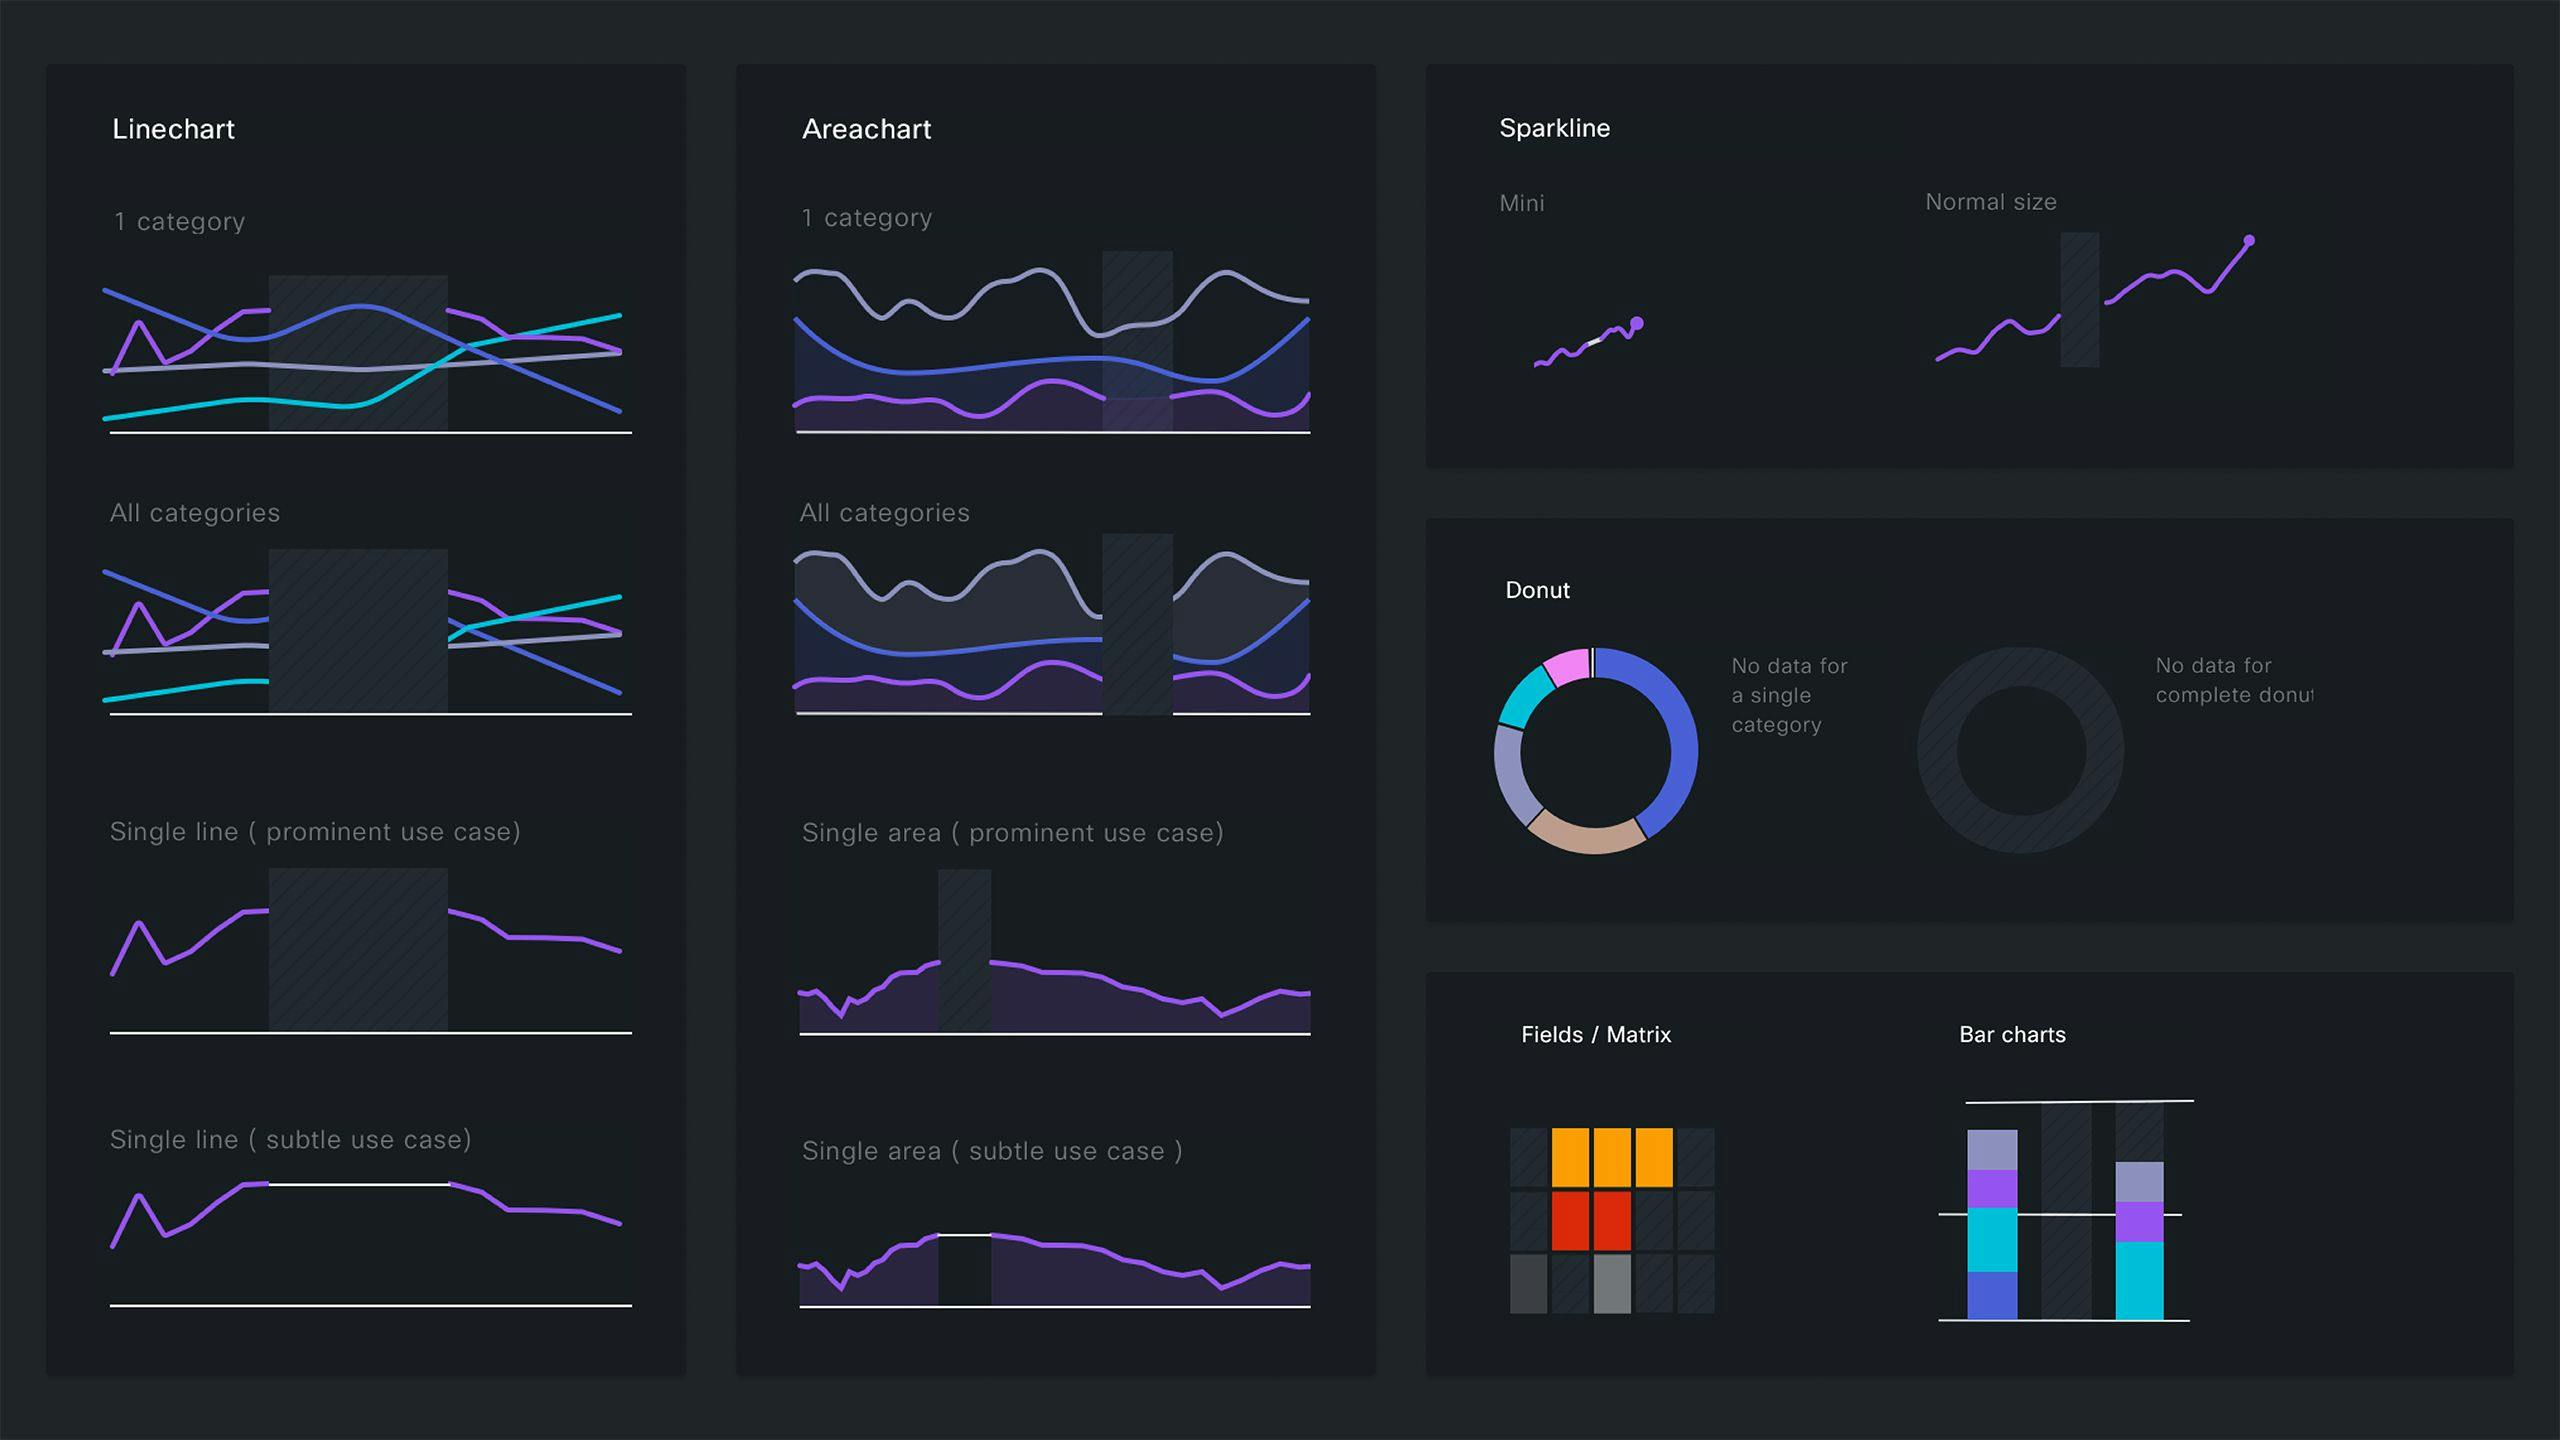
Colorsystem
We expanded the brand colors of the ‘Cisco Momentum design system’ to a full-fledged data visualization palette. The result includes status colors as well as categorical, sequential and diverging palettes. All palettes are tested according to accessibility standards.
We provided different color variations within these palettes that match the brand guidelines.
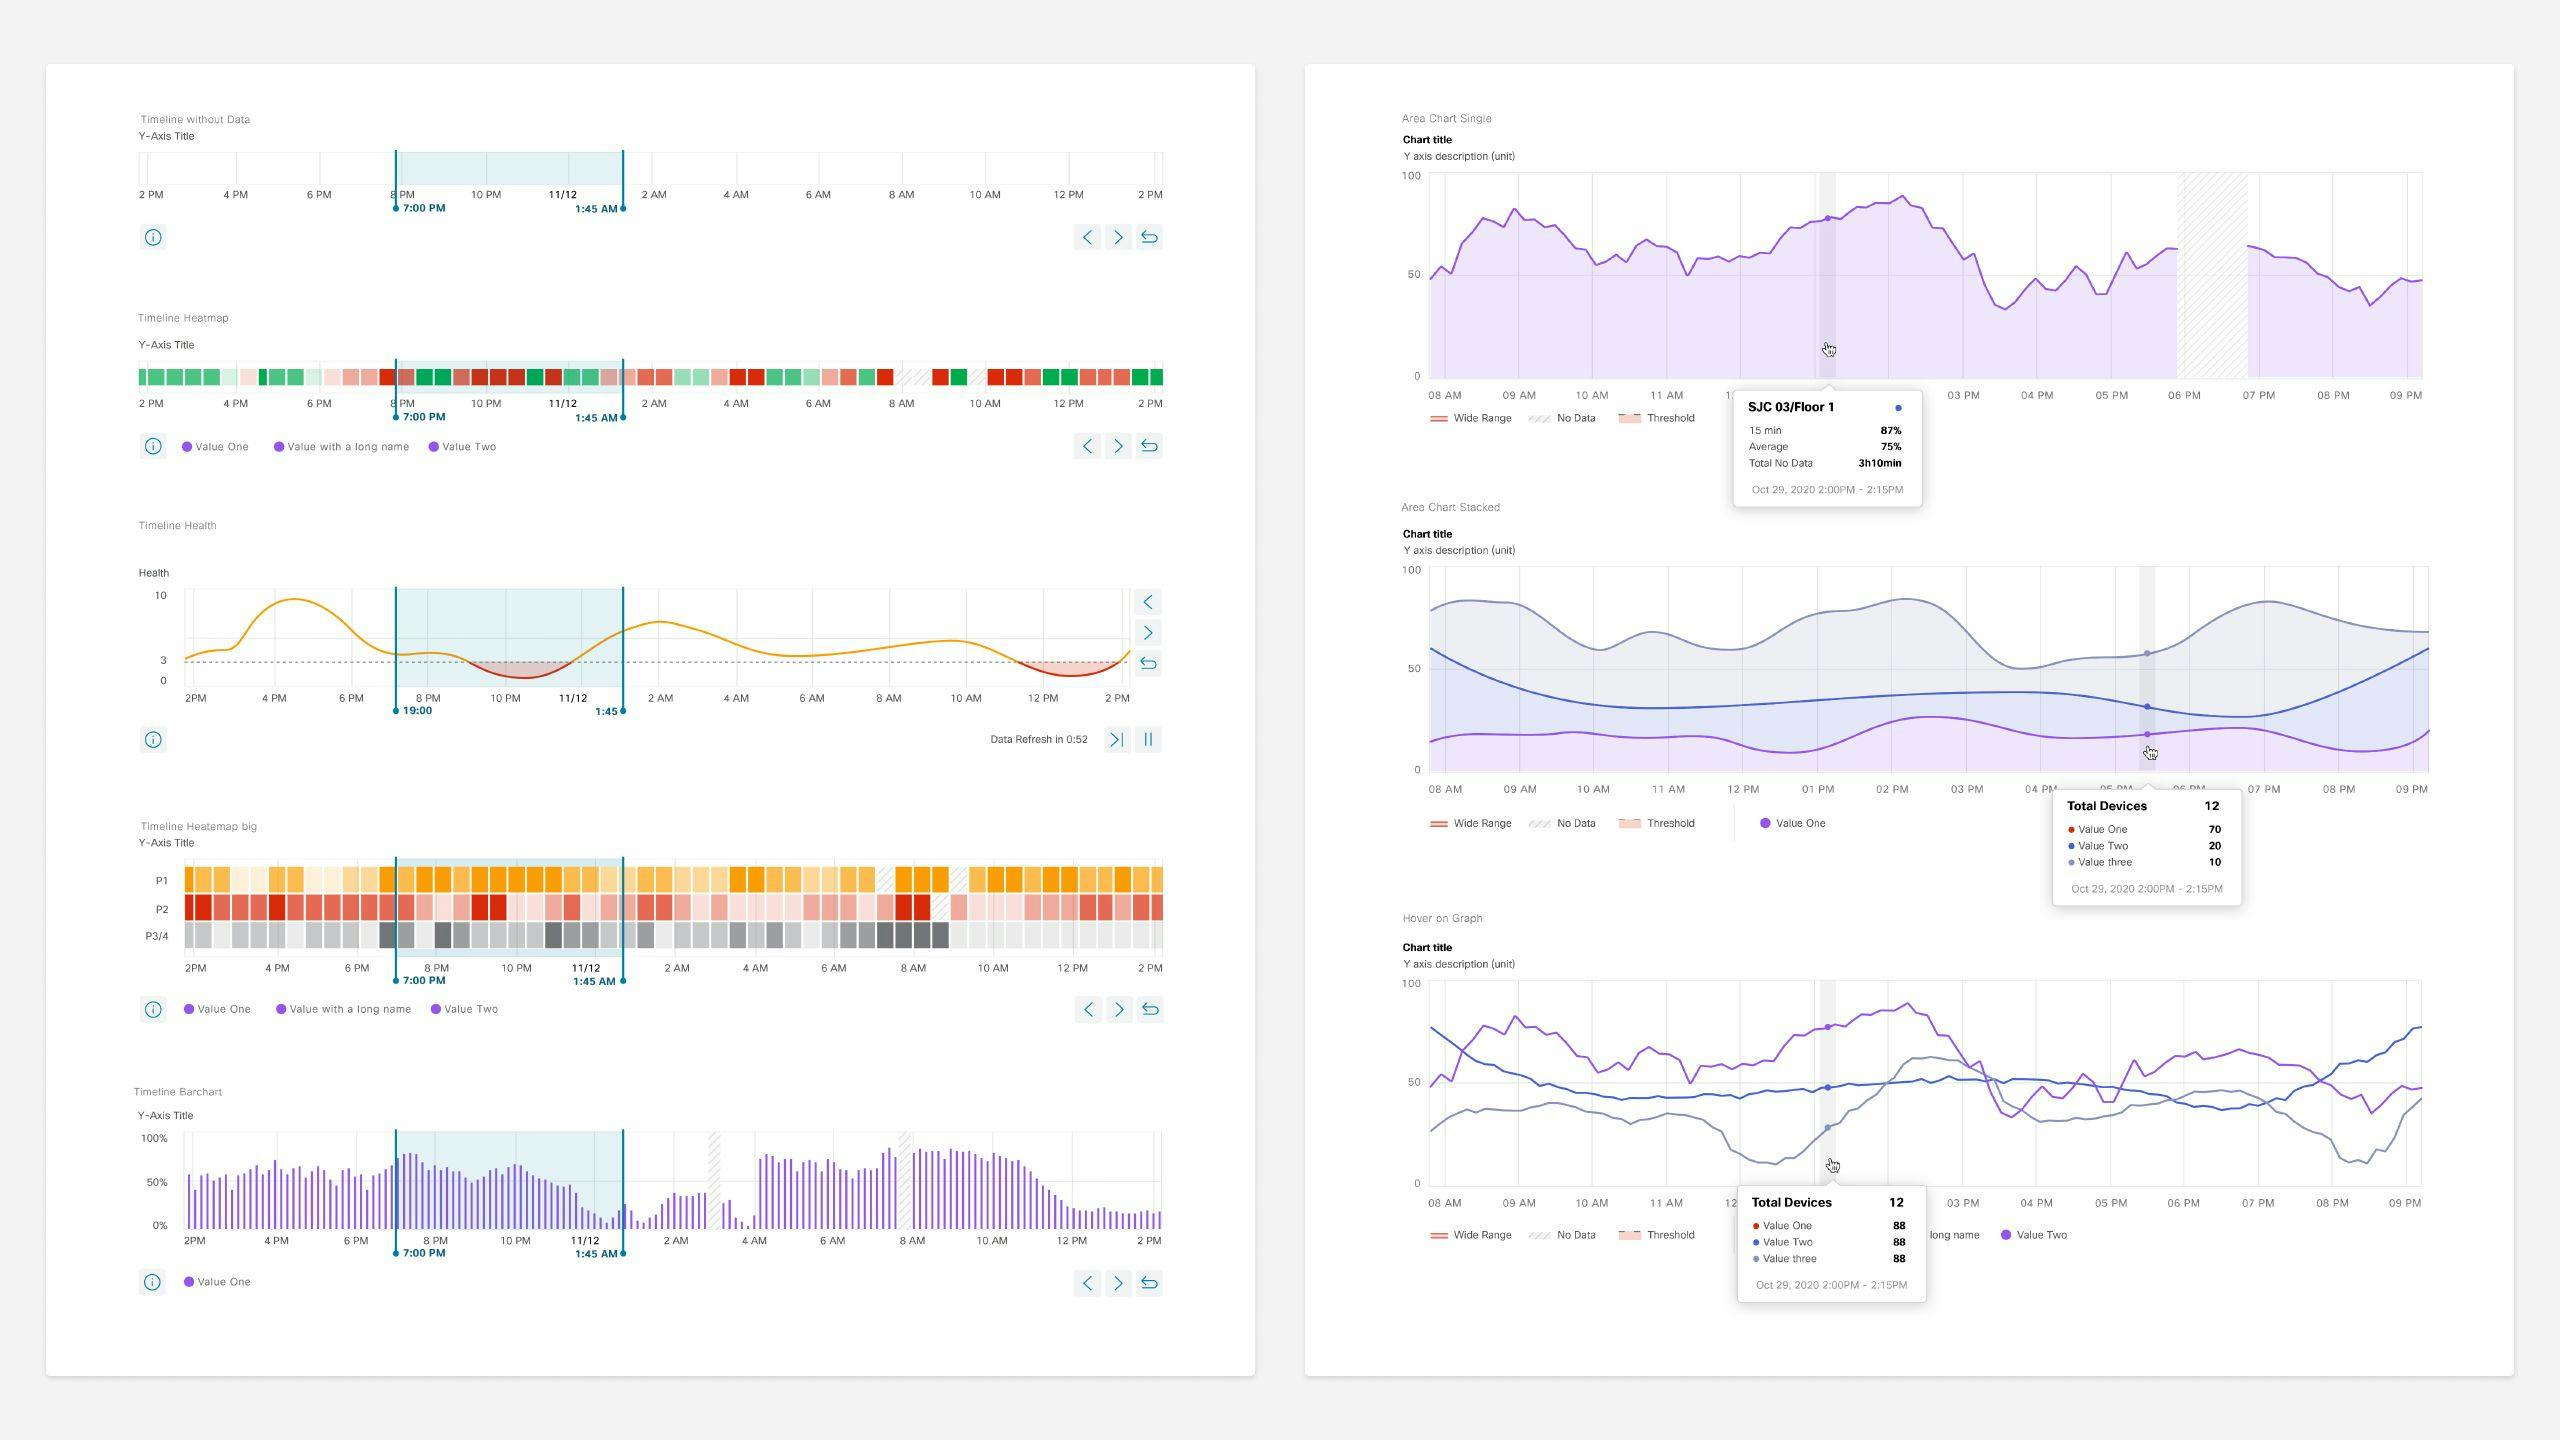
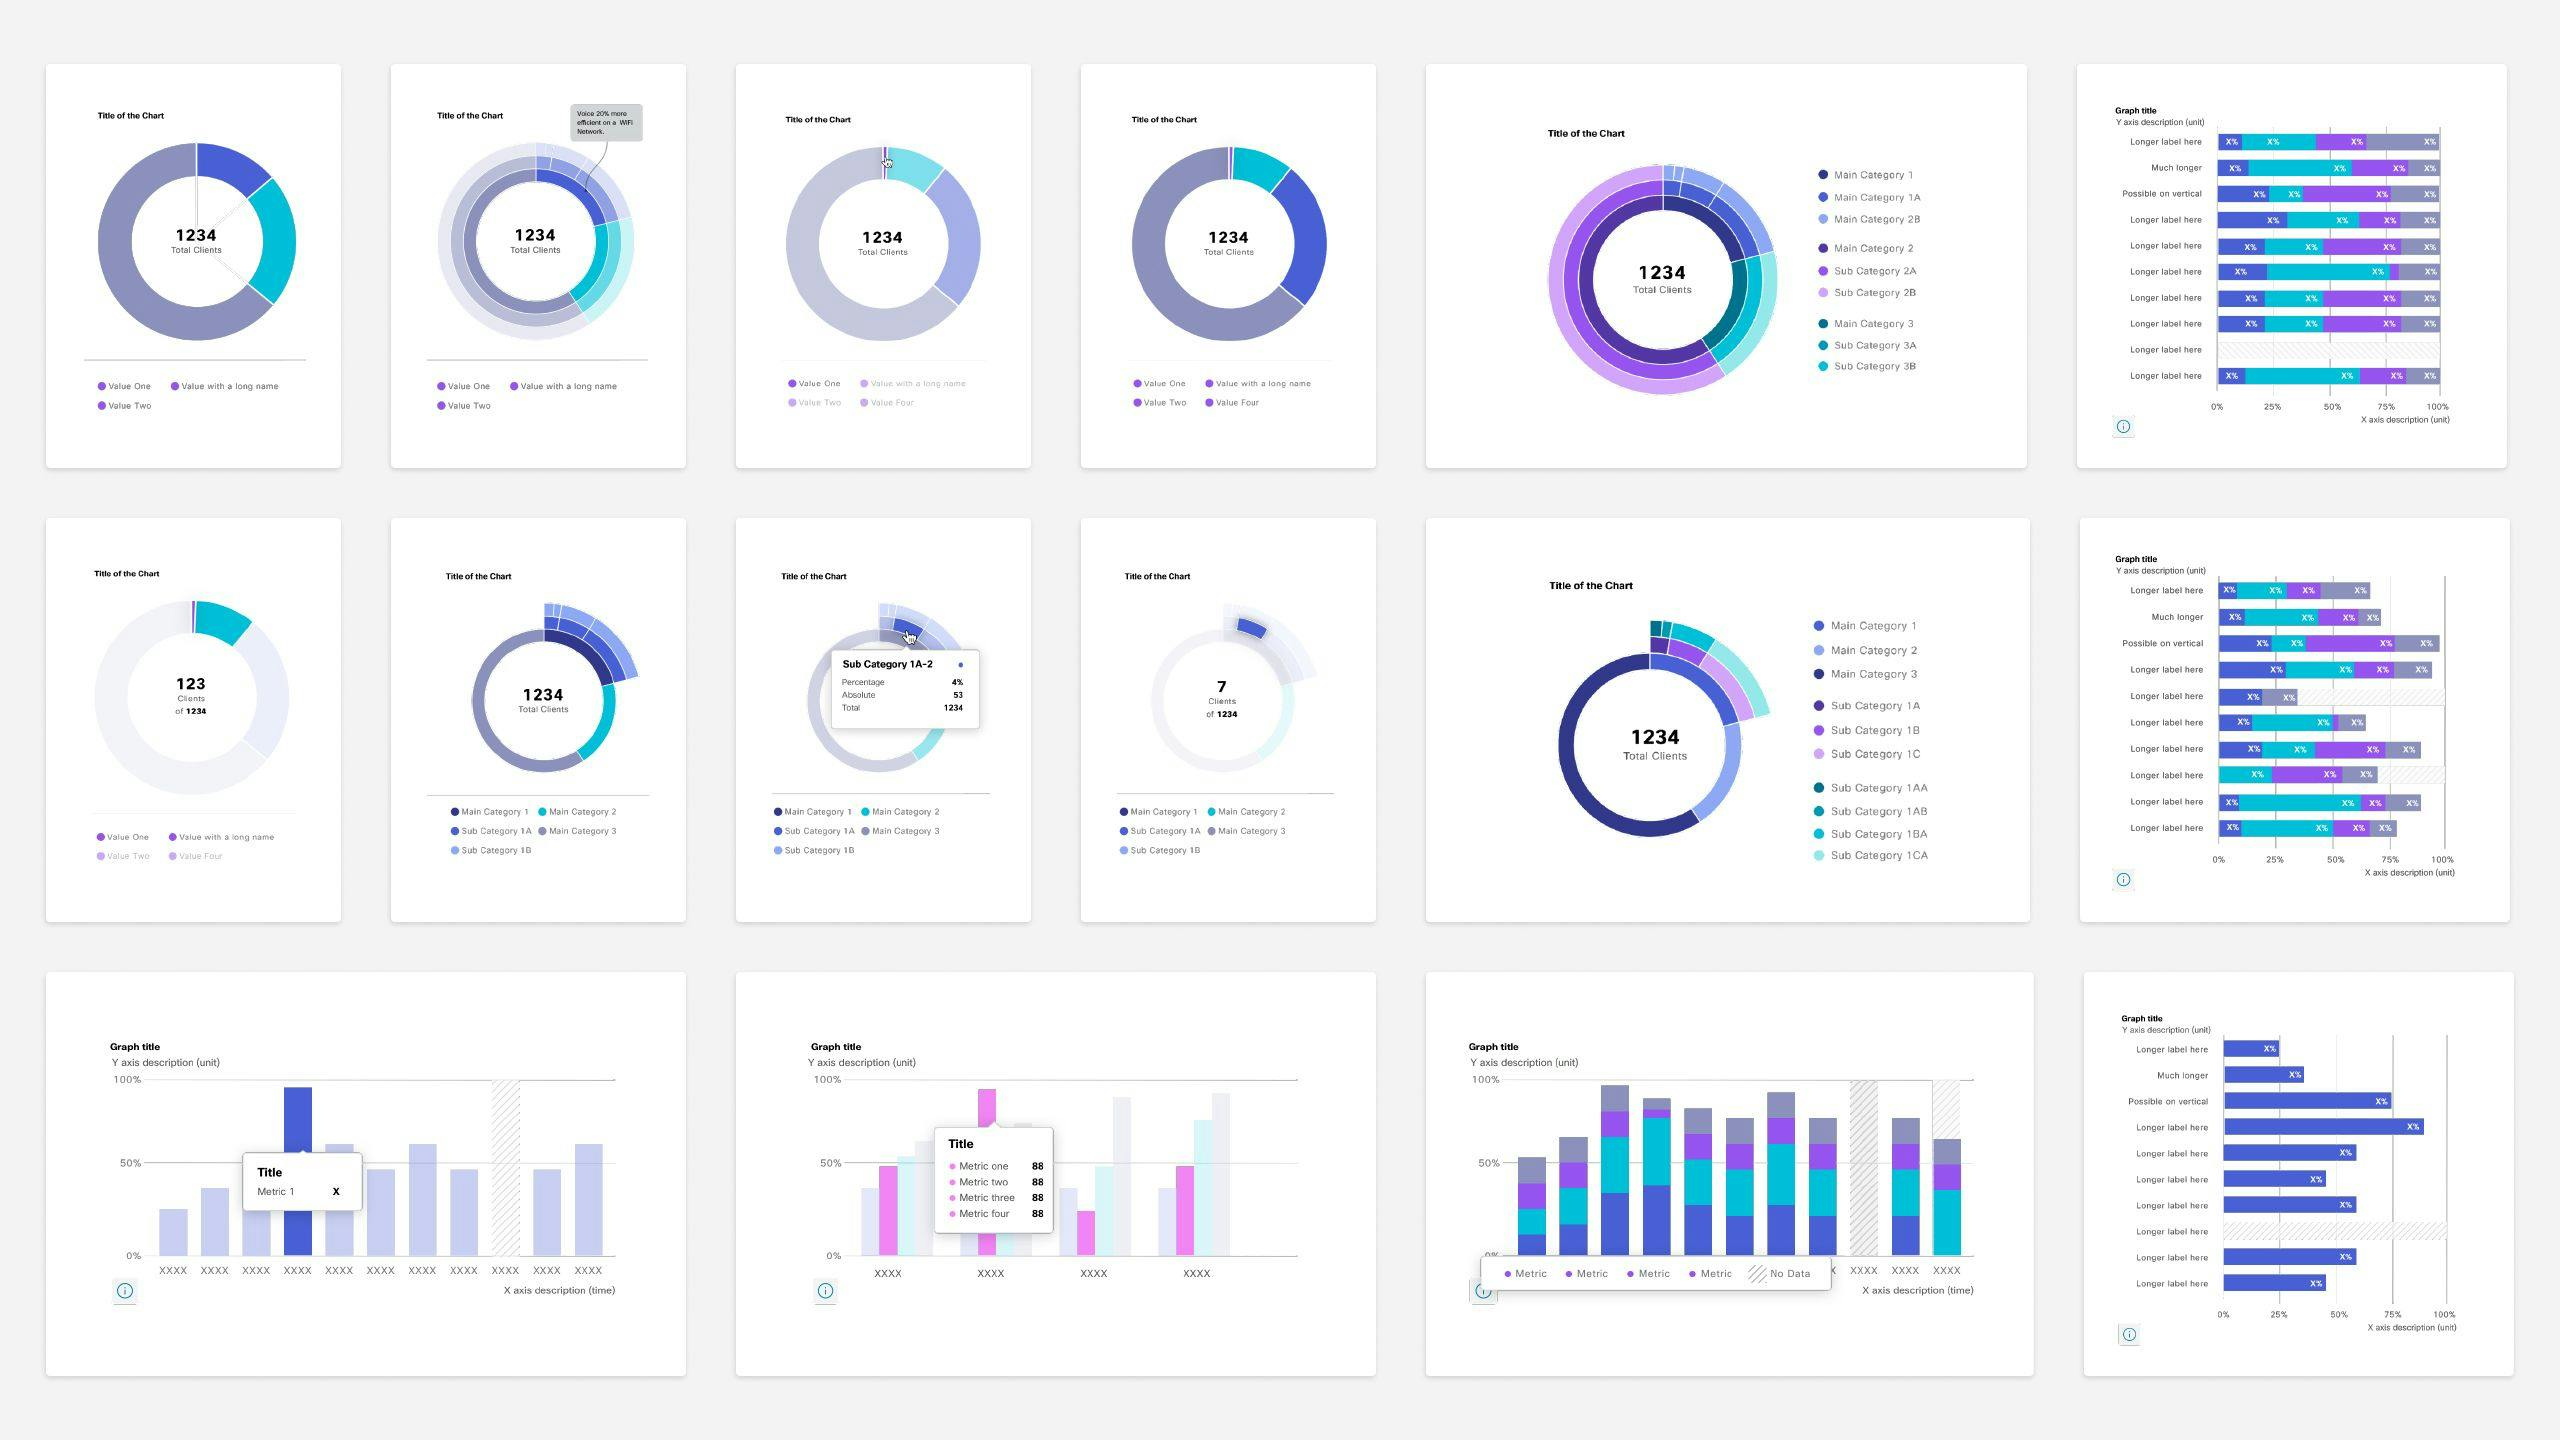
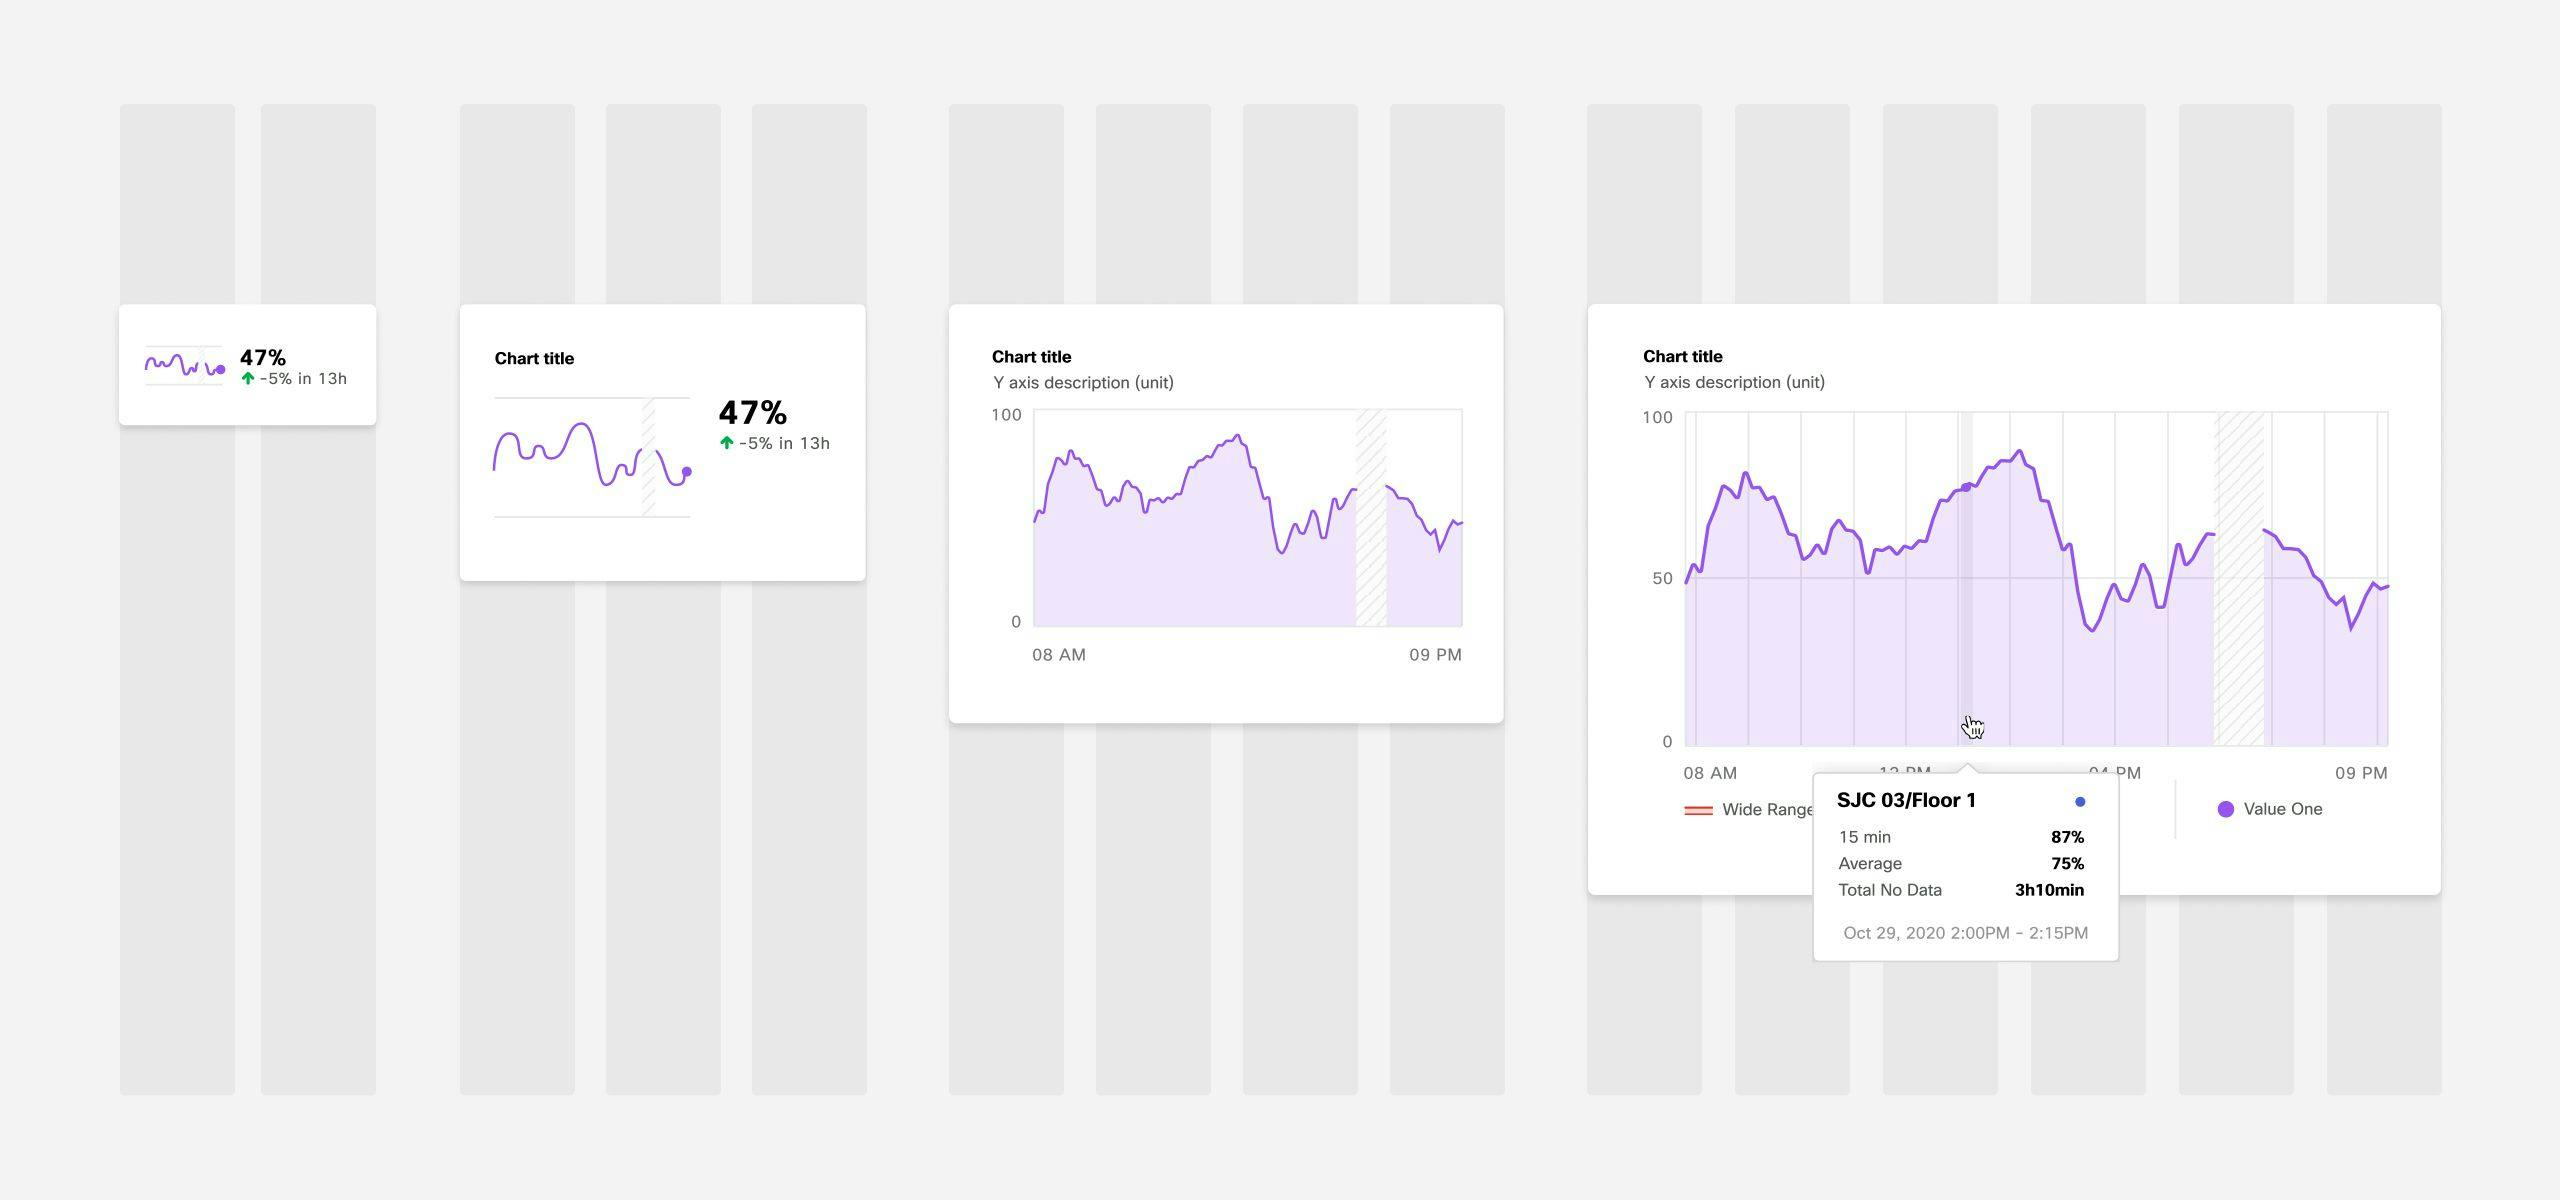
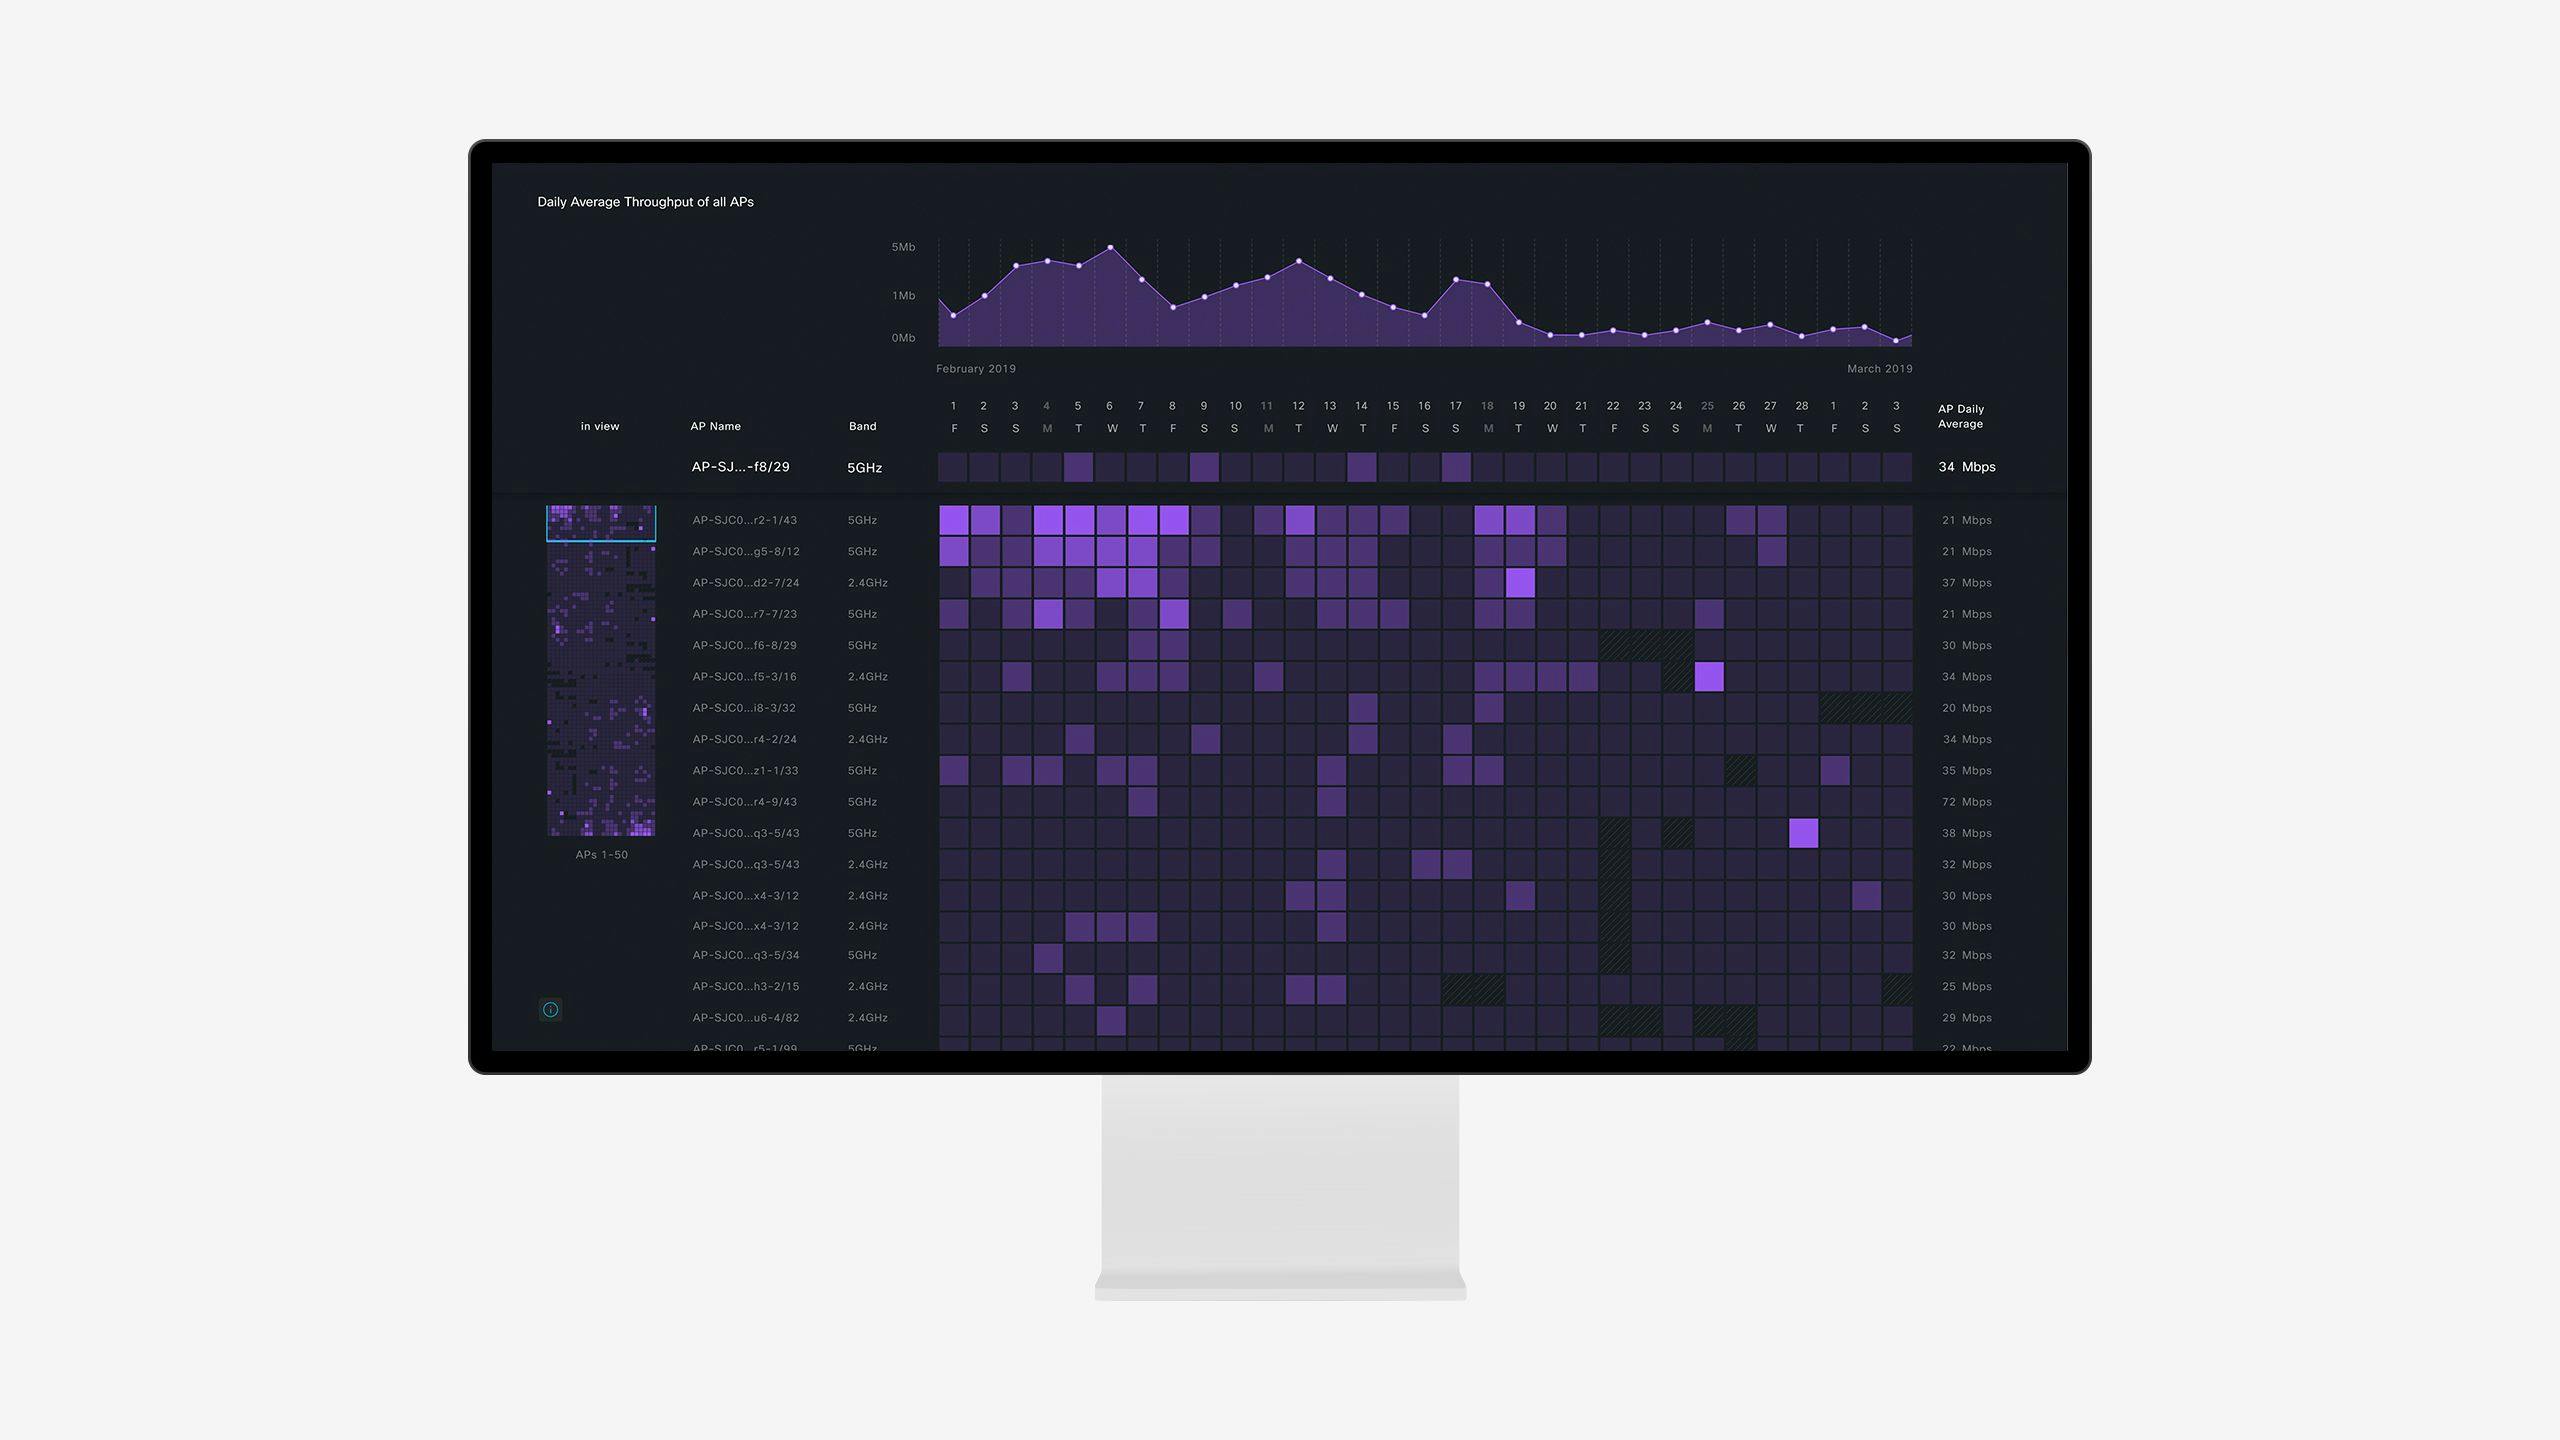
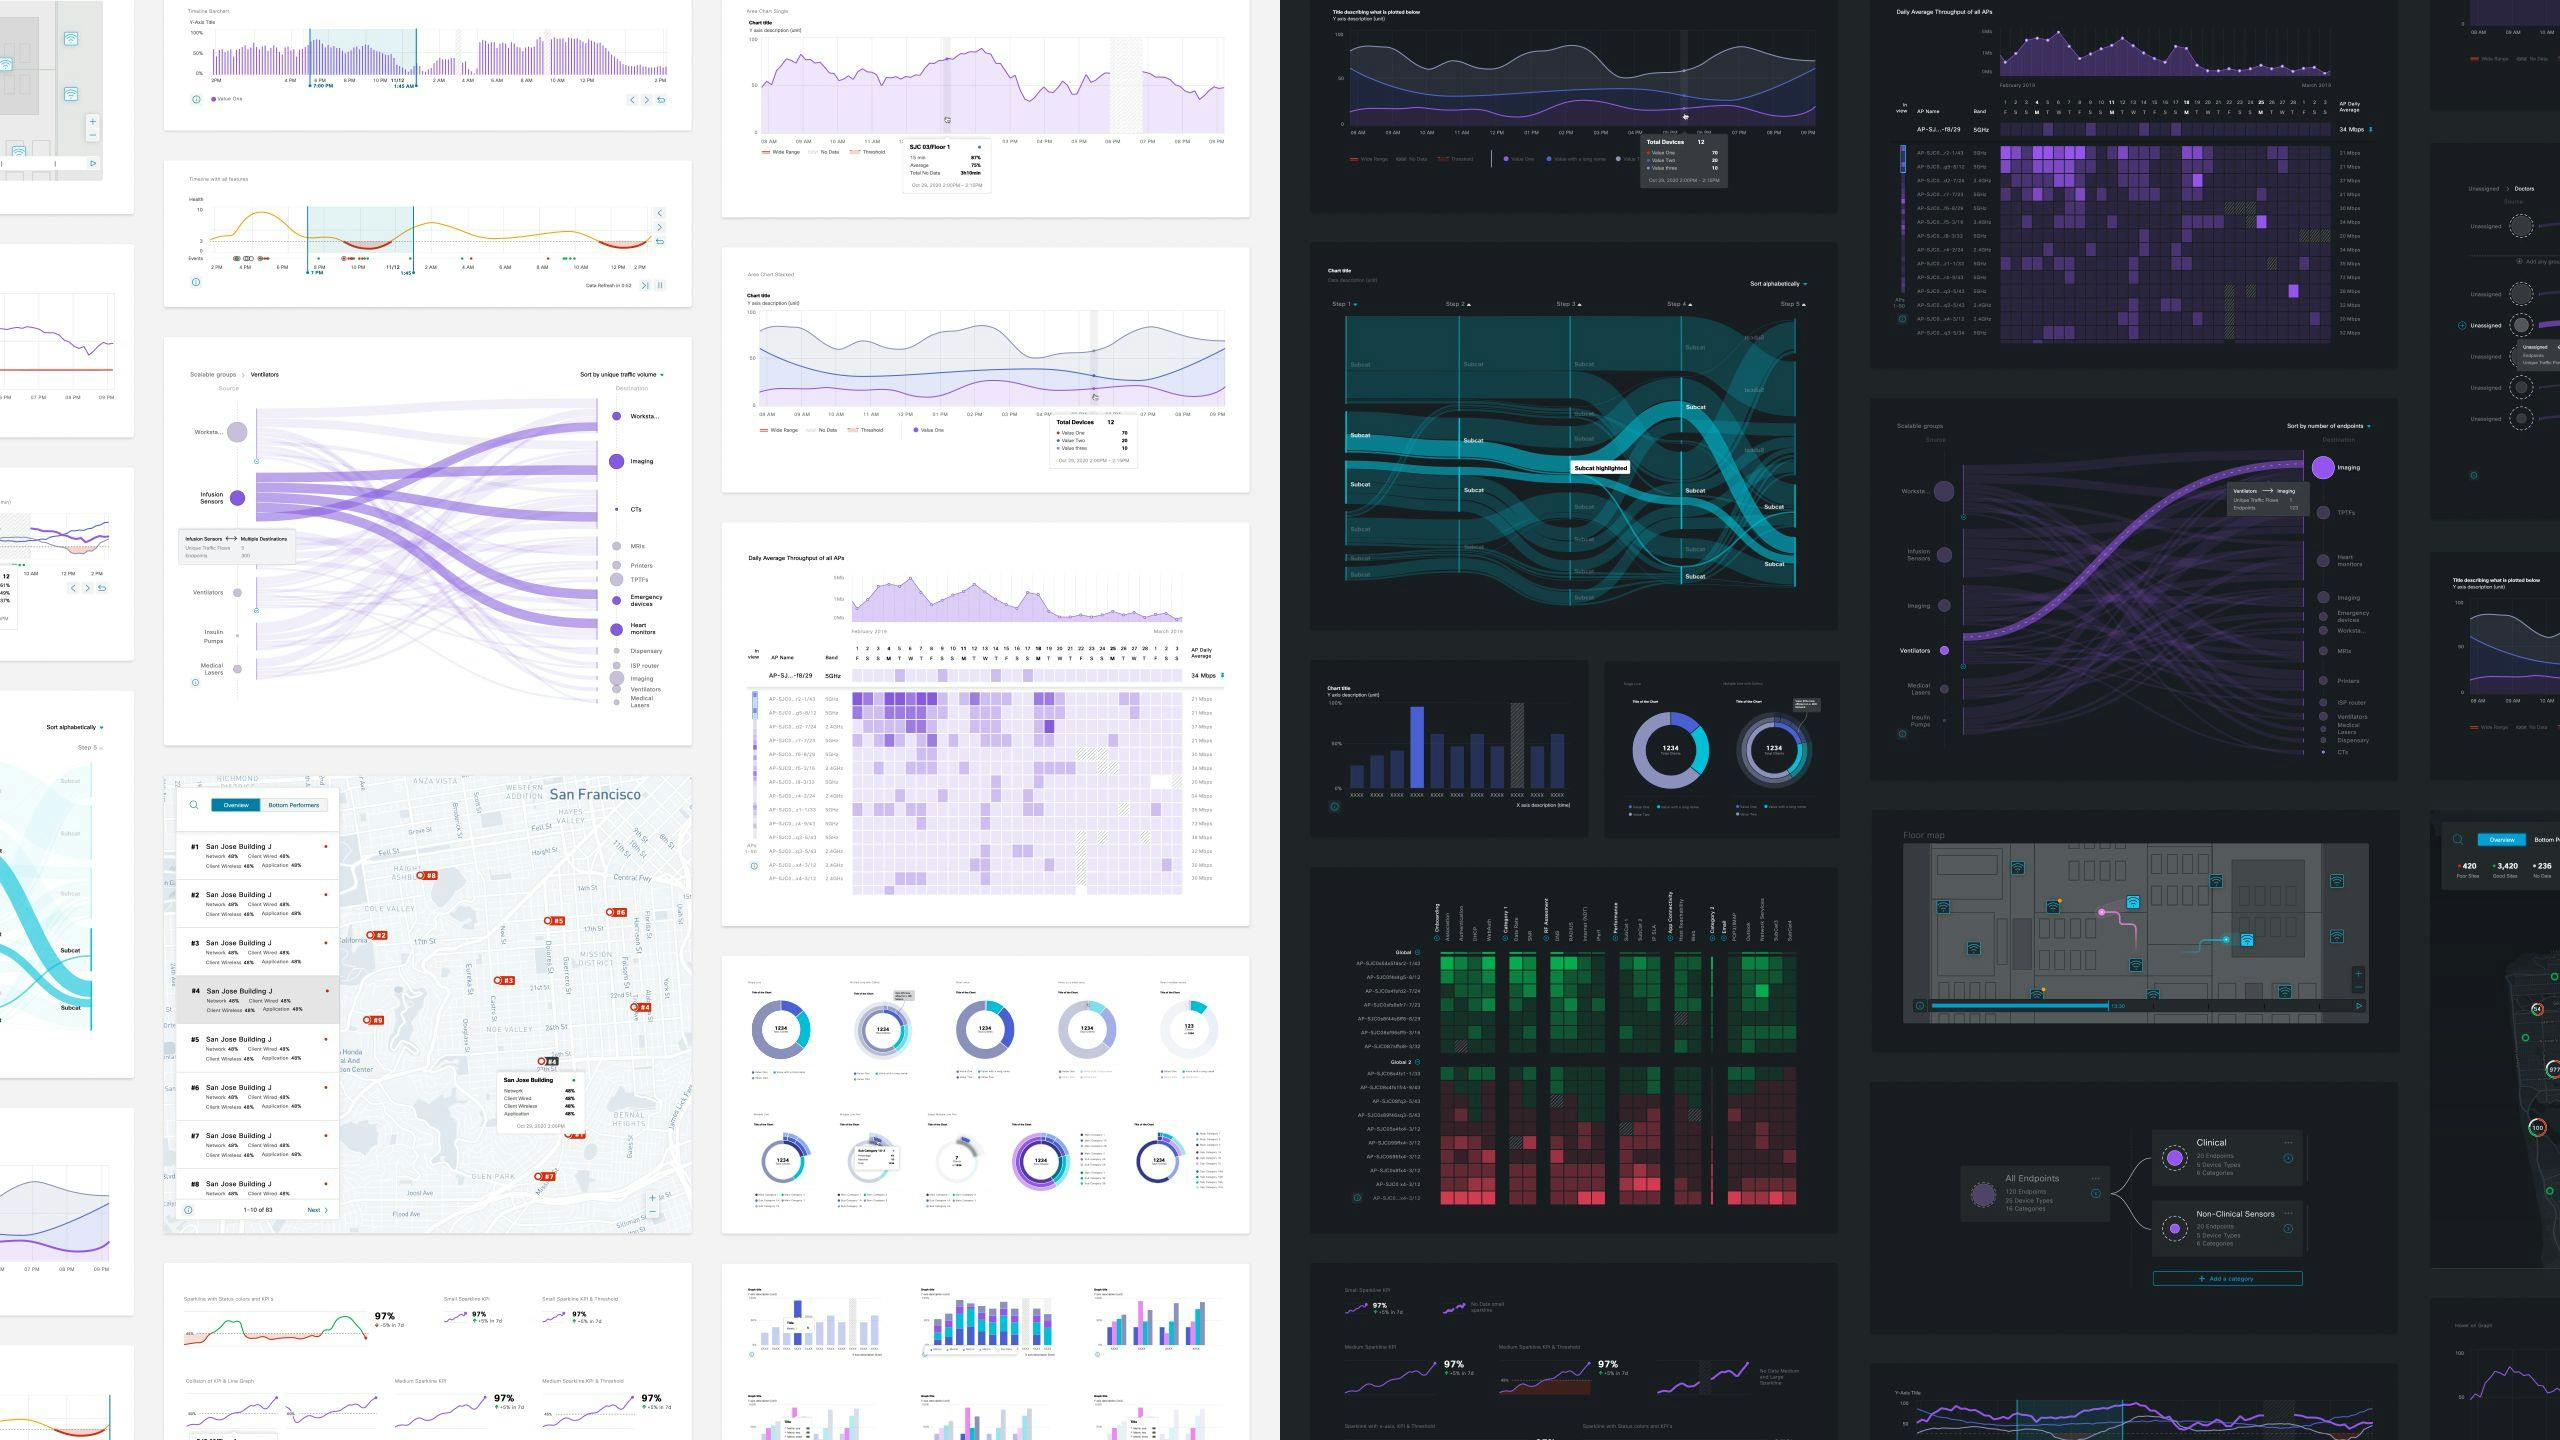
Chartvariations
For each chart, we created an extensive suite of chart variations with a wide range of data states, interactions, and specific use cases. This gives status at a glance and serves those users who are interested in the overall performance.
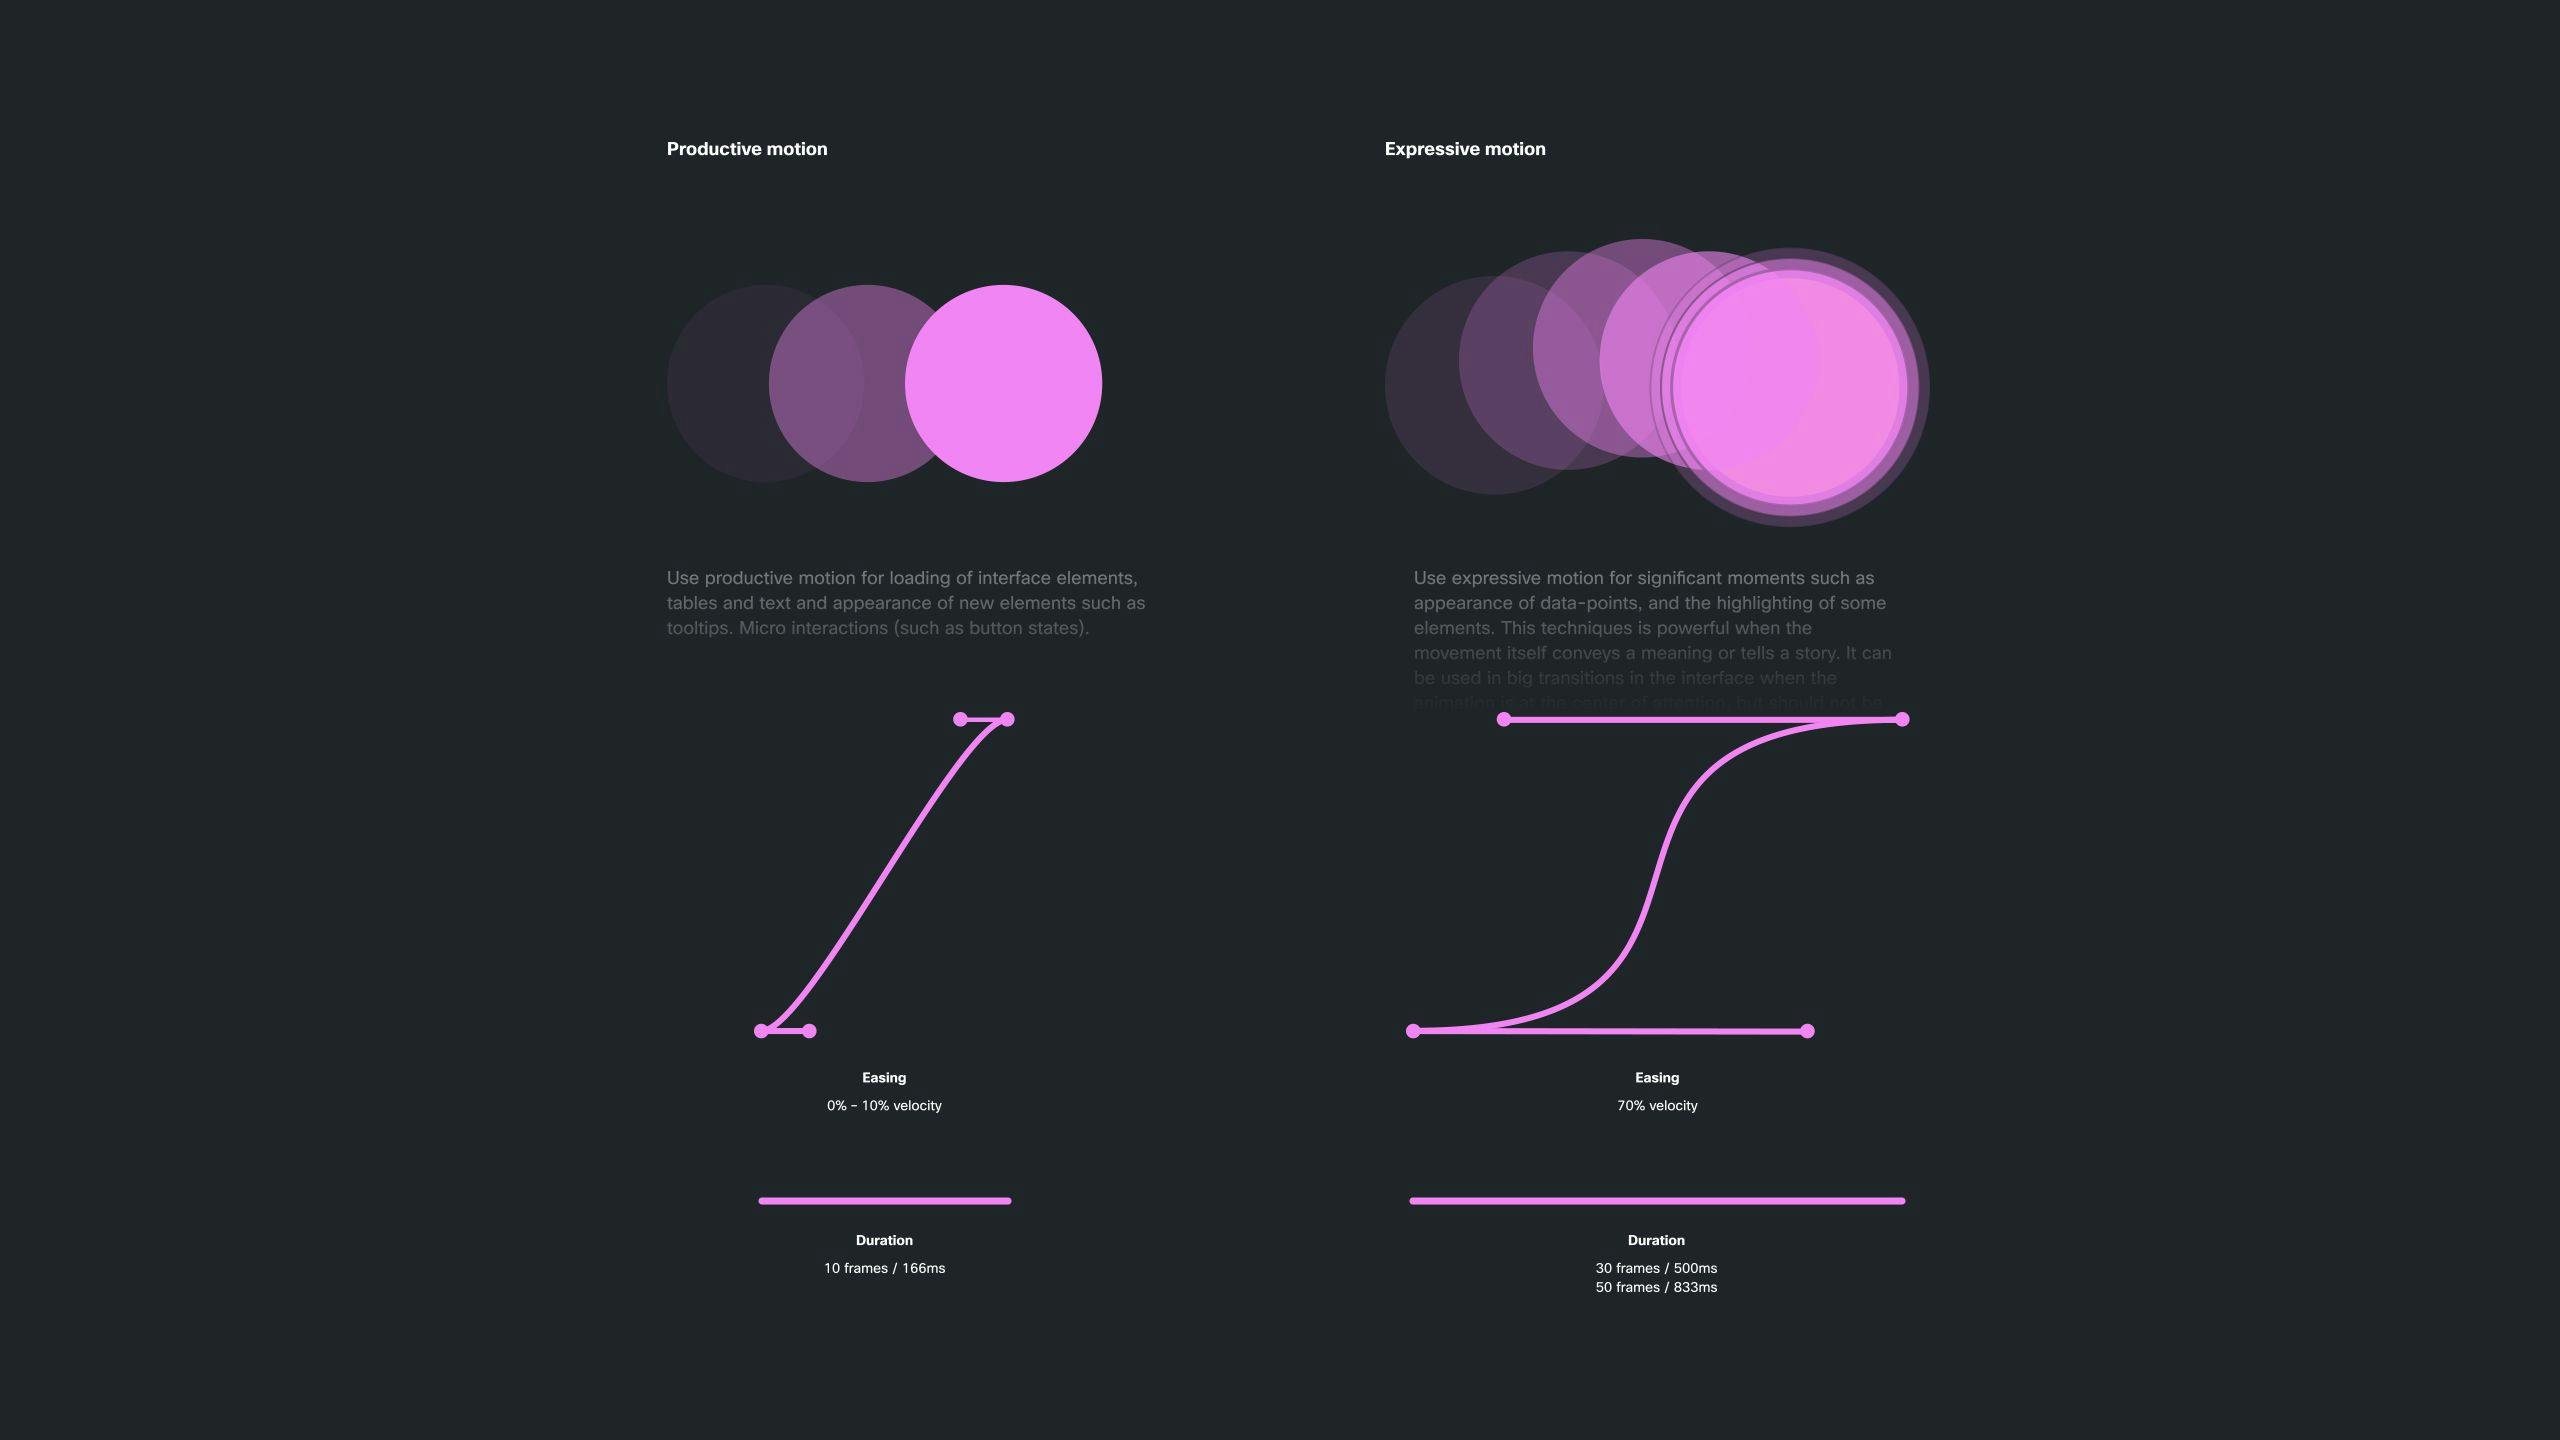
Animations
As part of the design system, we defined motion design rules and best practices. For relevant graphs, we created motion design examples that showcase the motion system in action.
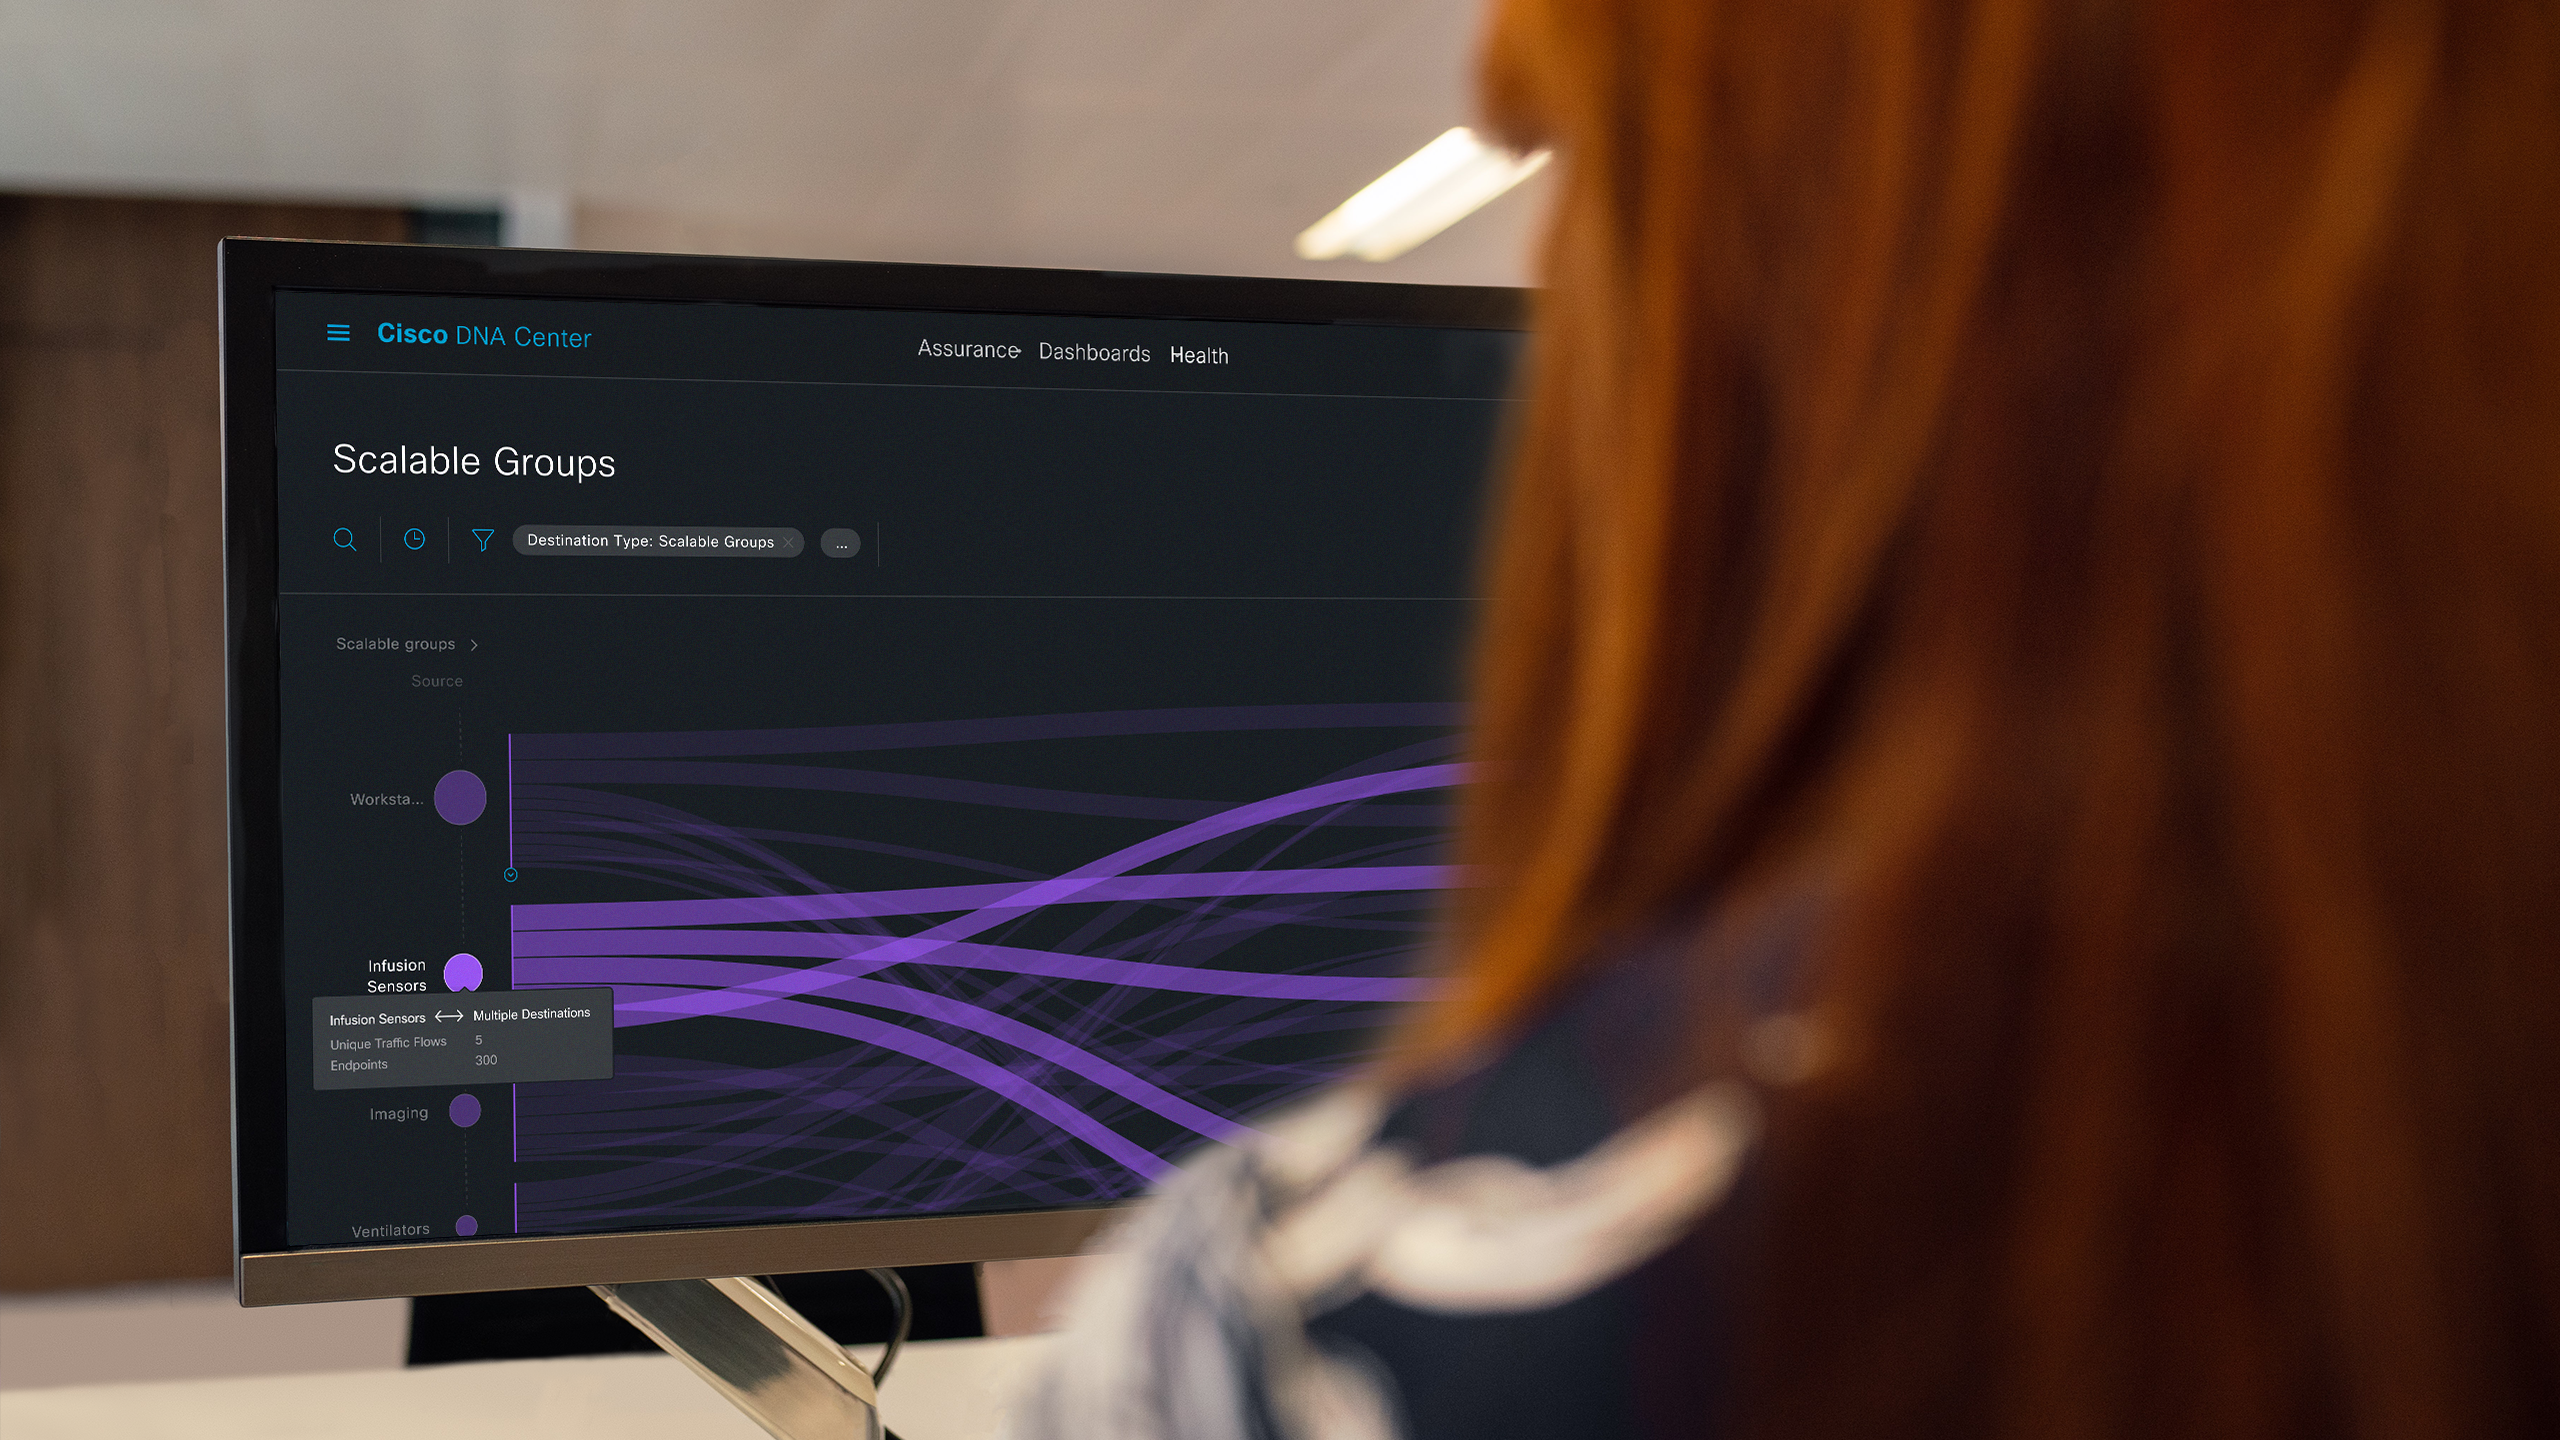
Custom-madedatavisualizations
We also created custom-made data visualizations that cover special topics that are relevant for Cisco: for example, network traffic flows and connectivity matrices.
These tailor-made designs fit the extensive design system that helps to make the data suite complete, and fulfills specific client requirements.
Results
The result is a 160+ page design system containing 135+ designs to kick-start the implementation of the new data design system and data visualization suite. It will allow Cisco to foster more coherent, inspiring, and comprehensible user experiences.
The data design system and style guide contain a suite of next-level, comprehensive data visualizations to integrate with the existing Cisco brand guide. The system provides consistency across graphs and interfaces, now and in the future, and offers better actionability to users.
It has been an immense pleasure to work with CLEVER°FRANKE. They are an extremely talented bunch, very diligent and hard-working! The work is receiving praises from all places.
Neha Joshi / Senior Manager, User Experience, Cisco