Uncovering Chicago’s infrastructure challenges to drive investment decisions
Statistics
- Client
- Chicago Metropolitan Agency for Planning
- Awards
- FWA of the day
- European Design Award – Gold
- The Webby Award – Nominee
- Innovation by Design Award – honorable mention
- Red Dot Design Award – Best of the Best
- Awwwards – honorable mention
- Deliverables
- Microsite
- Interactive data visualizations
The challenge
Chicago Metropolitan Agency for Planning (CMAP) is the regional planning organization for northeastern Illinois counties. CMAP developed and is implementing ‘GO TO 2040’, Chicago’s first comprehensive regional plan in more than 100 years. In the next decade, an increase of over 2 million residents is anticipated in the Chicago area.
To cope with the surge in population, investments must be made to its infrastructure. CMAP asked CLEVER°FRANKE to create an engaging data-rich narrative, that helps CMAP educate policymakers, media, business leaders, and the general public about the ‘what and why’ behind the plan’s coordinated strategies to help the region’s 284 communities tackle mobility issues.
Value delivered
Creating a single source that provides different ways to turn complex data into engaging stories to shape the public discussion about Chicago’s infrastructure. This has enabled CMAP to communicate the ‘what and why’ behind their plans and get the attention they needed for the investments.
Background
CMAP wanted to find a way to convey facts, insights and improvements to the city’s infrastructure that would reach as wide an audience as possible. Working with CMAP’s statisticians to discover what would be possible with the data they had, we researched how to communicate with the target audience.
Subsequently, we determined that a microsite would be the most efficient and effective method to reach the target audience while simultaneously providing a source-based knowledge platform for the media.

Phases and toolkit items used
Solution
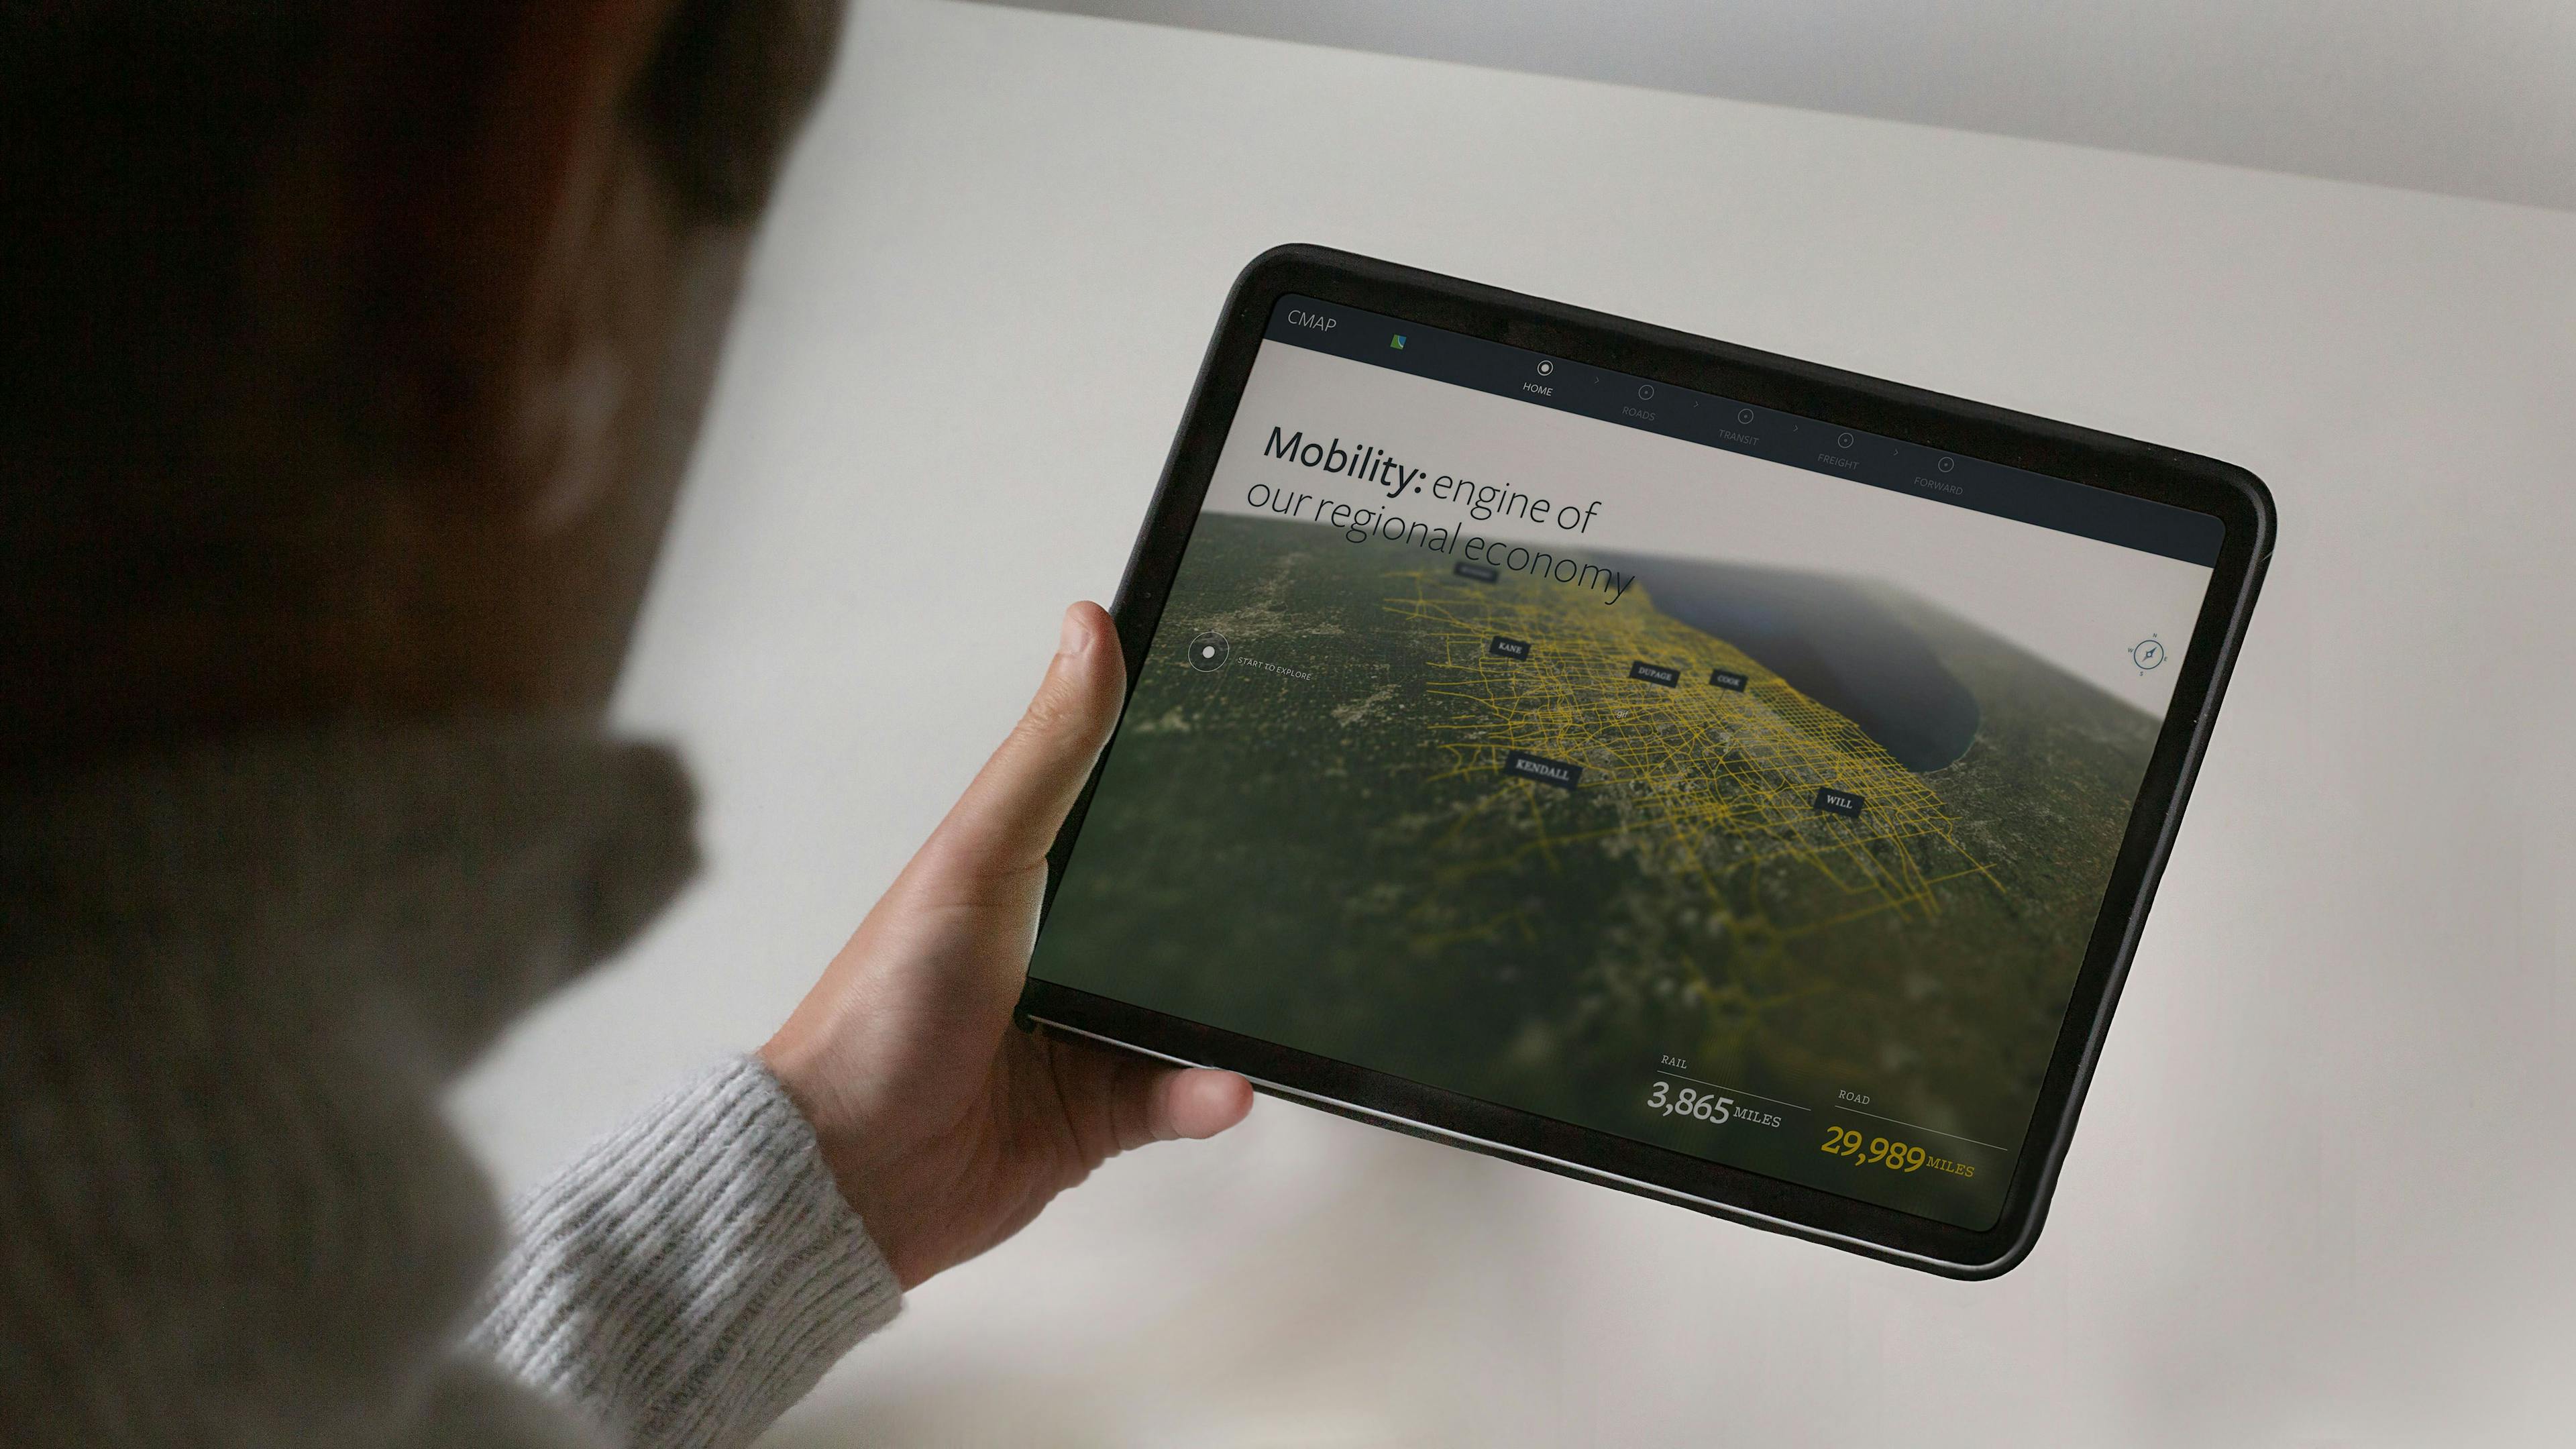
Homepage
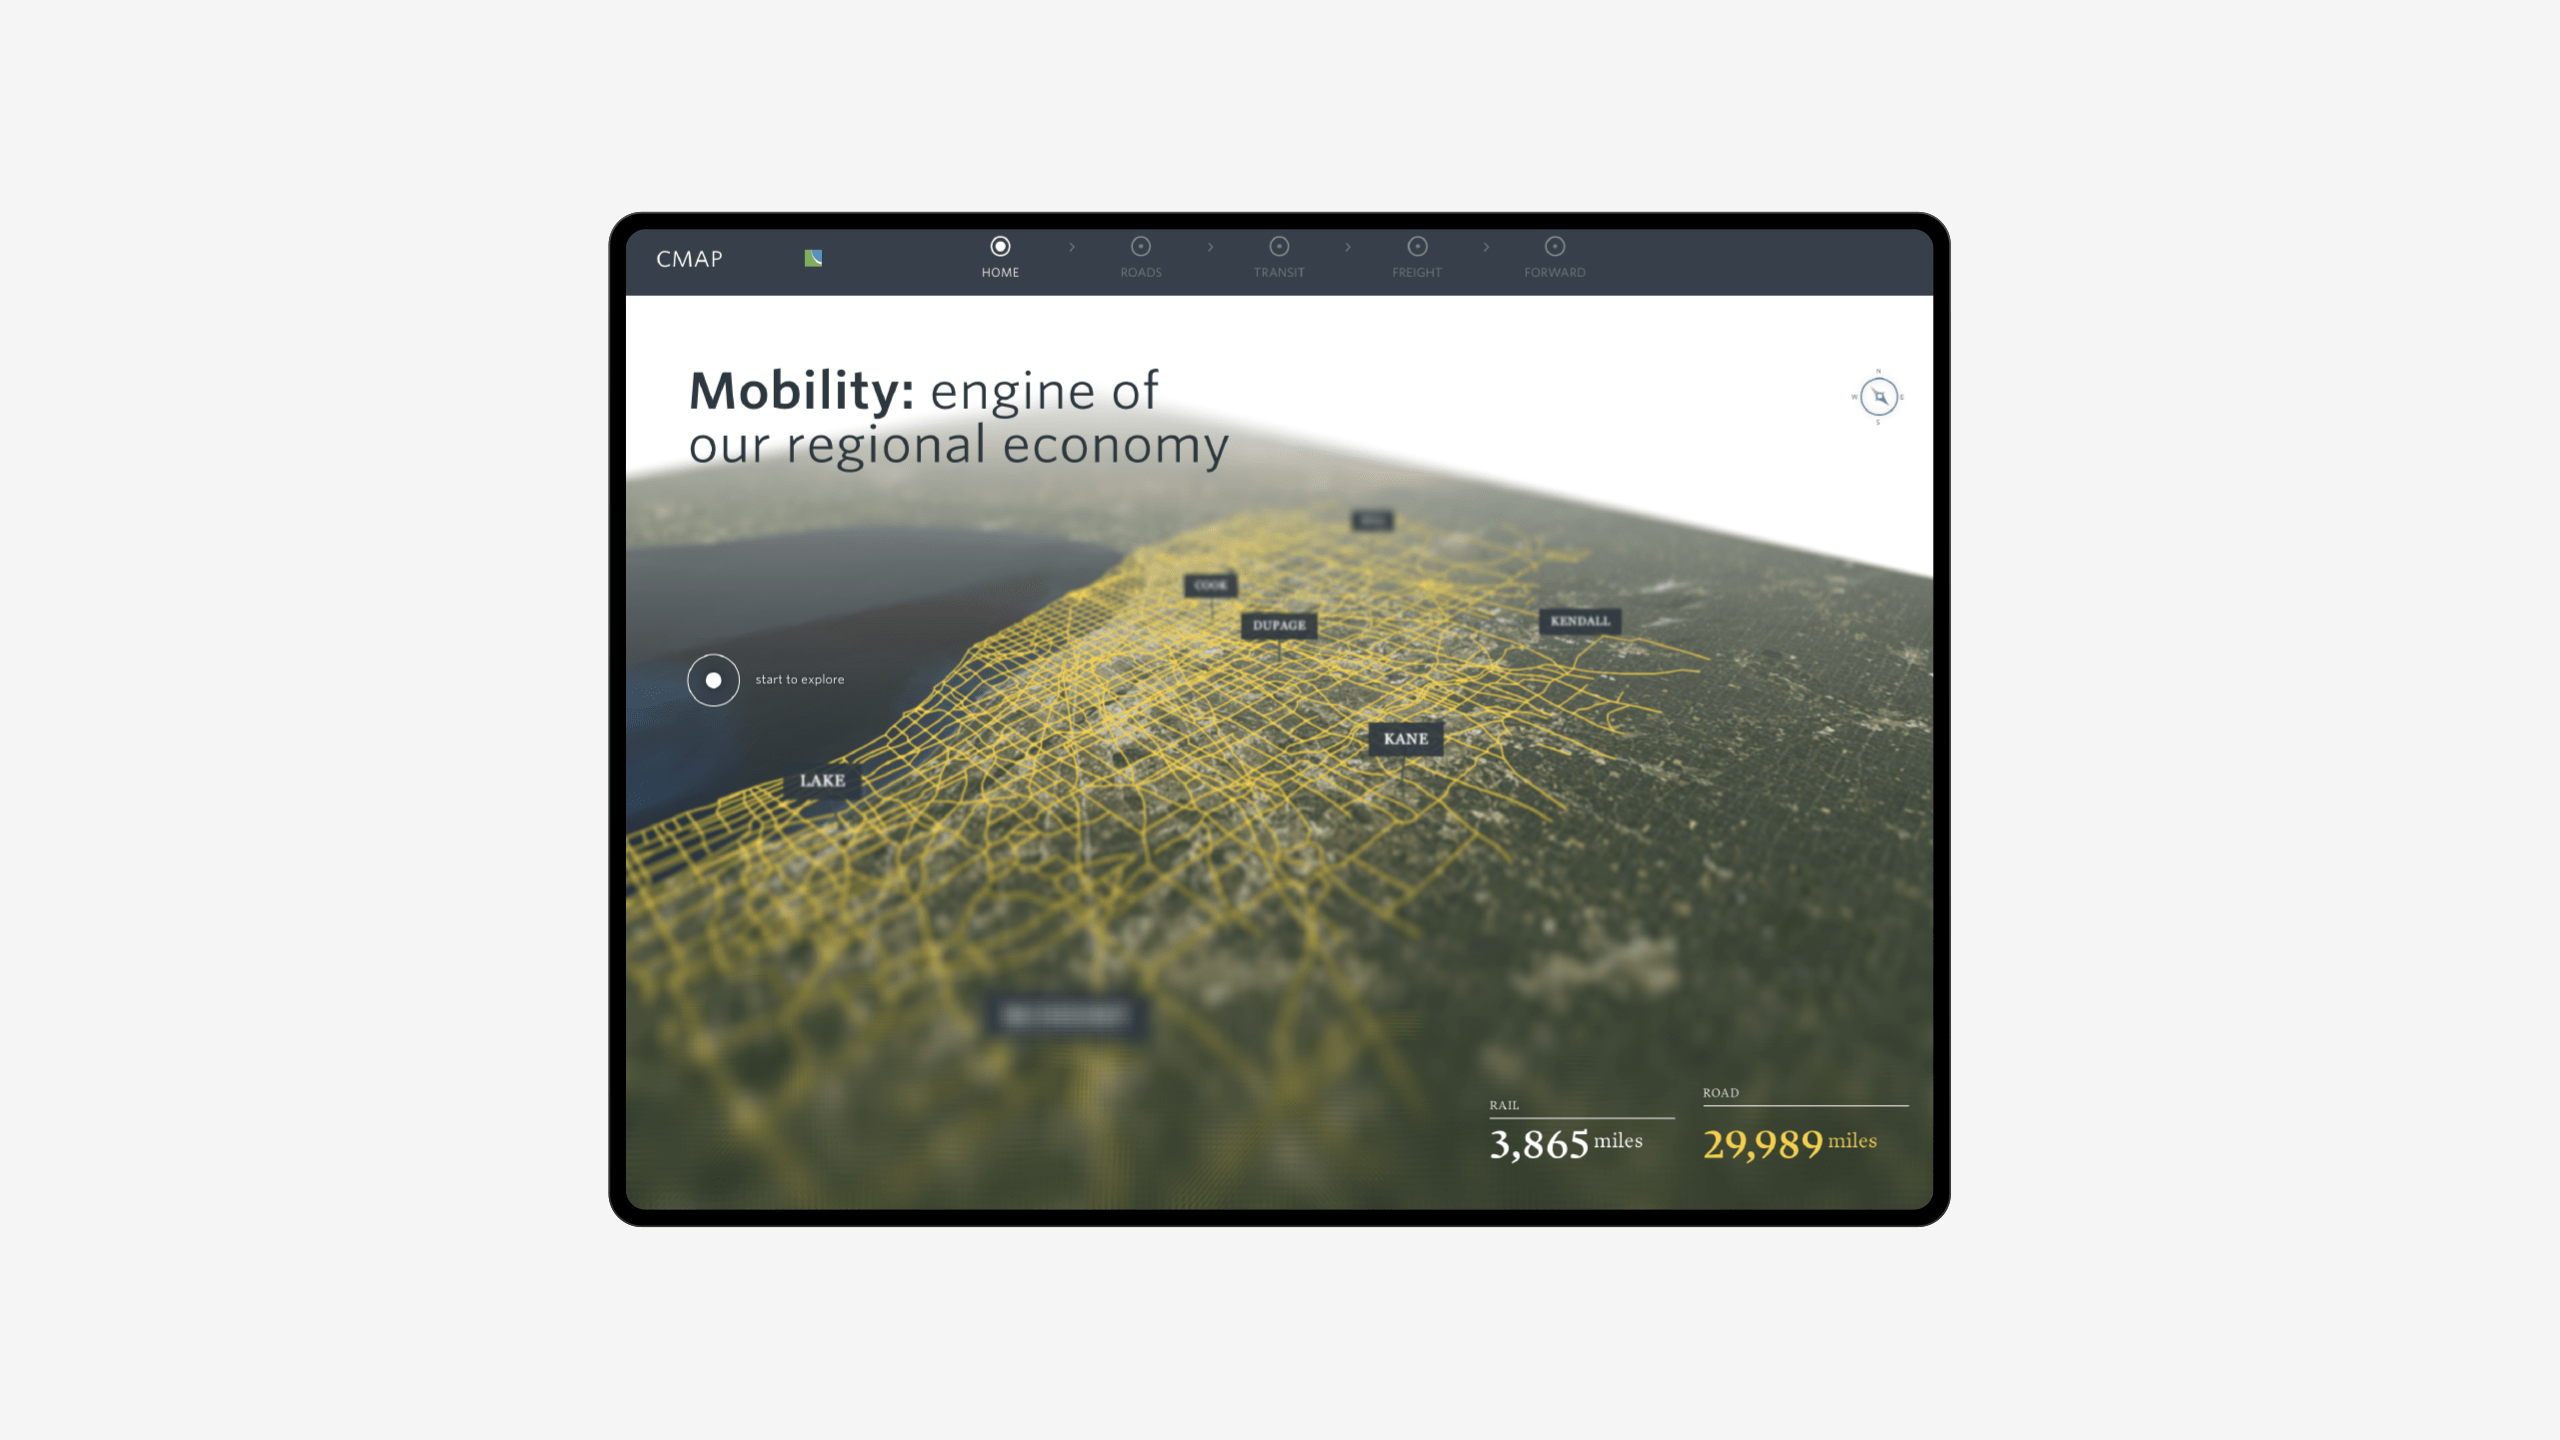
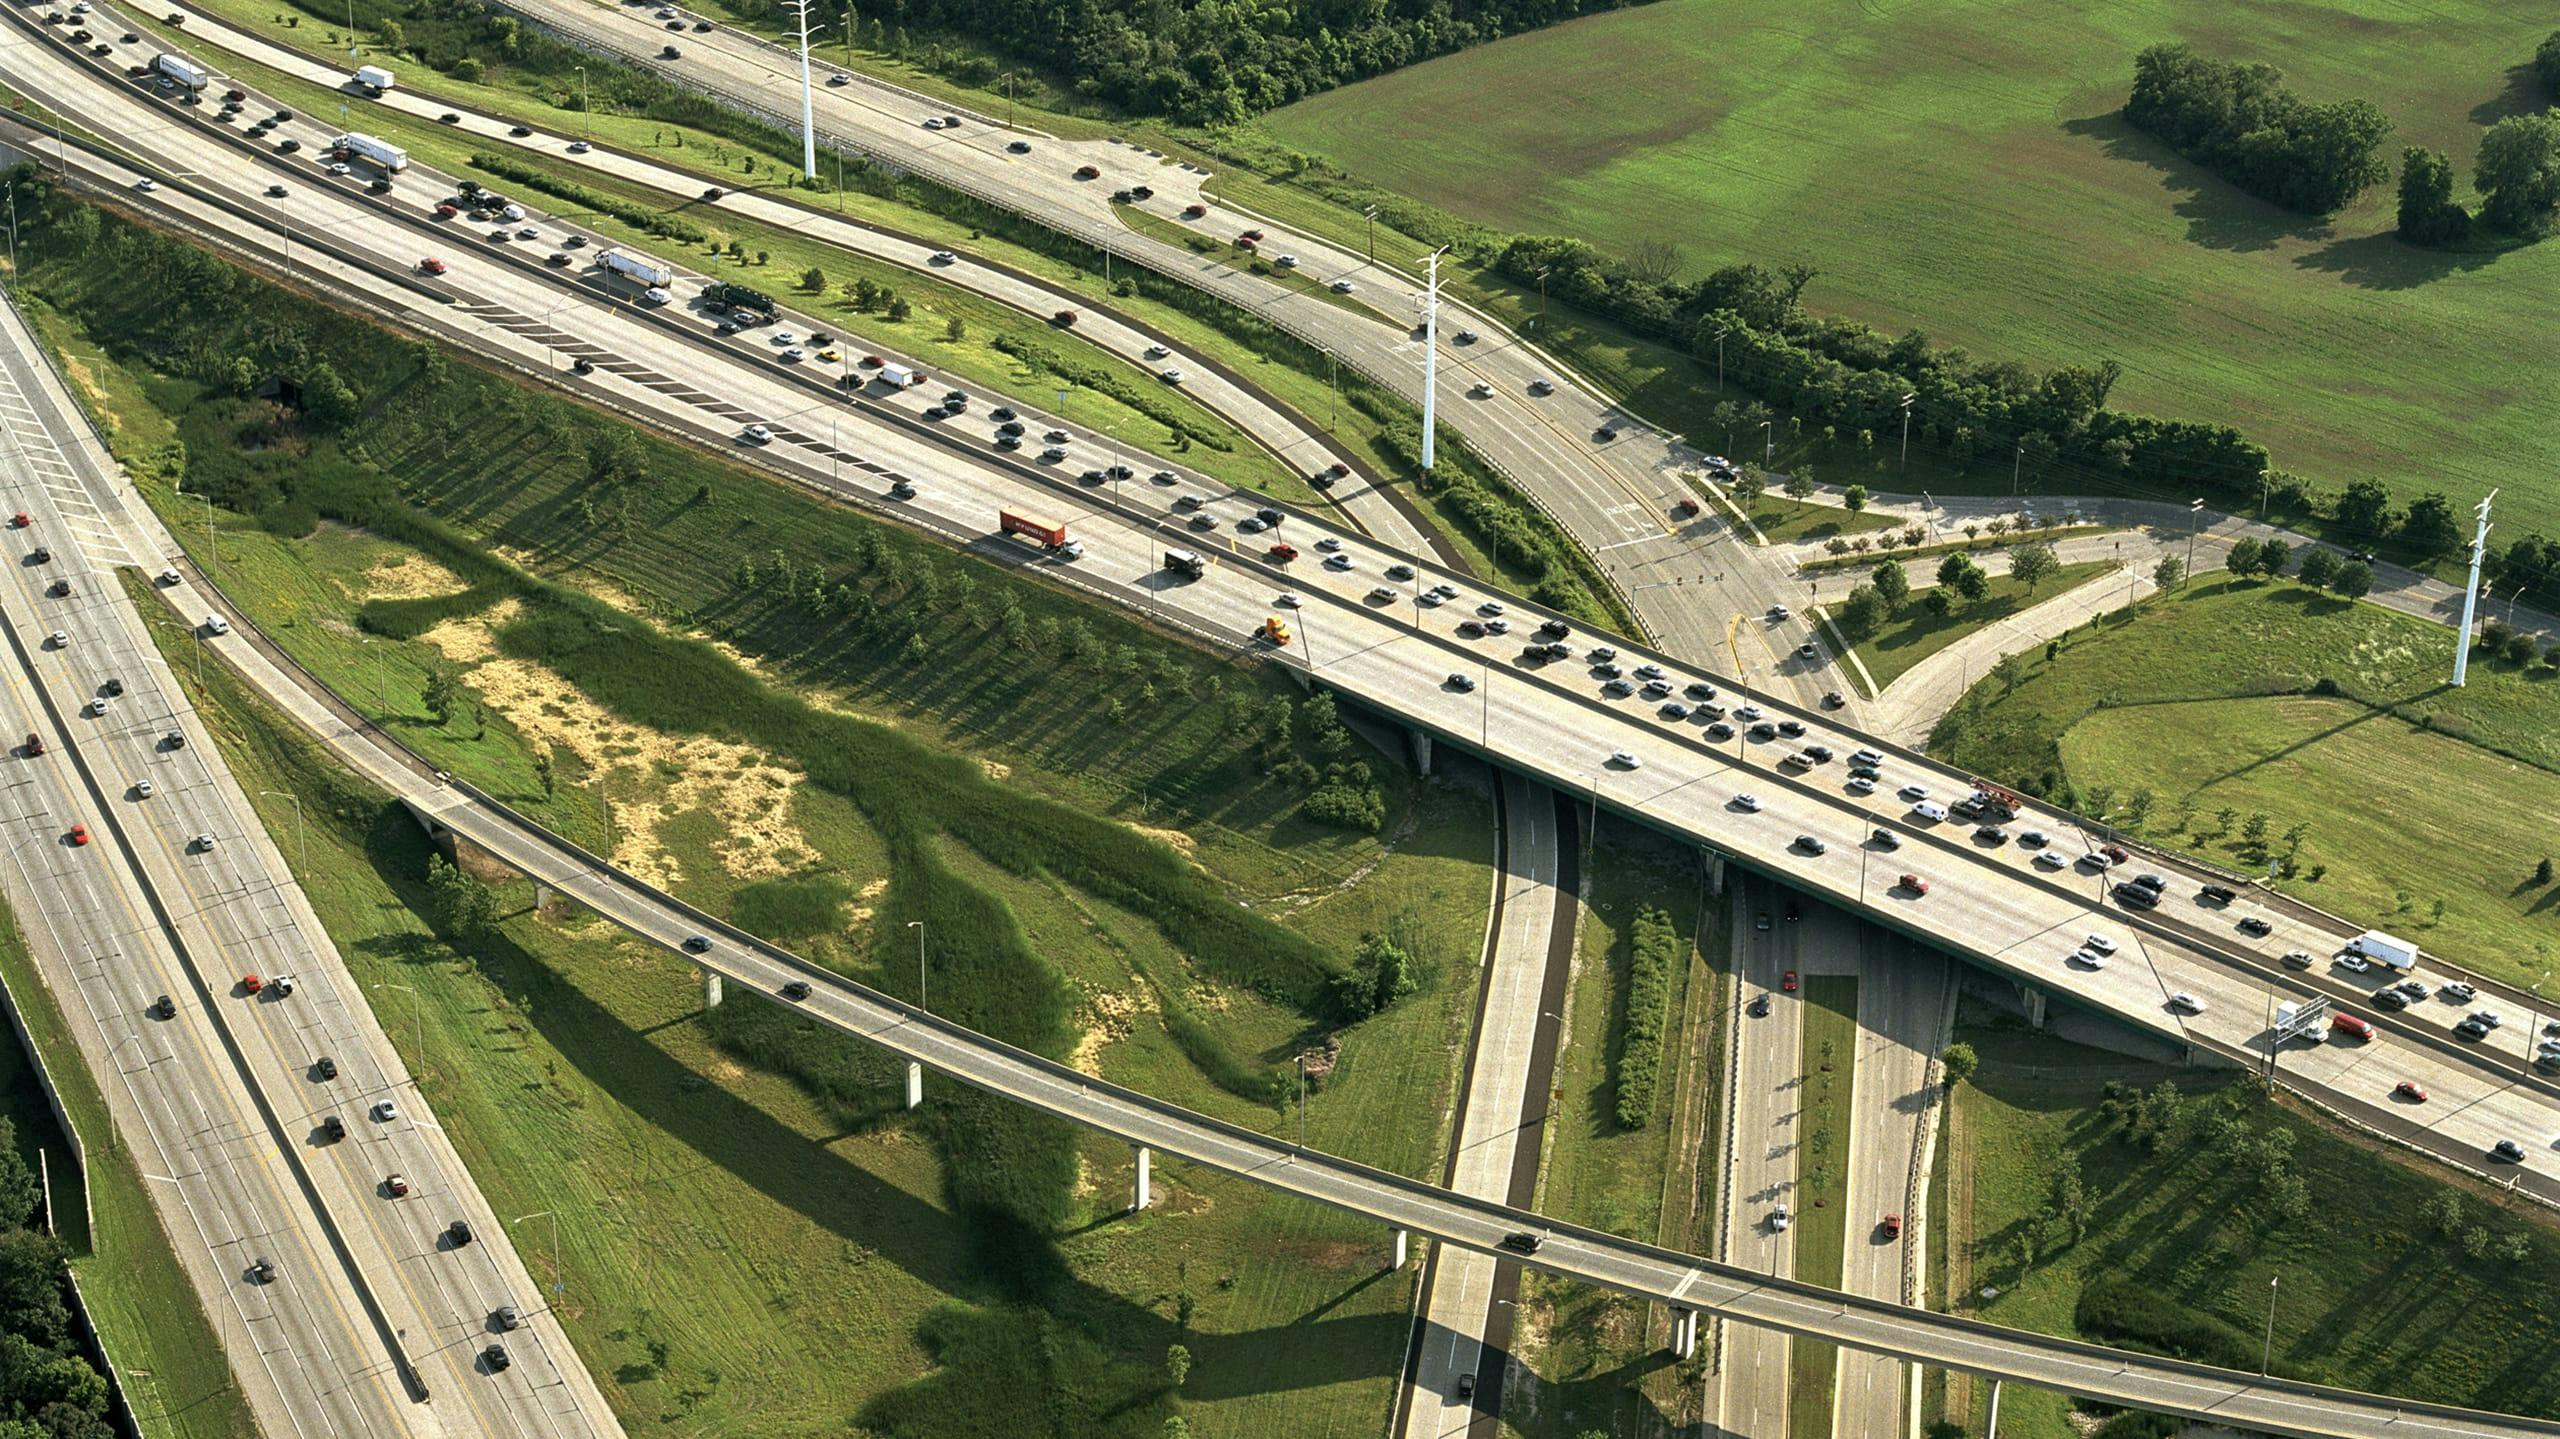
Opening on a bird’s eye view of the Chicago metropolitan area, the layered content creates a pleasant user experience reinforced with striking aerial photography. As the user zooms in, the content zooms in as well. Detailed maps are presented and mobility issues are explained through video shots at a street level.
Pagestructure
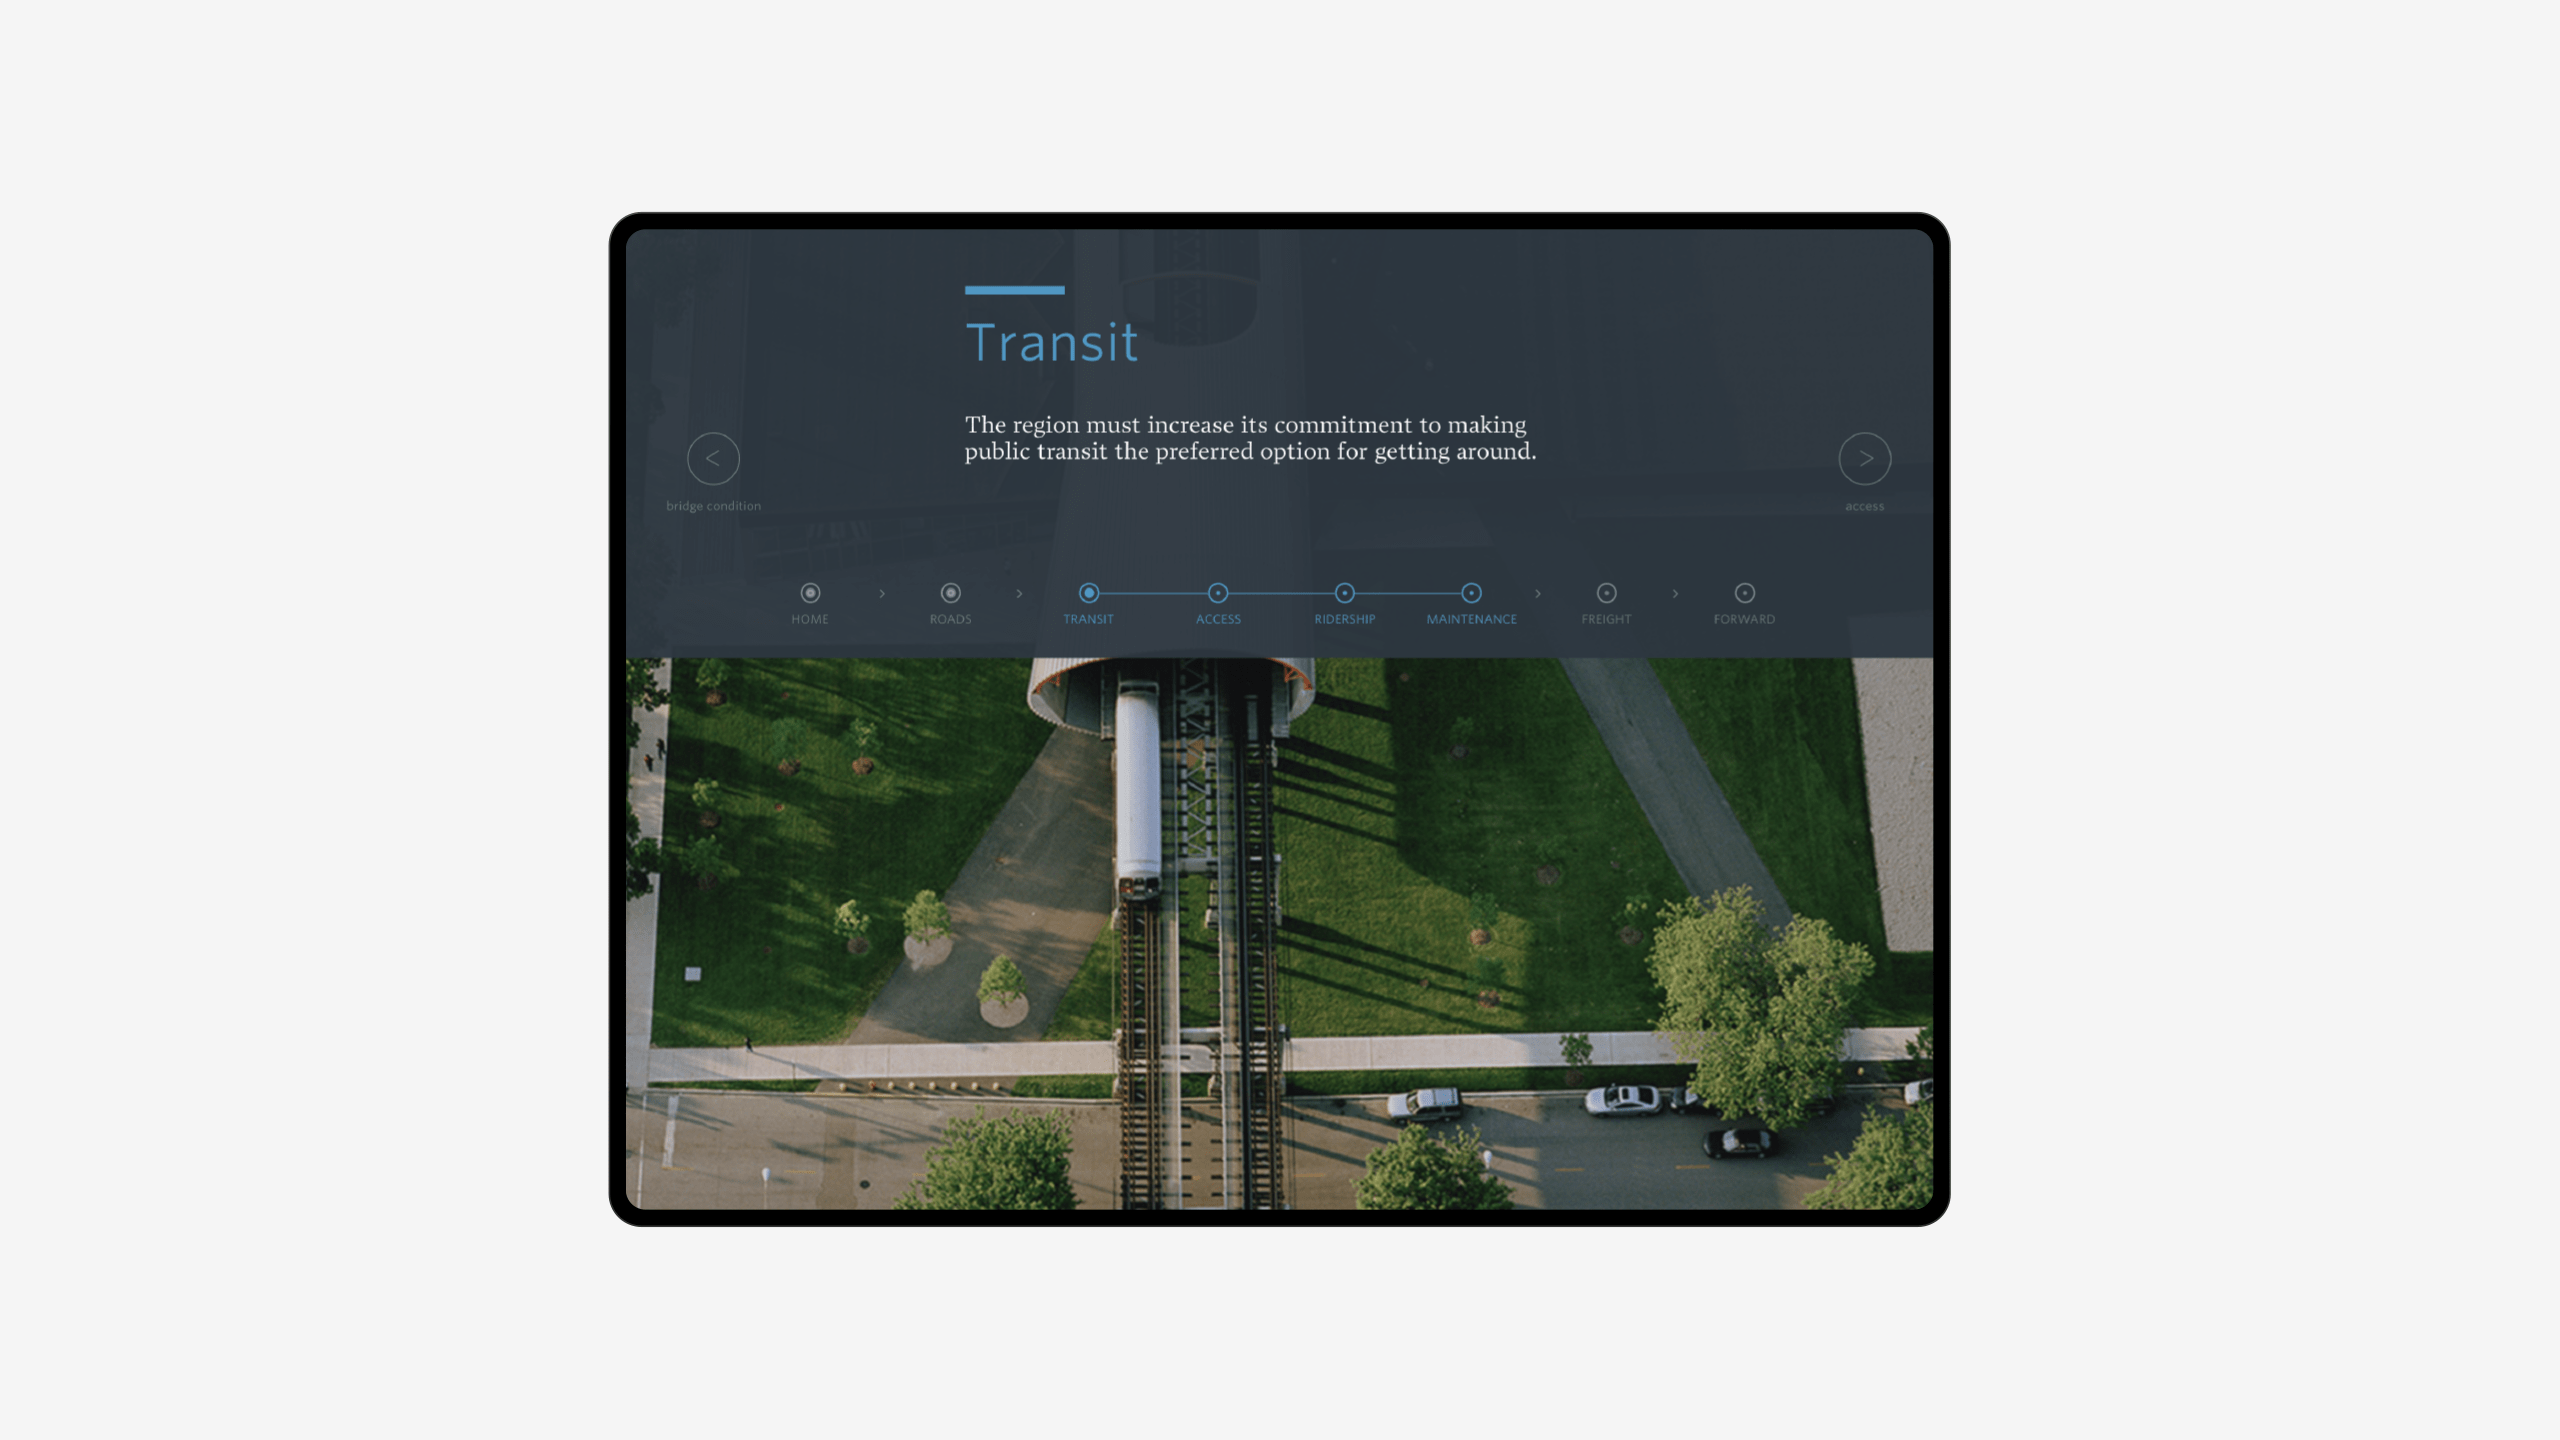
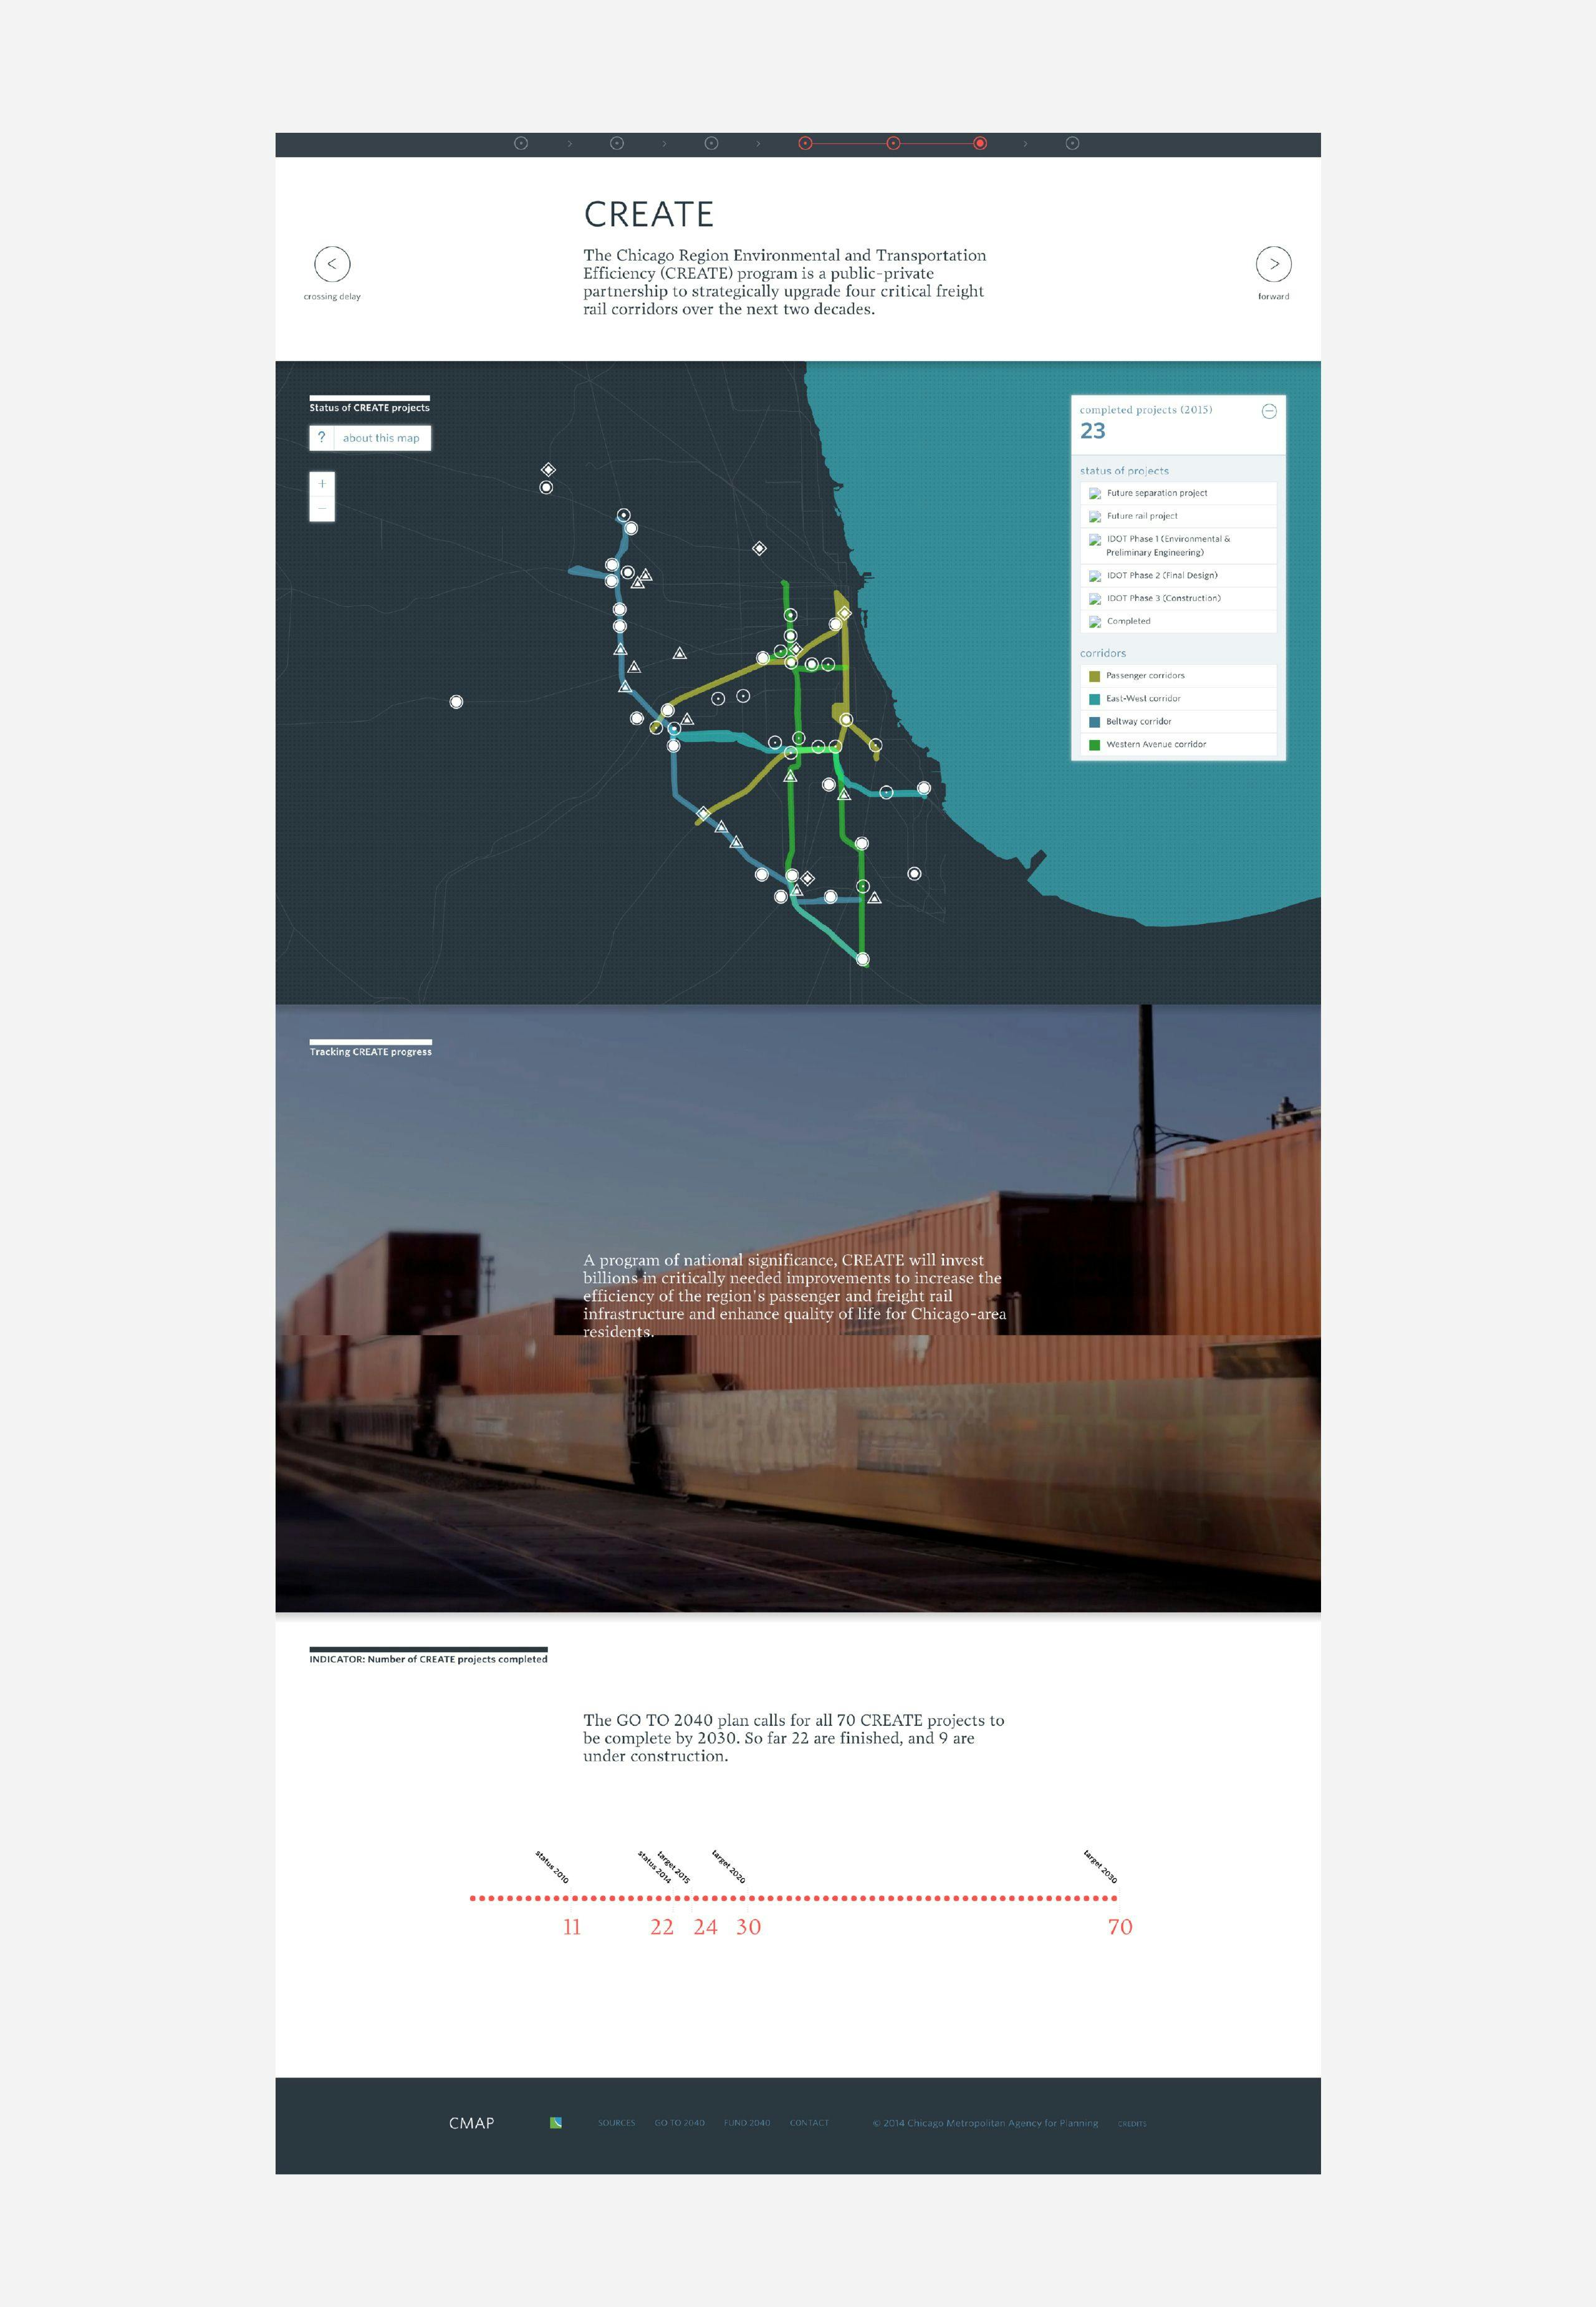
Every page covering a specific part of the infrastructure has a similar setup and elements:
- A short introduction
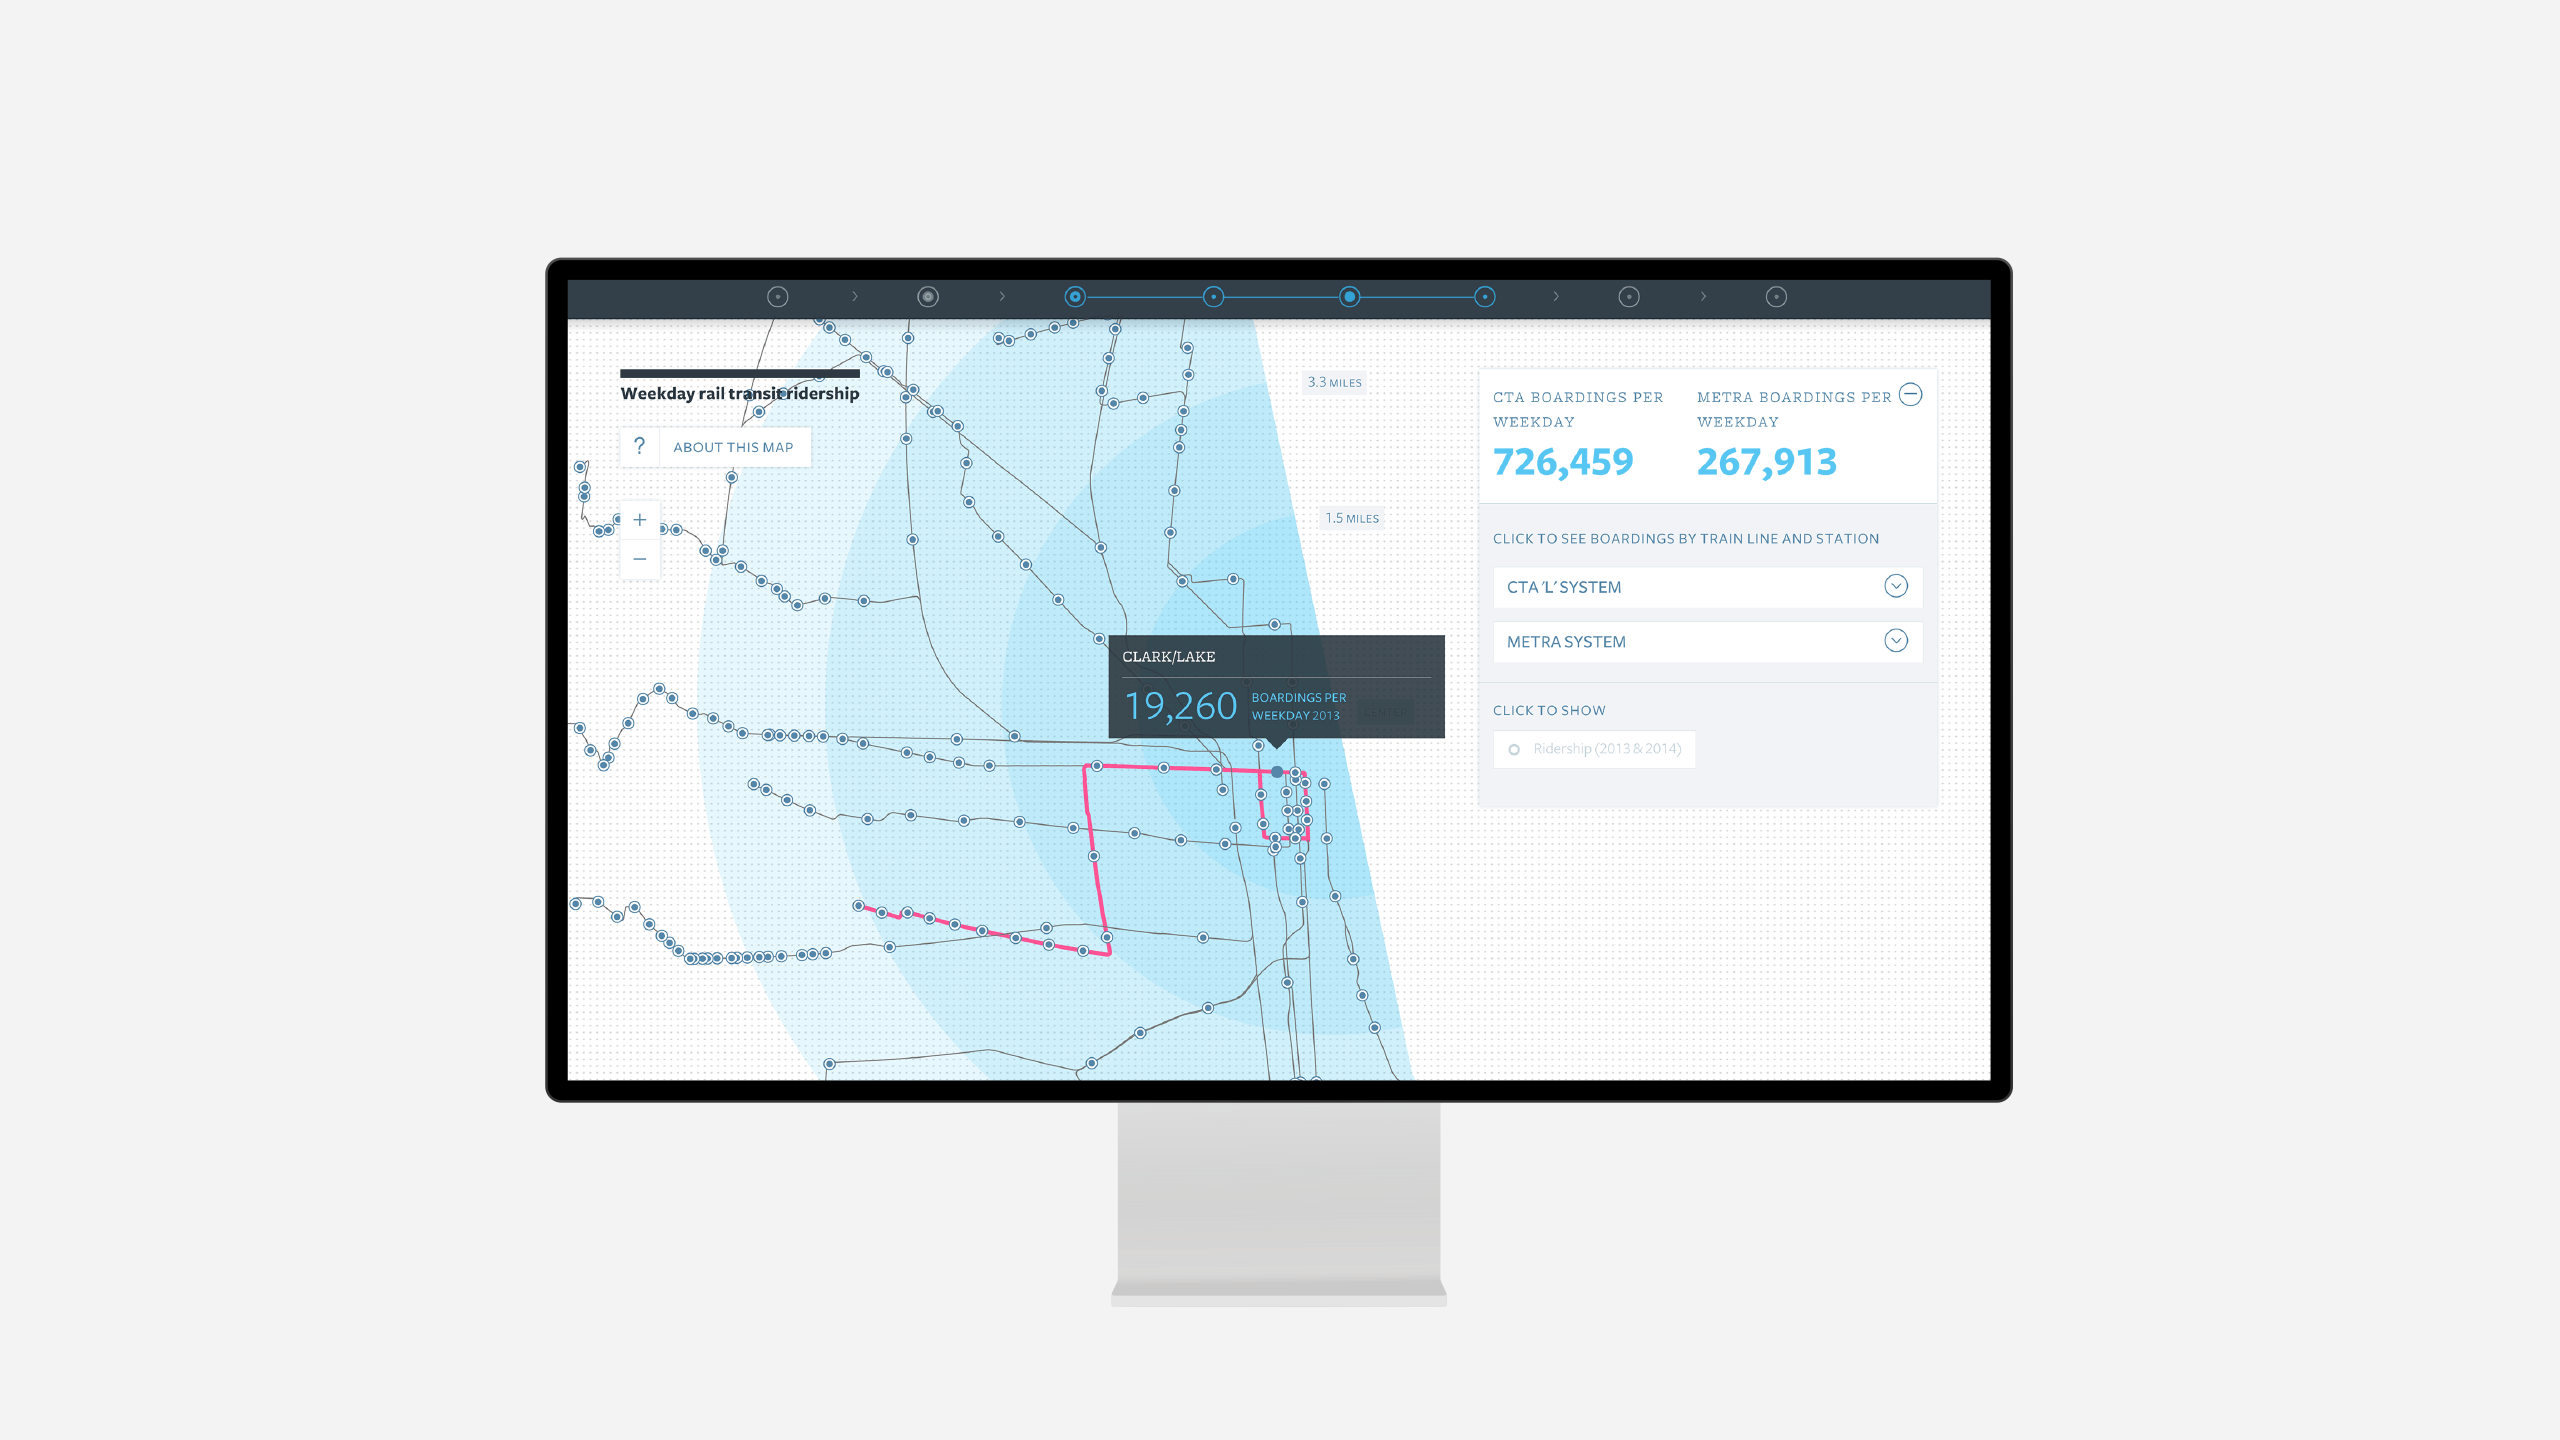
- A zoomable data visualization
- A time-lapse movie showcasing the topic
- Charts and graphs of proposed targets to improve the conditions
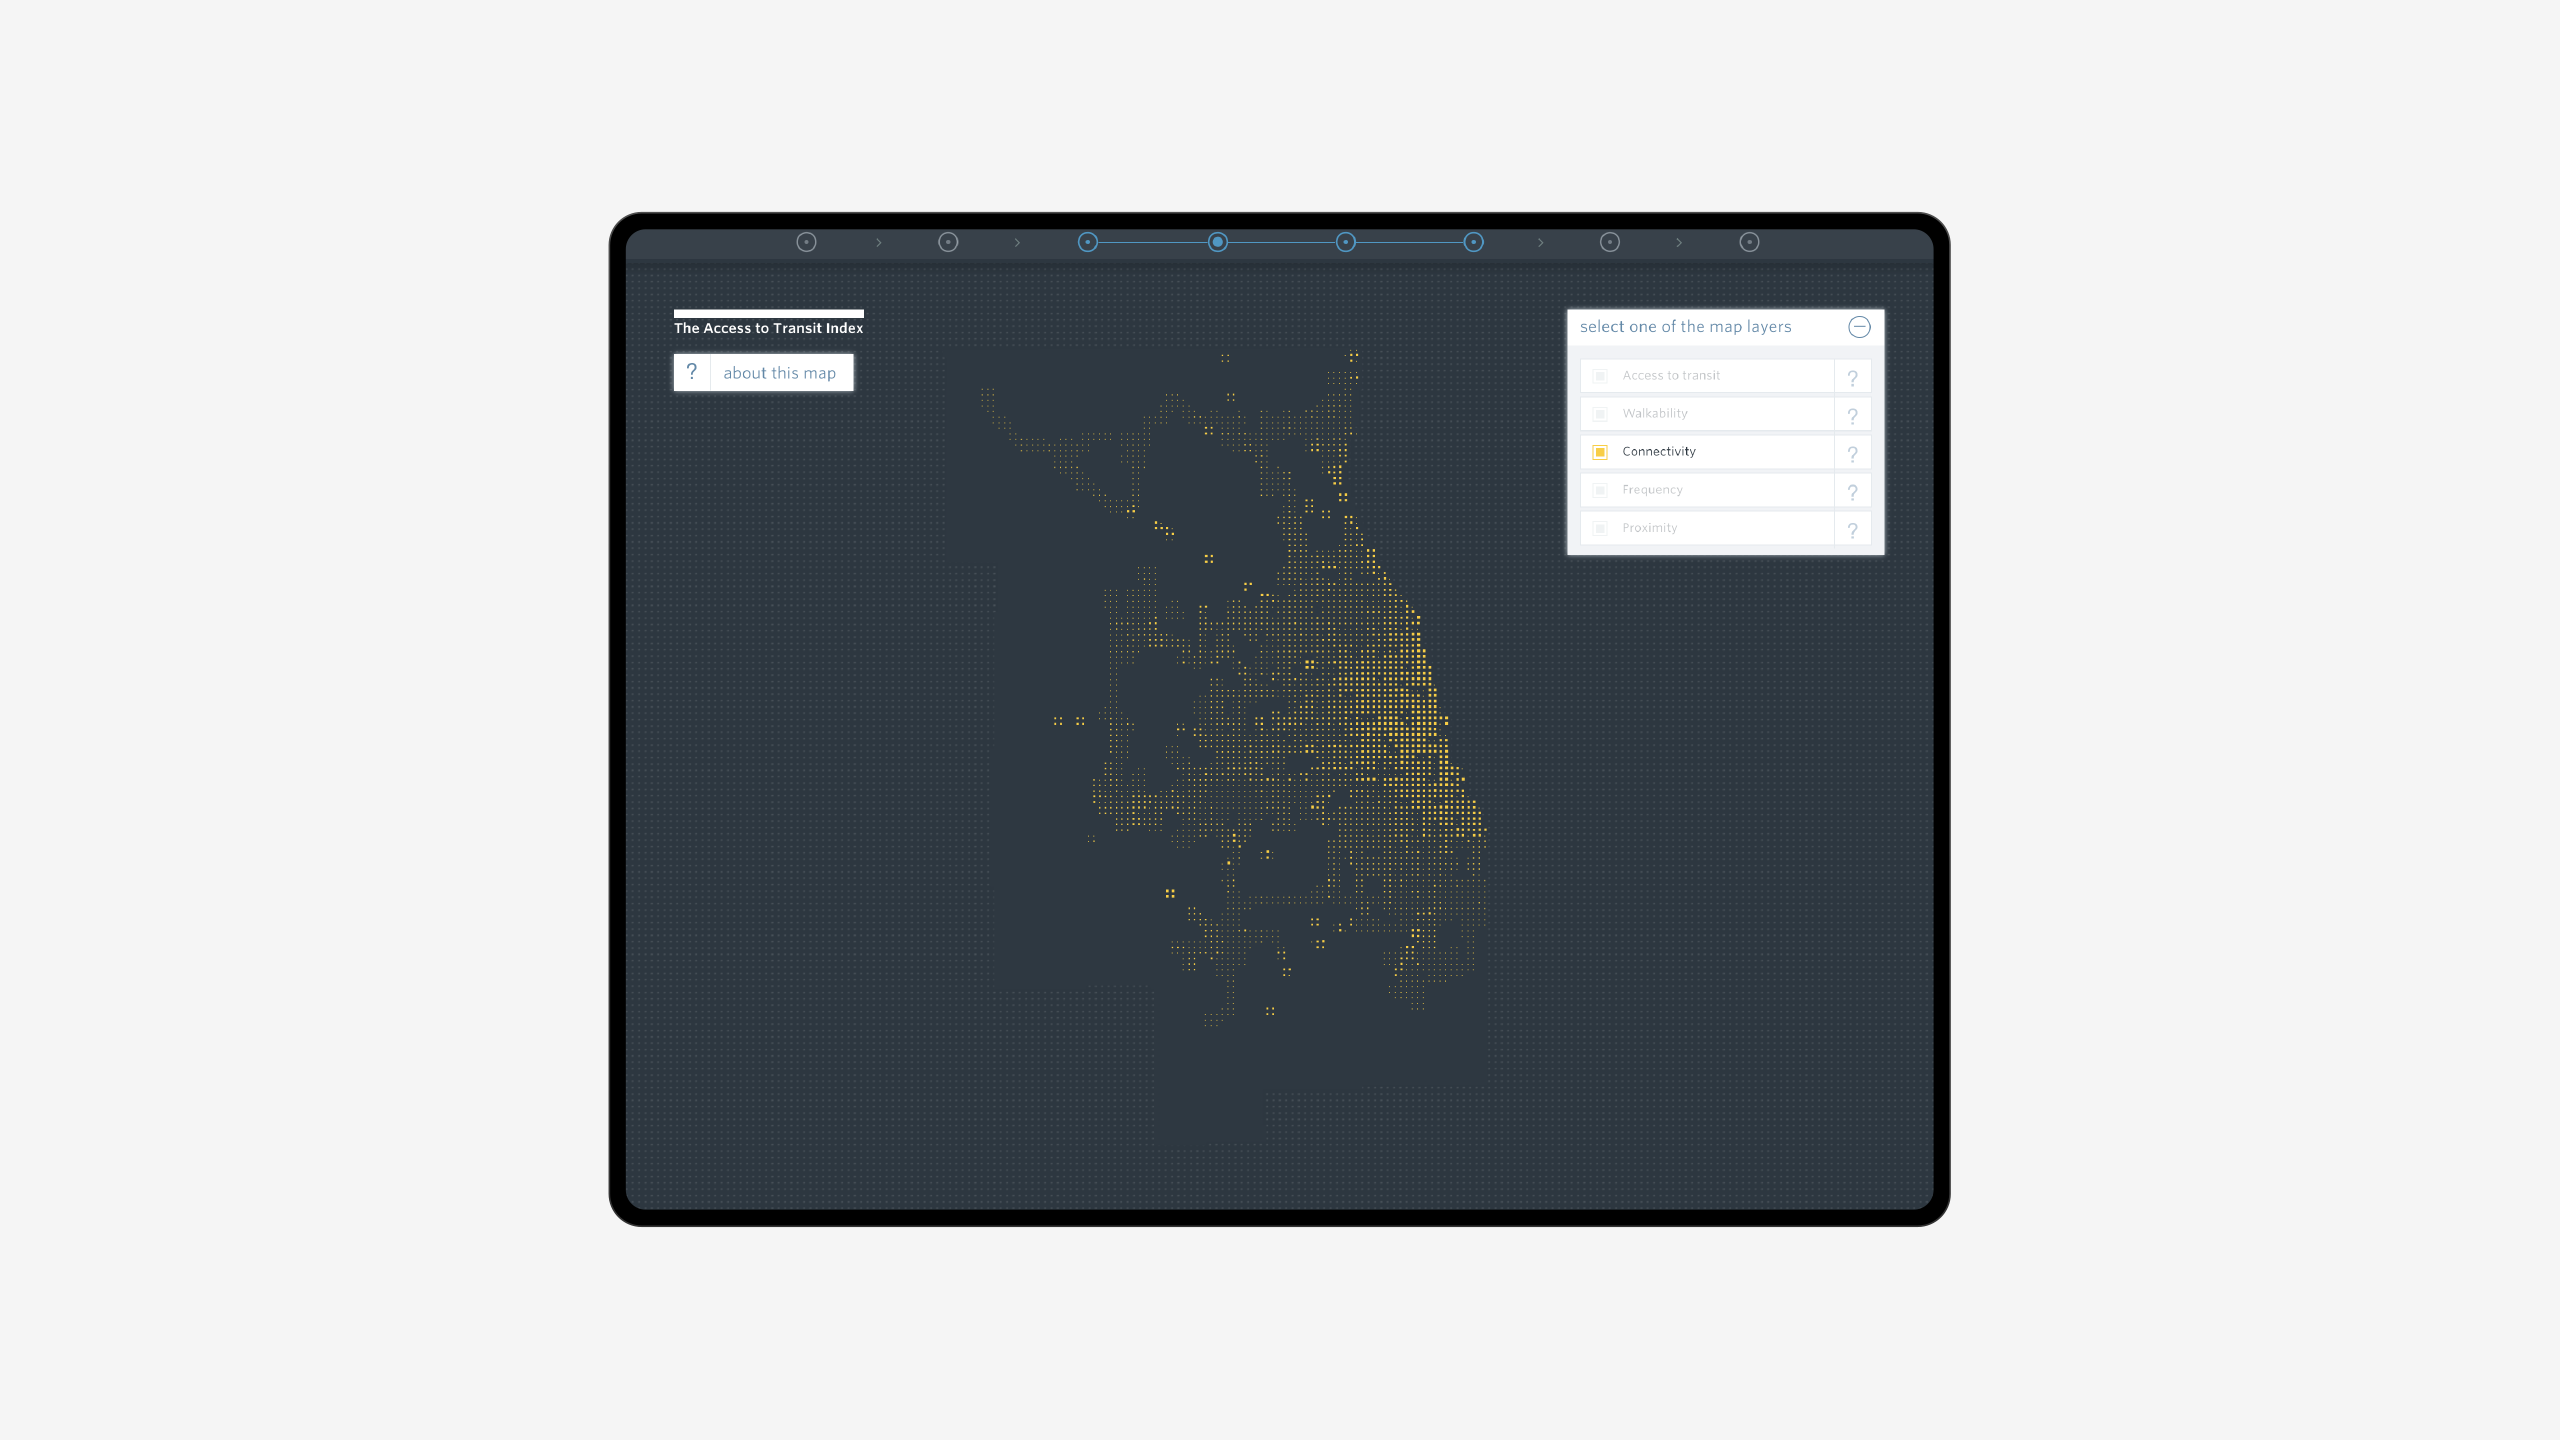
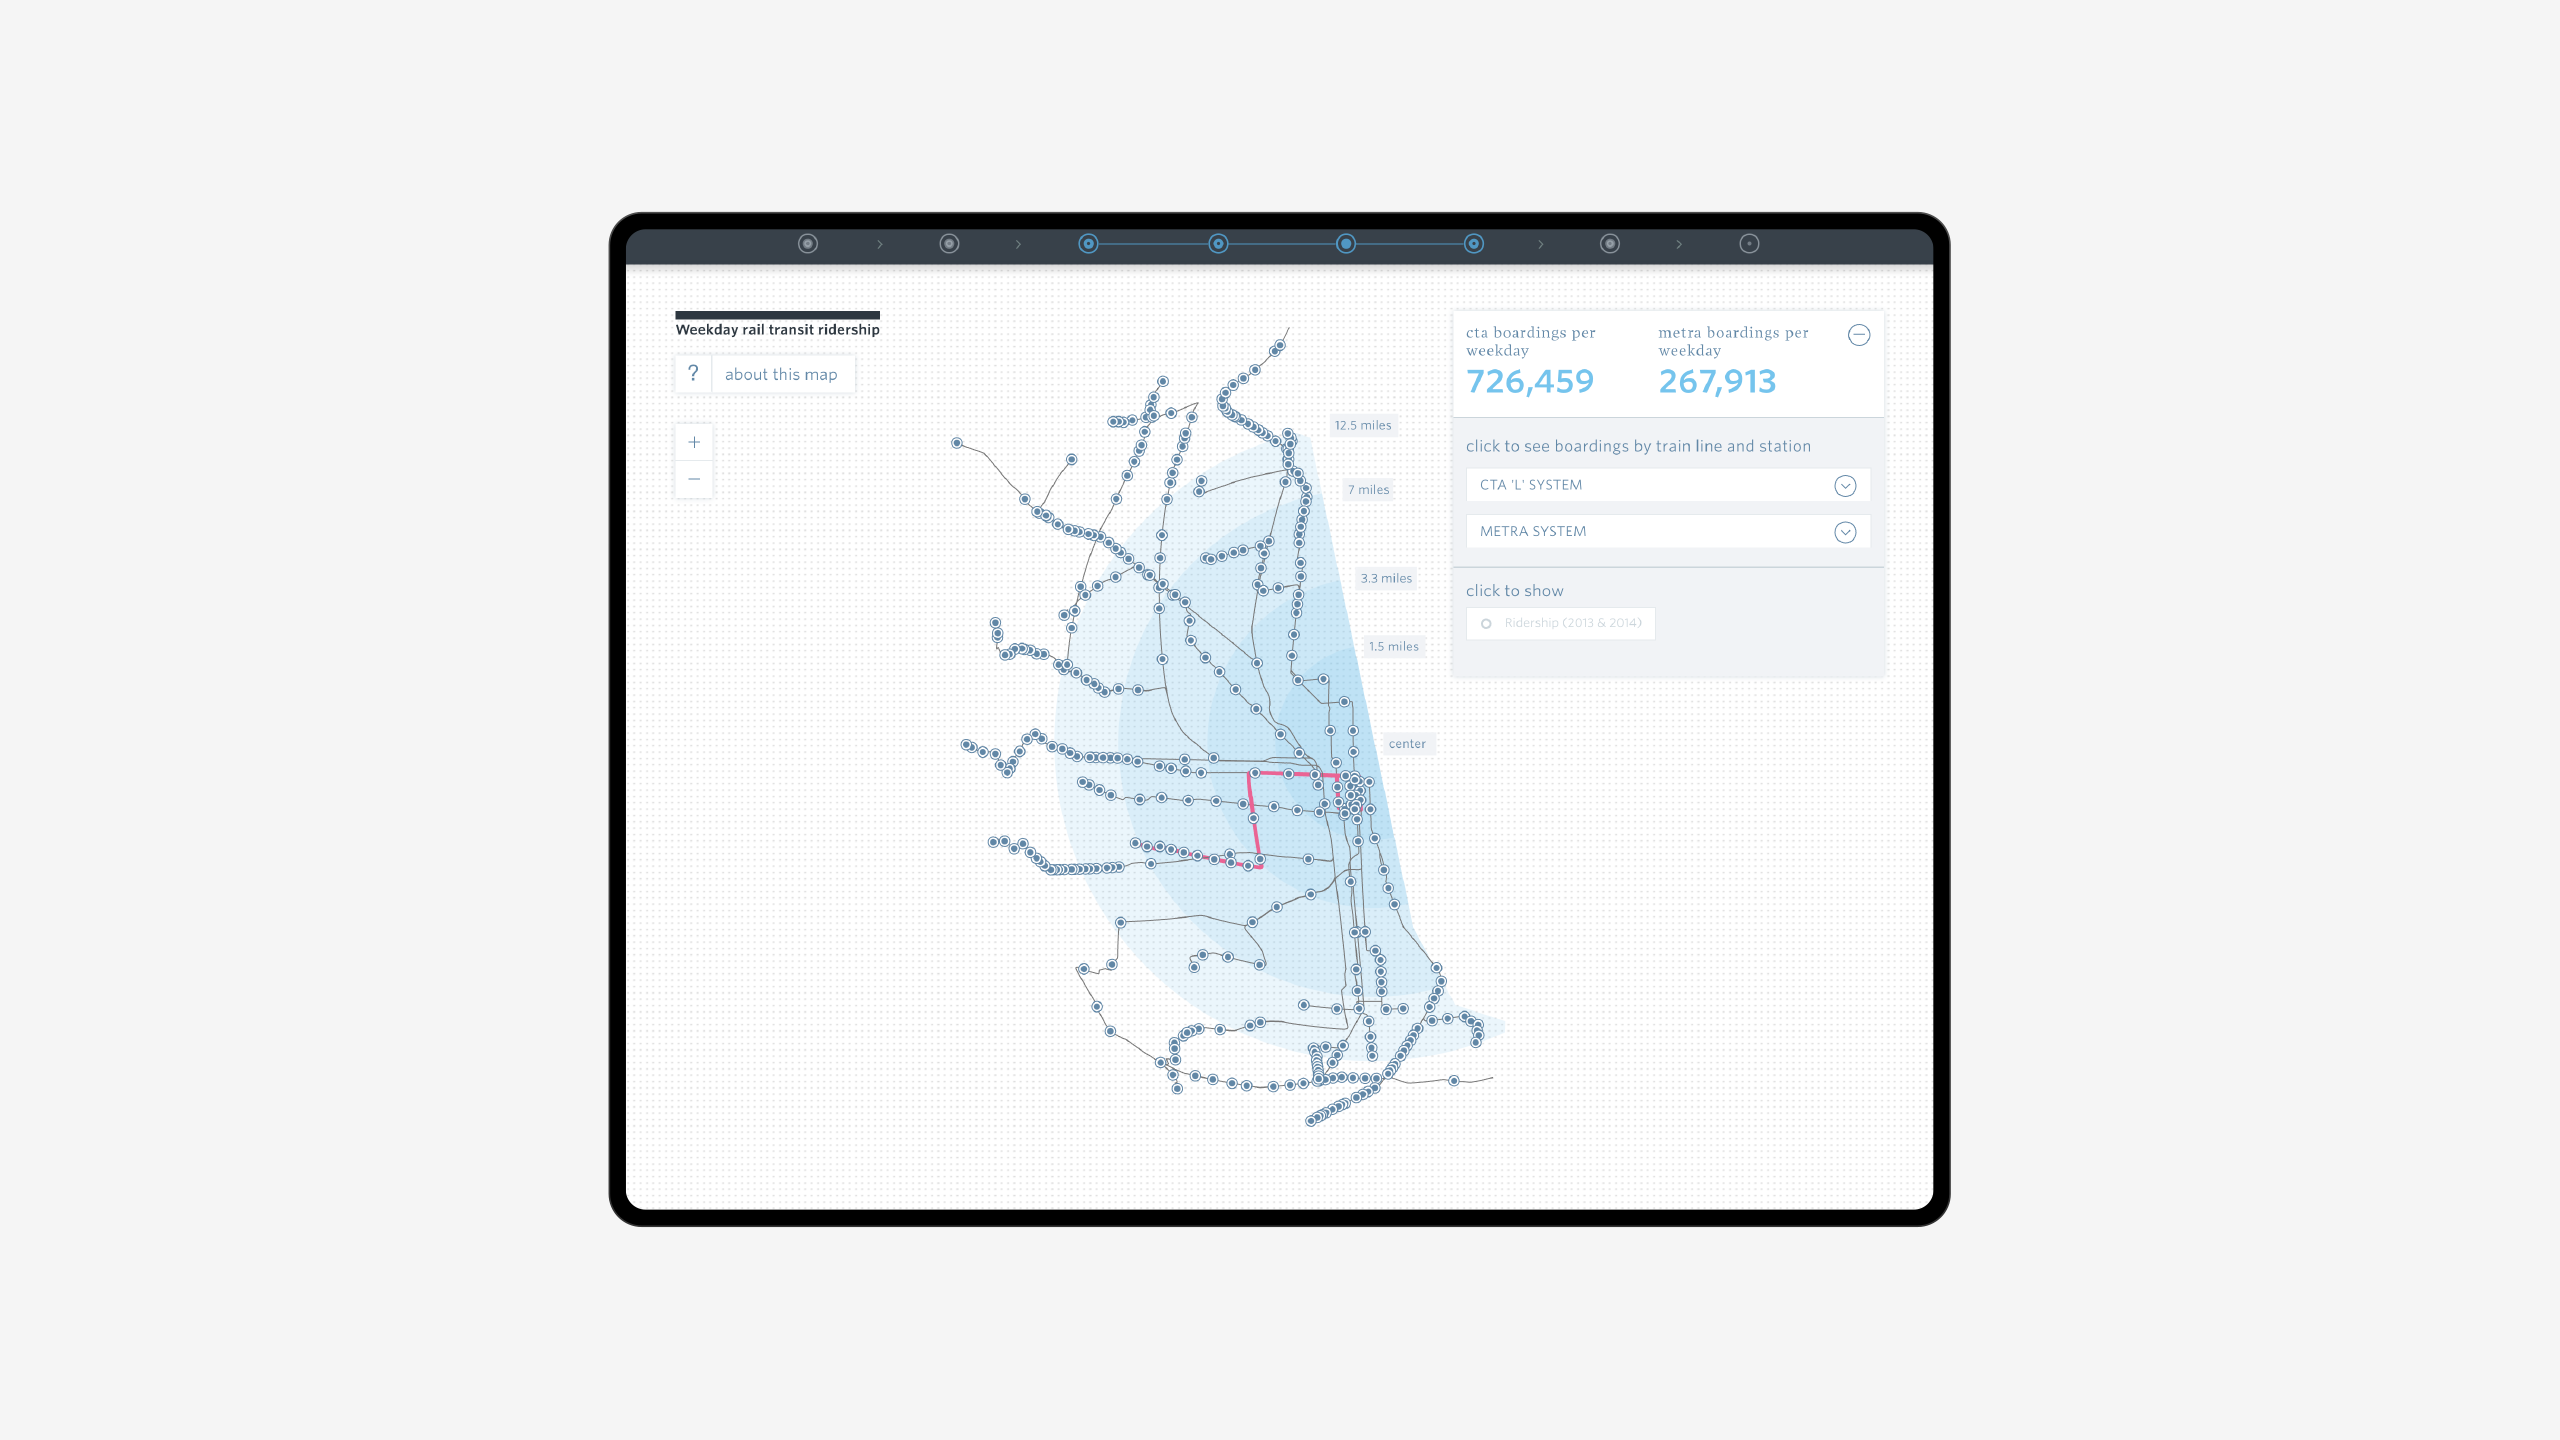
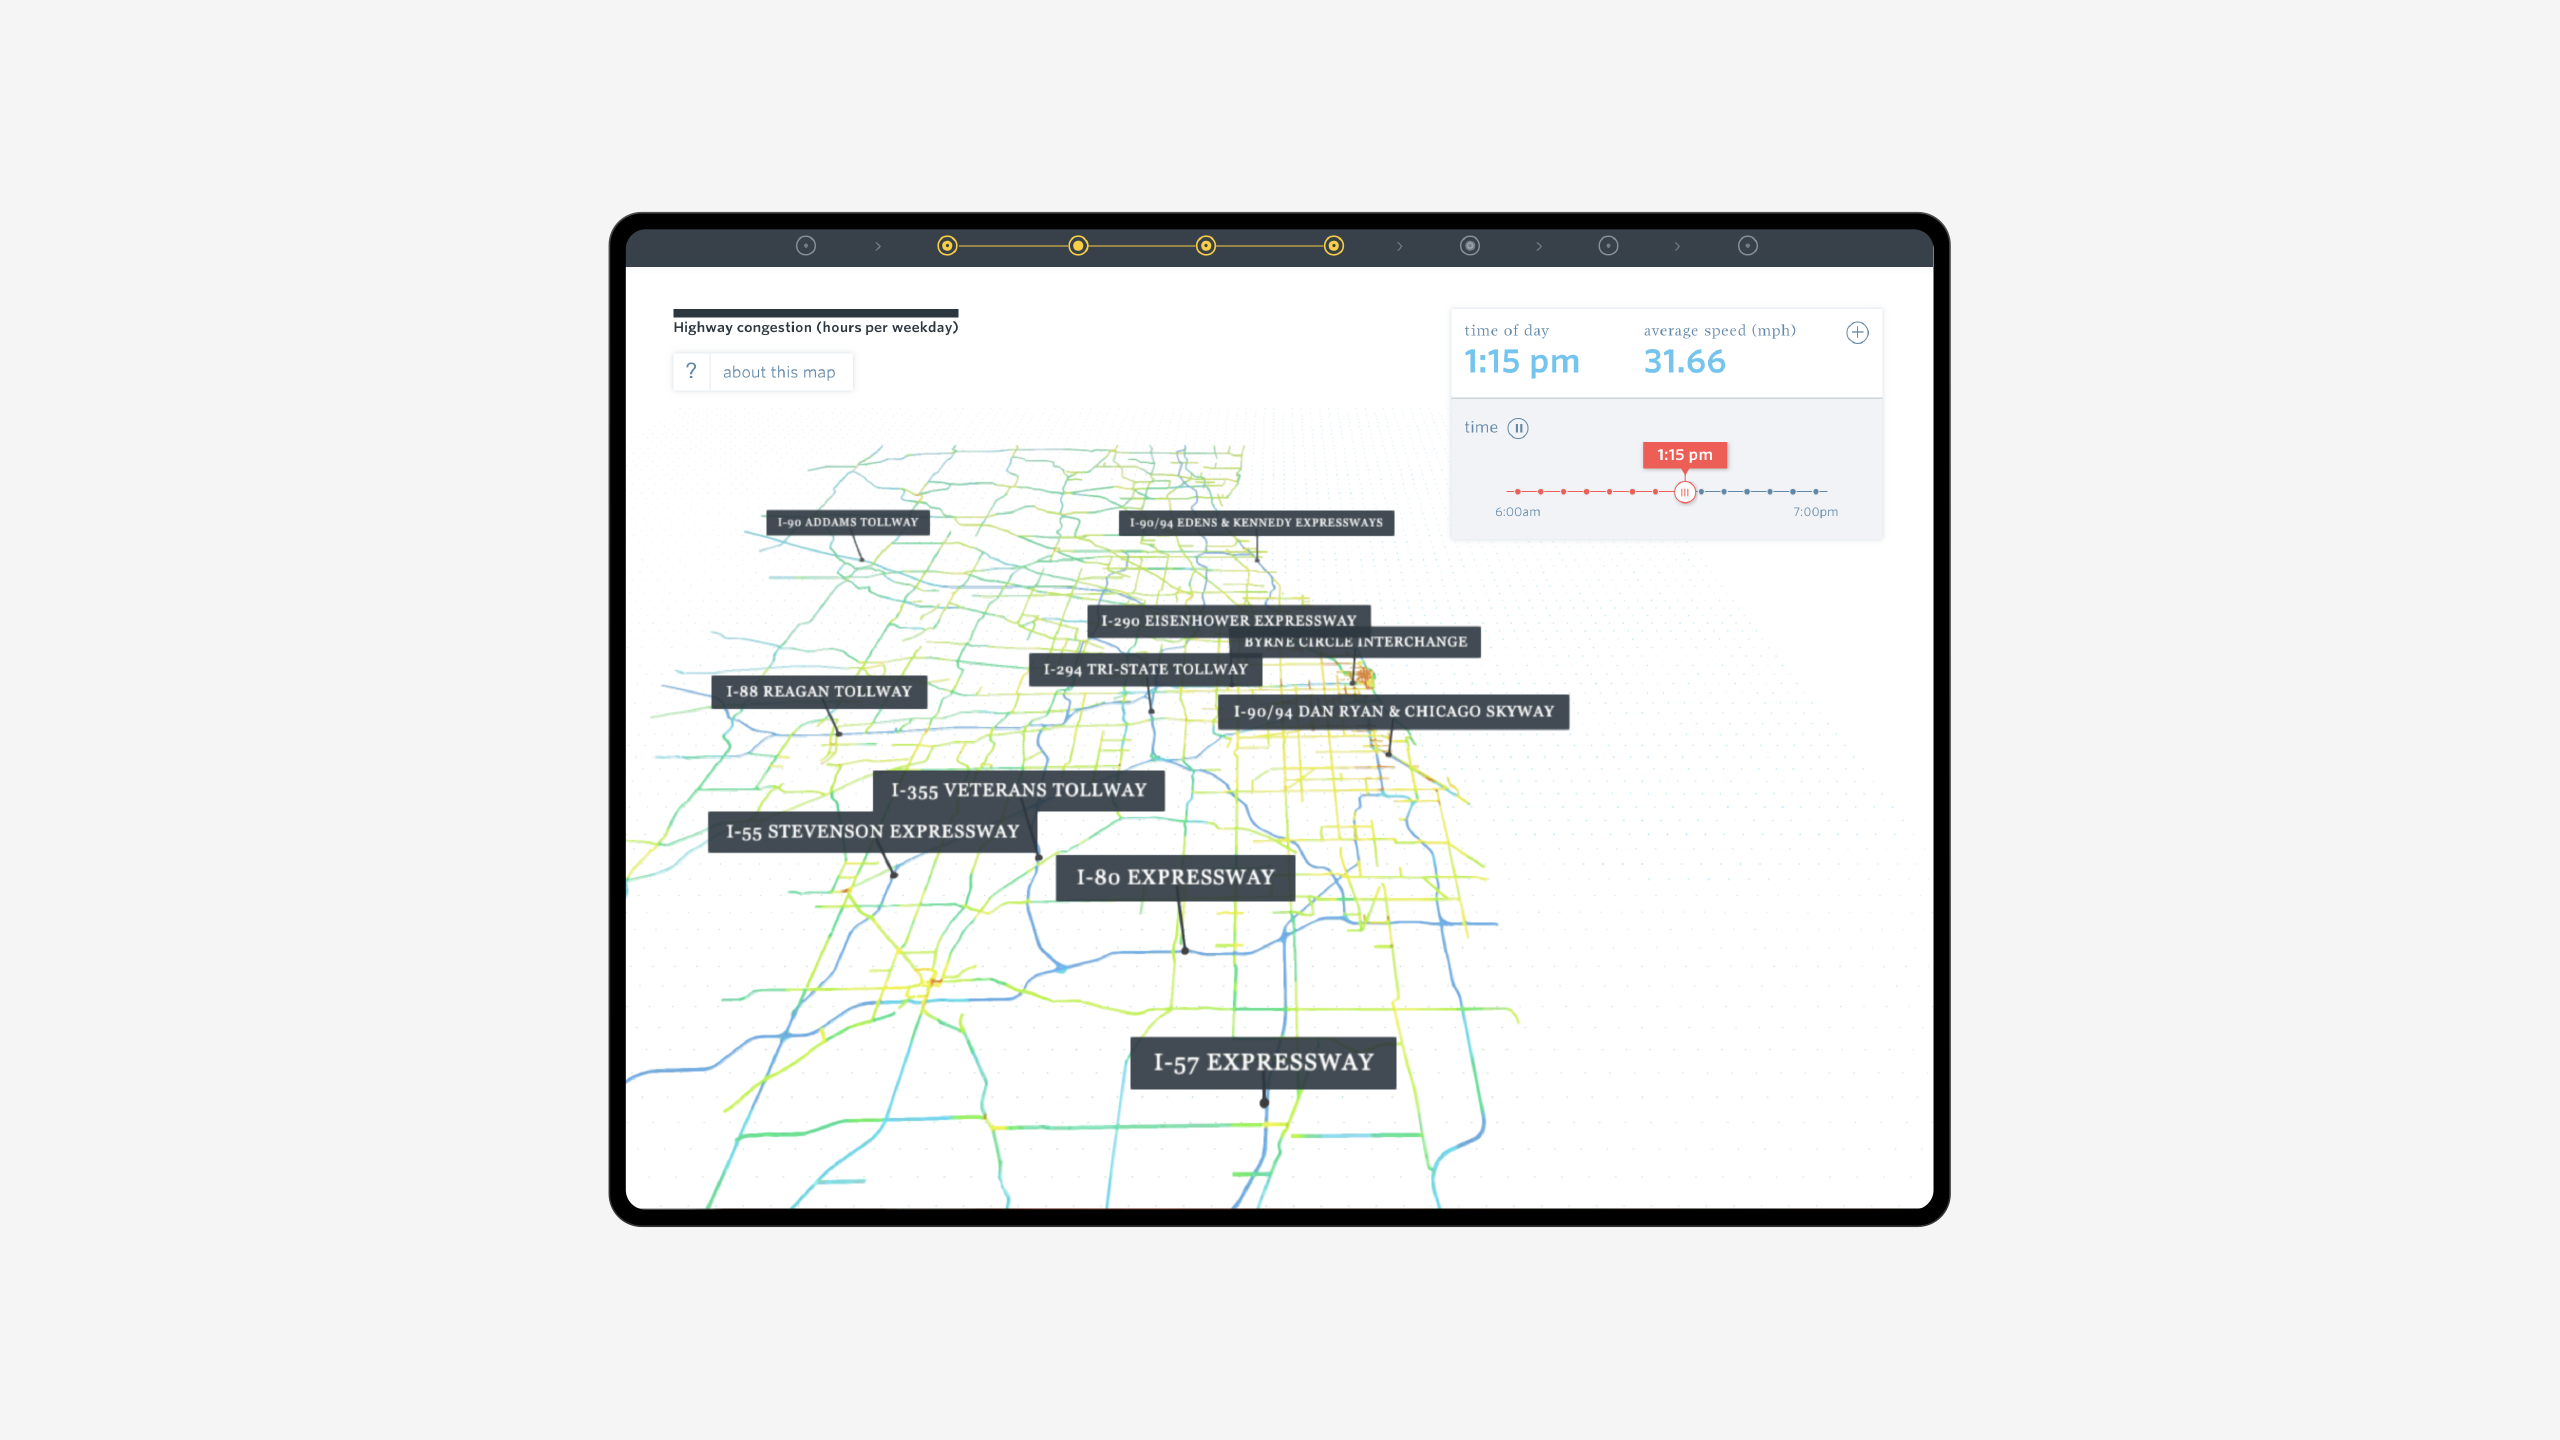
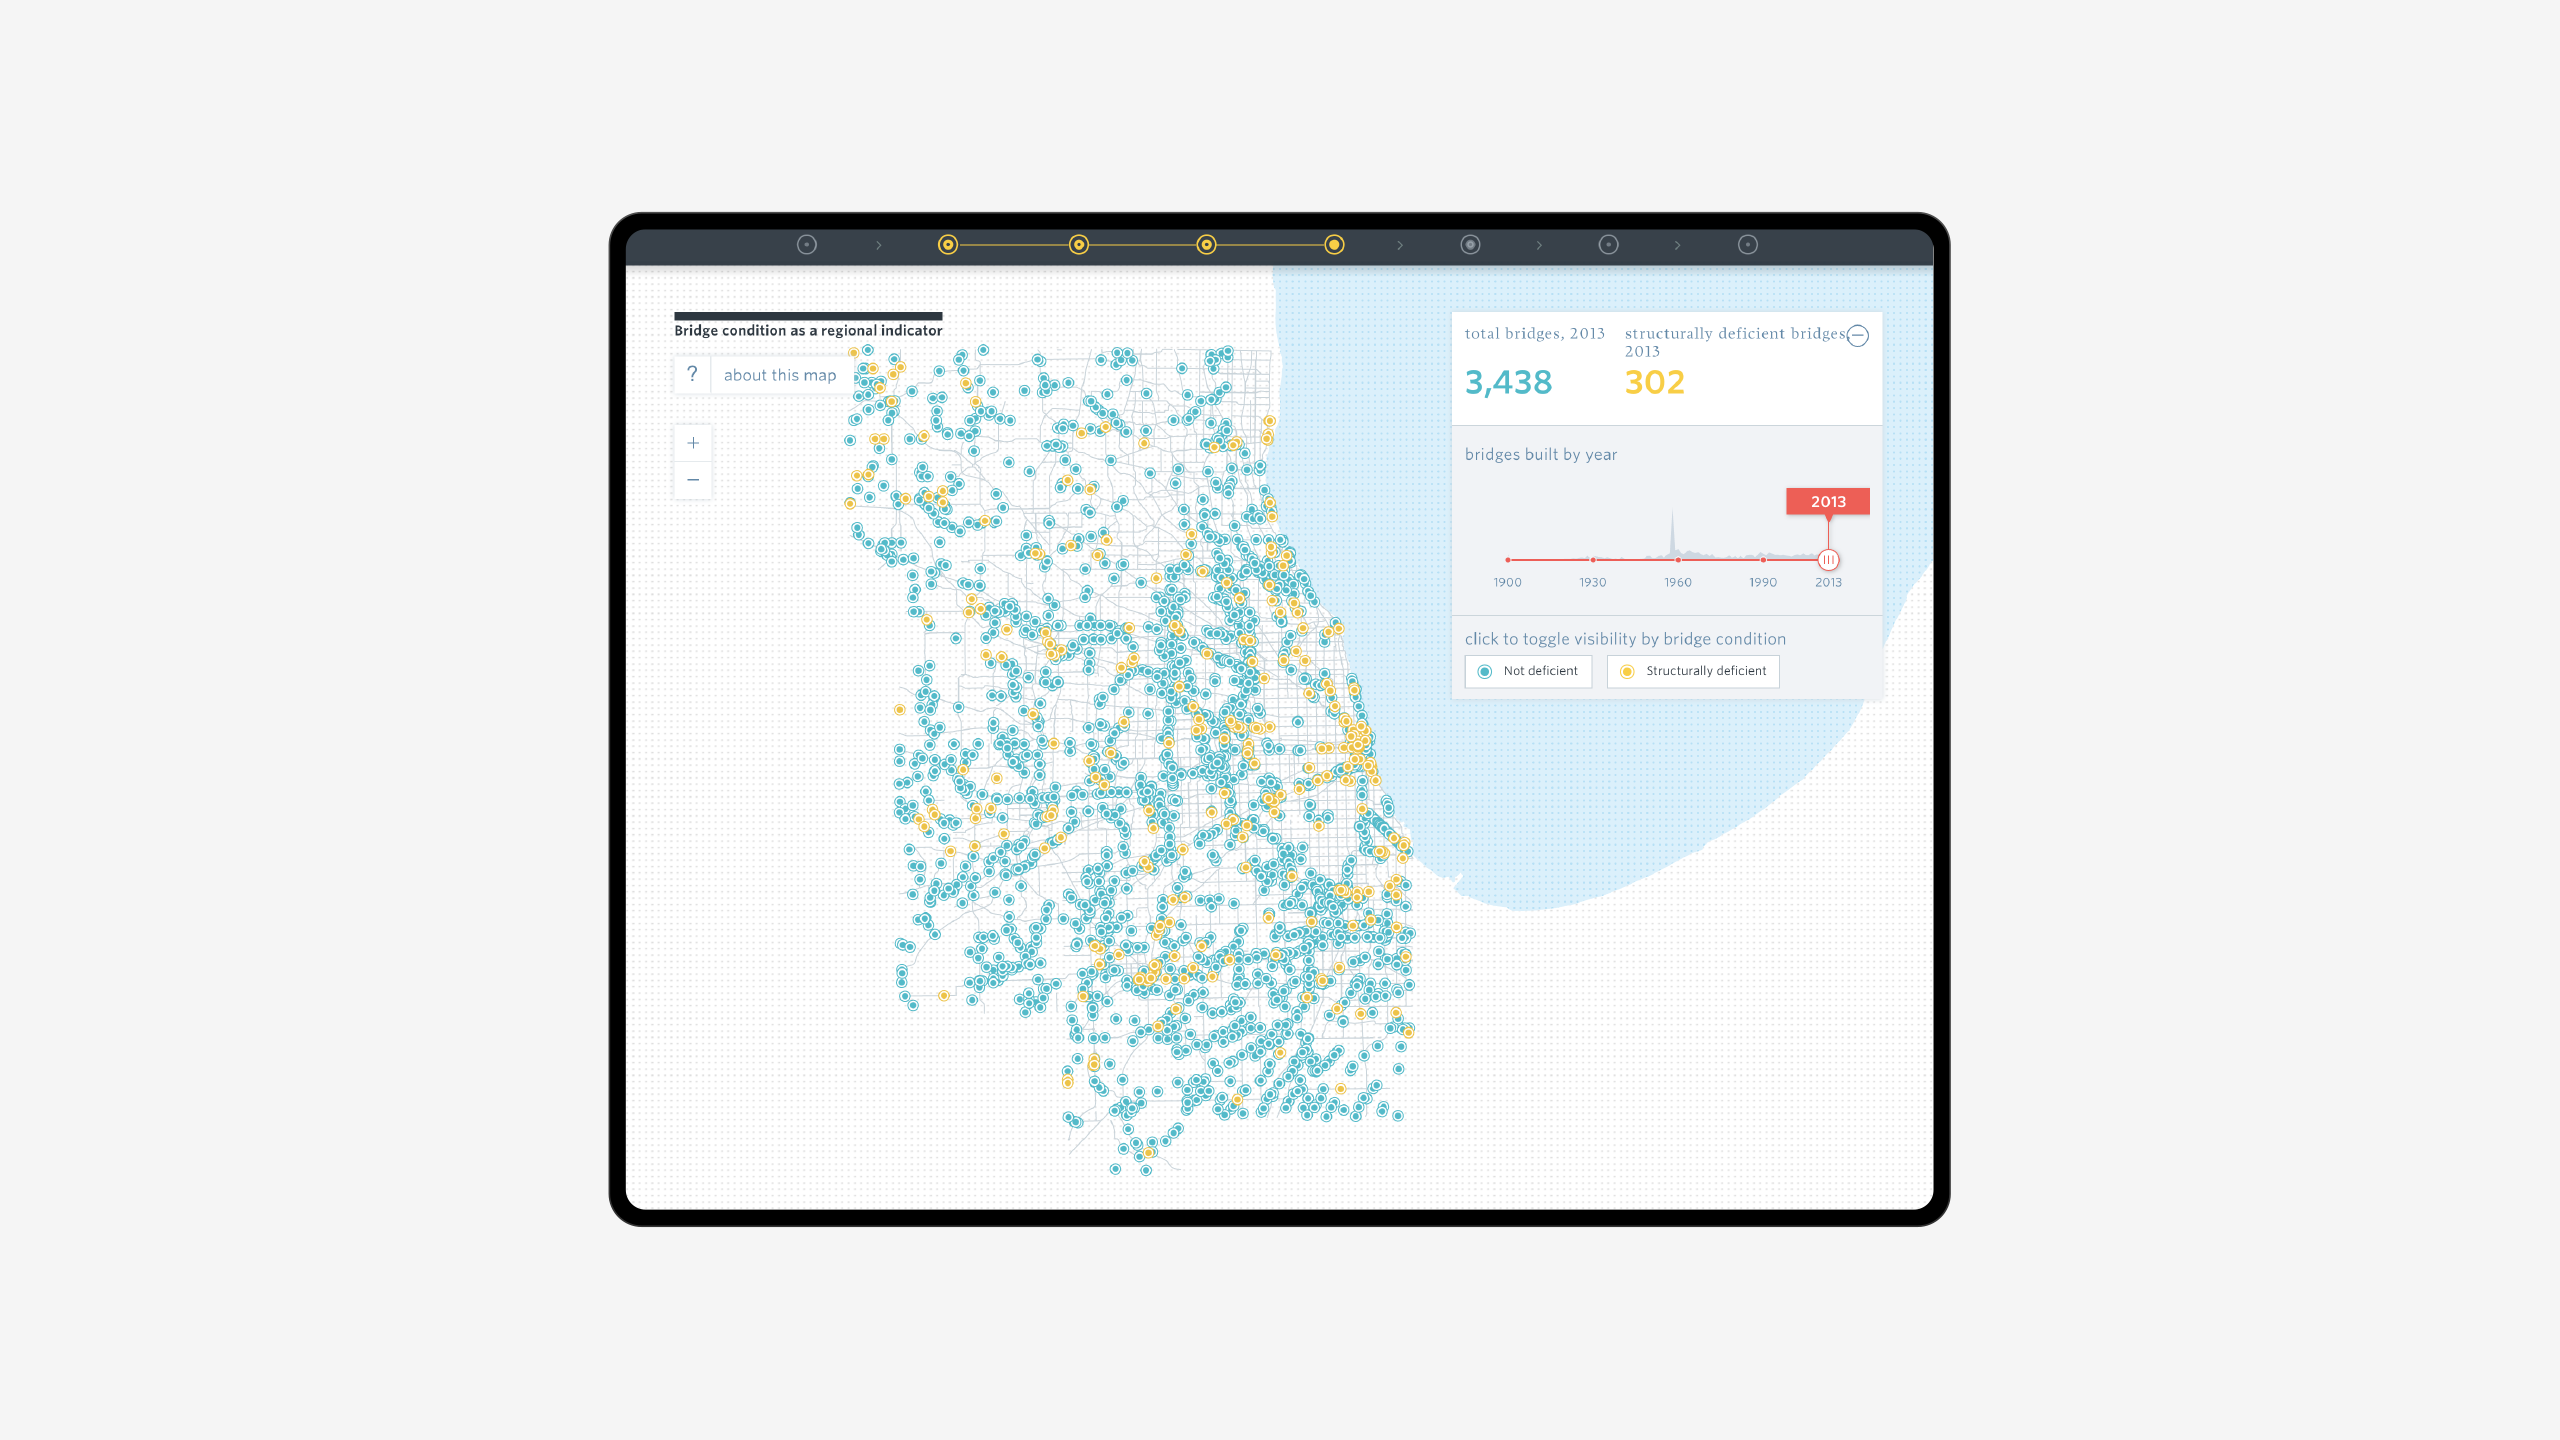
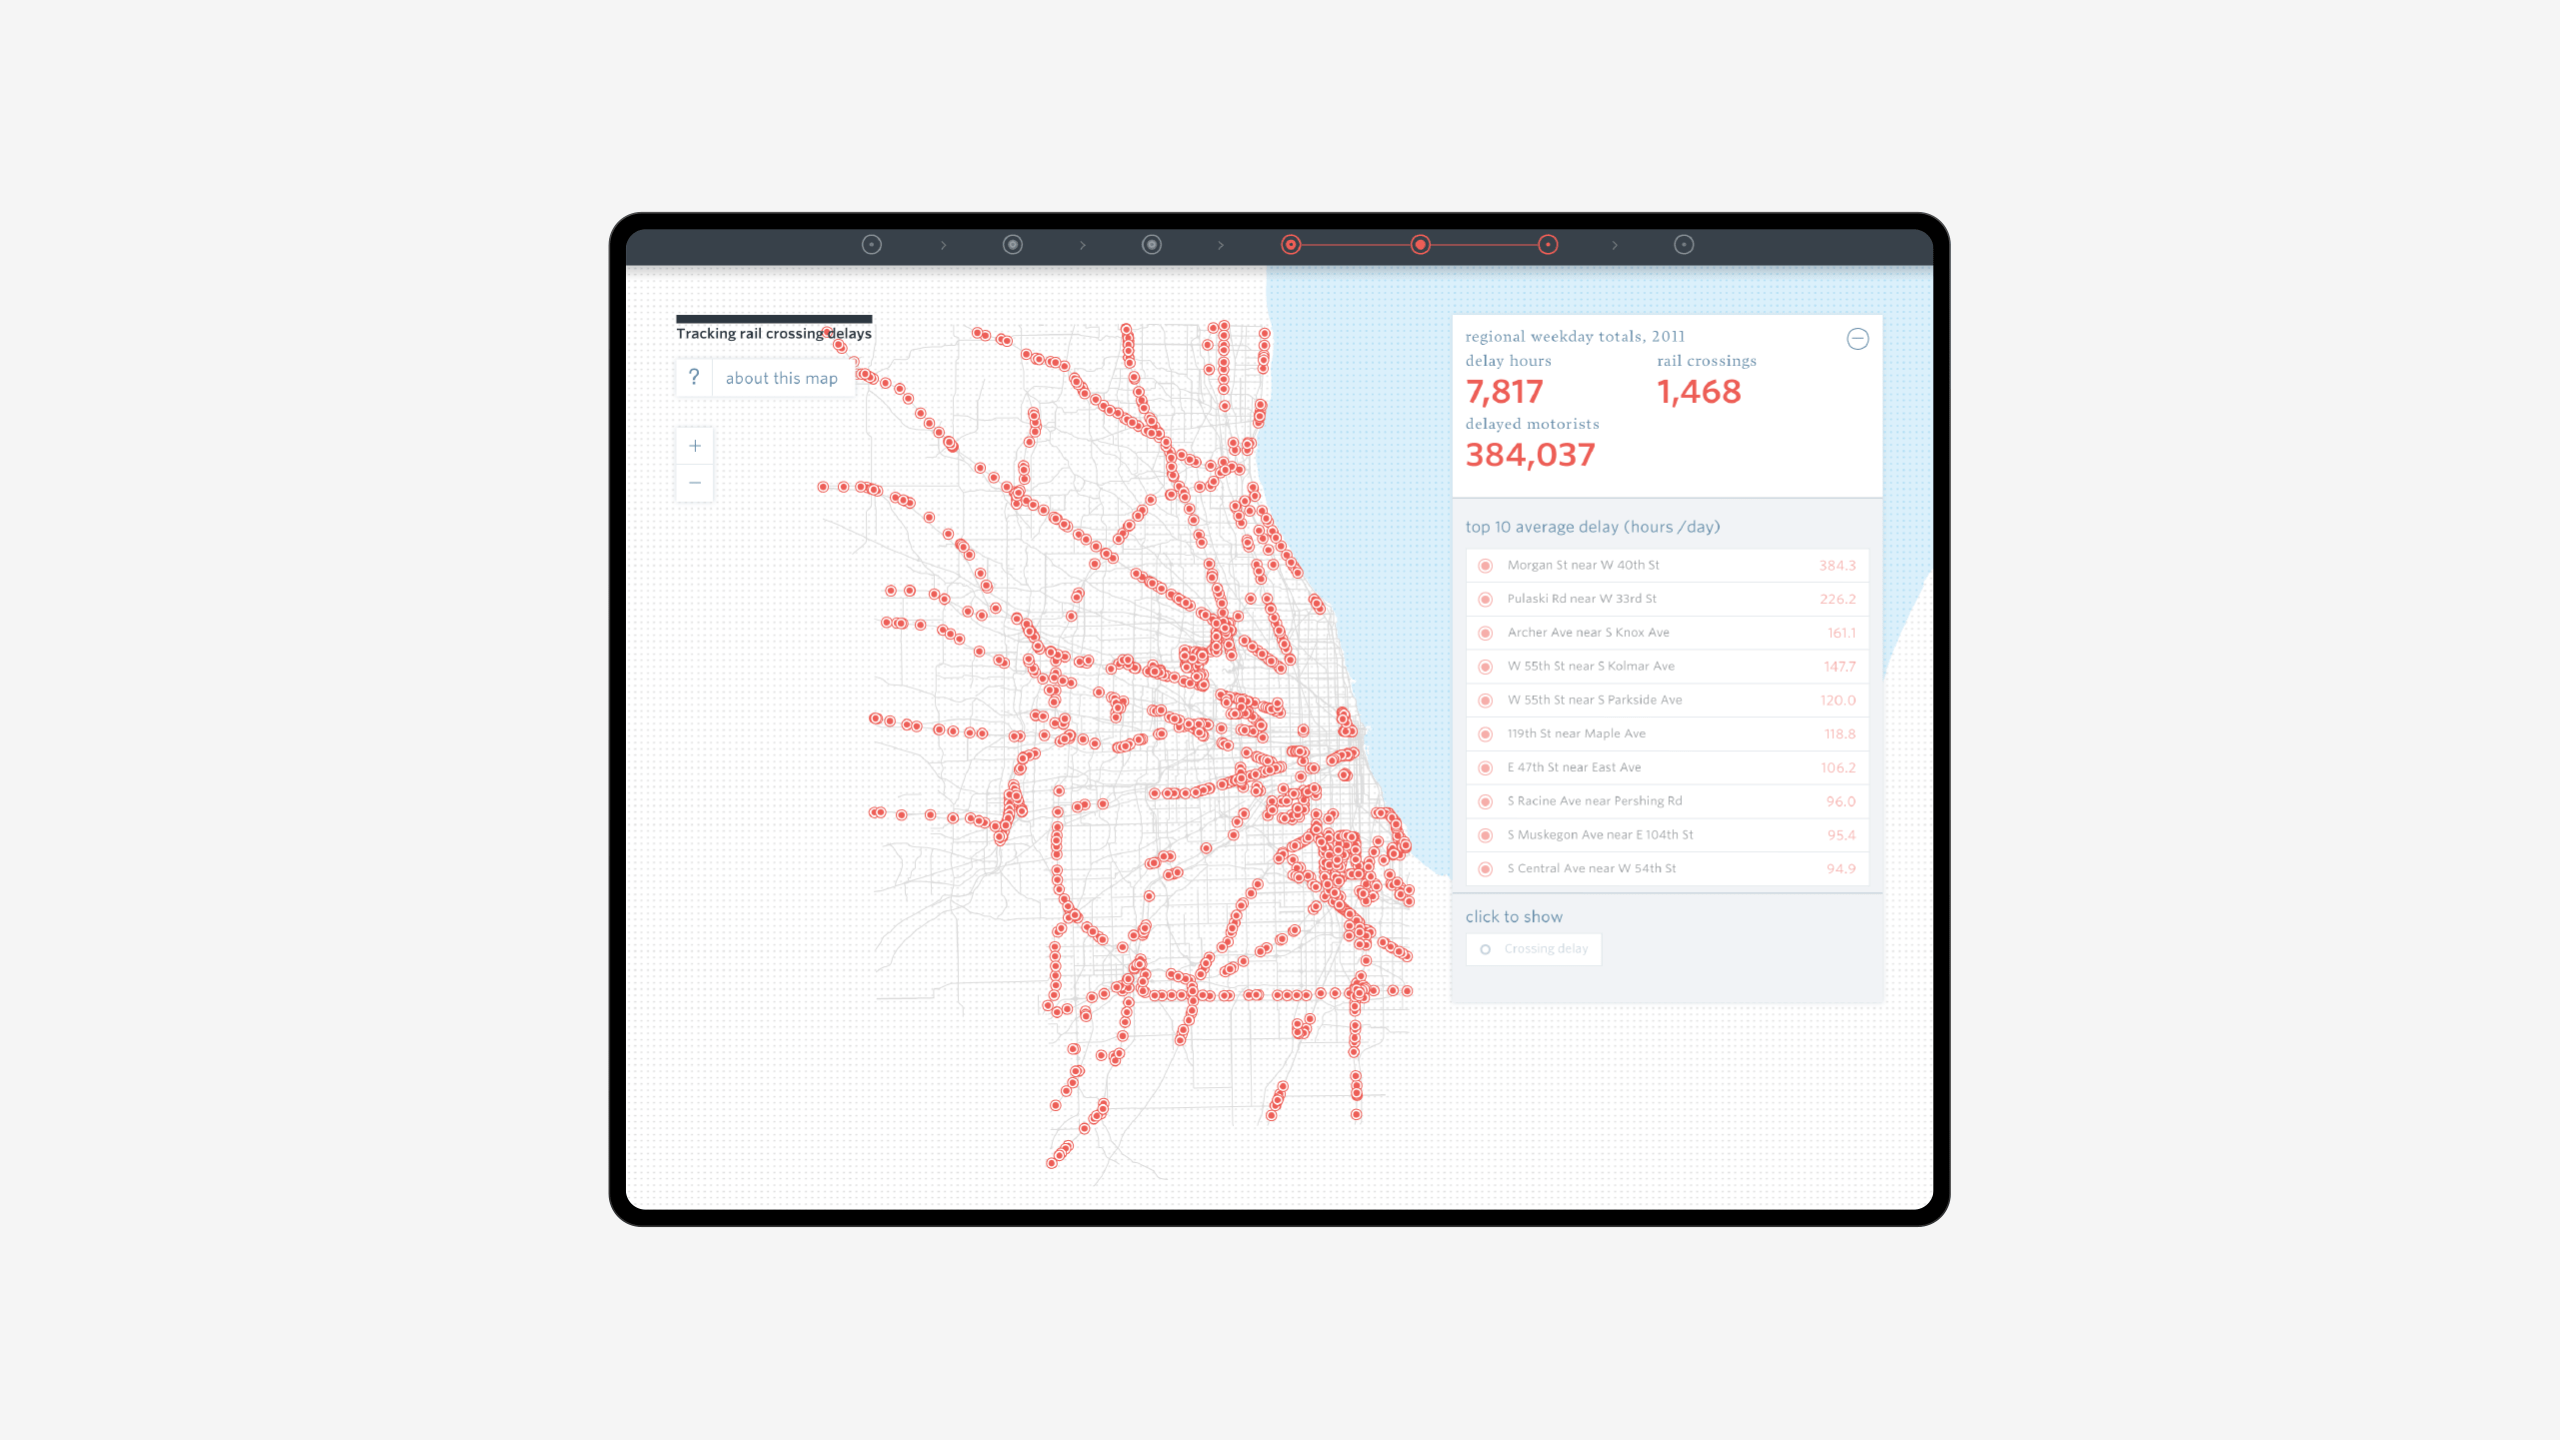
Datavisualizations
Through interactive data visualizations, the site enables users to grasp the data on a high level and zoom in on specific areas on the map to see more details. Each visualization is tailor-made for the topic to reinforce the messaging and allows for interactions that show the details and extent of the data. Building on the data shown in the visualization, the bottom of the page displays the key performance indicators that will be focus points for public policy.

Statements
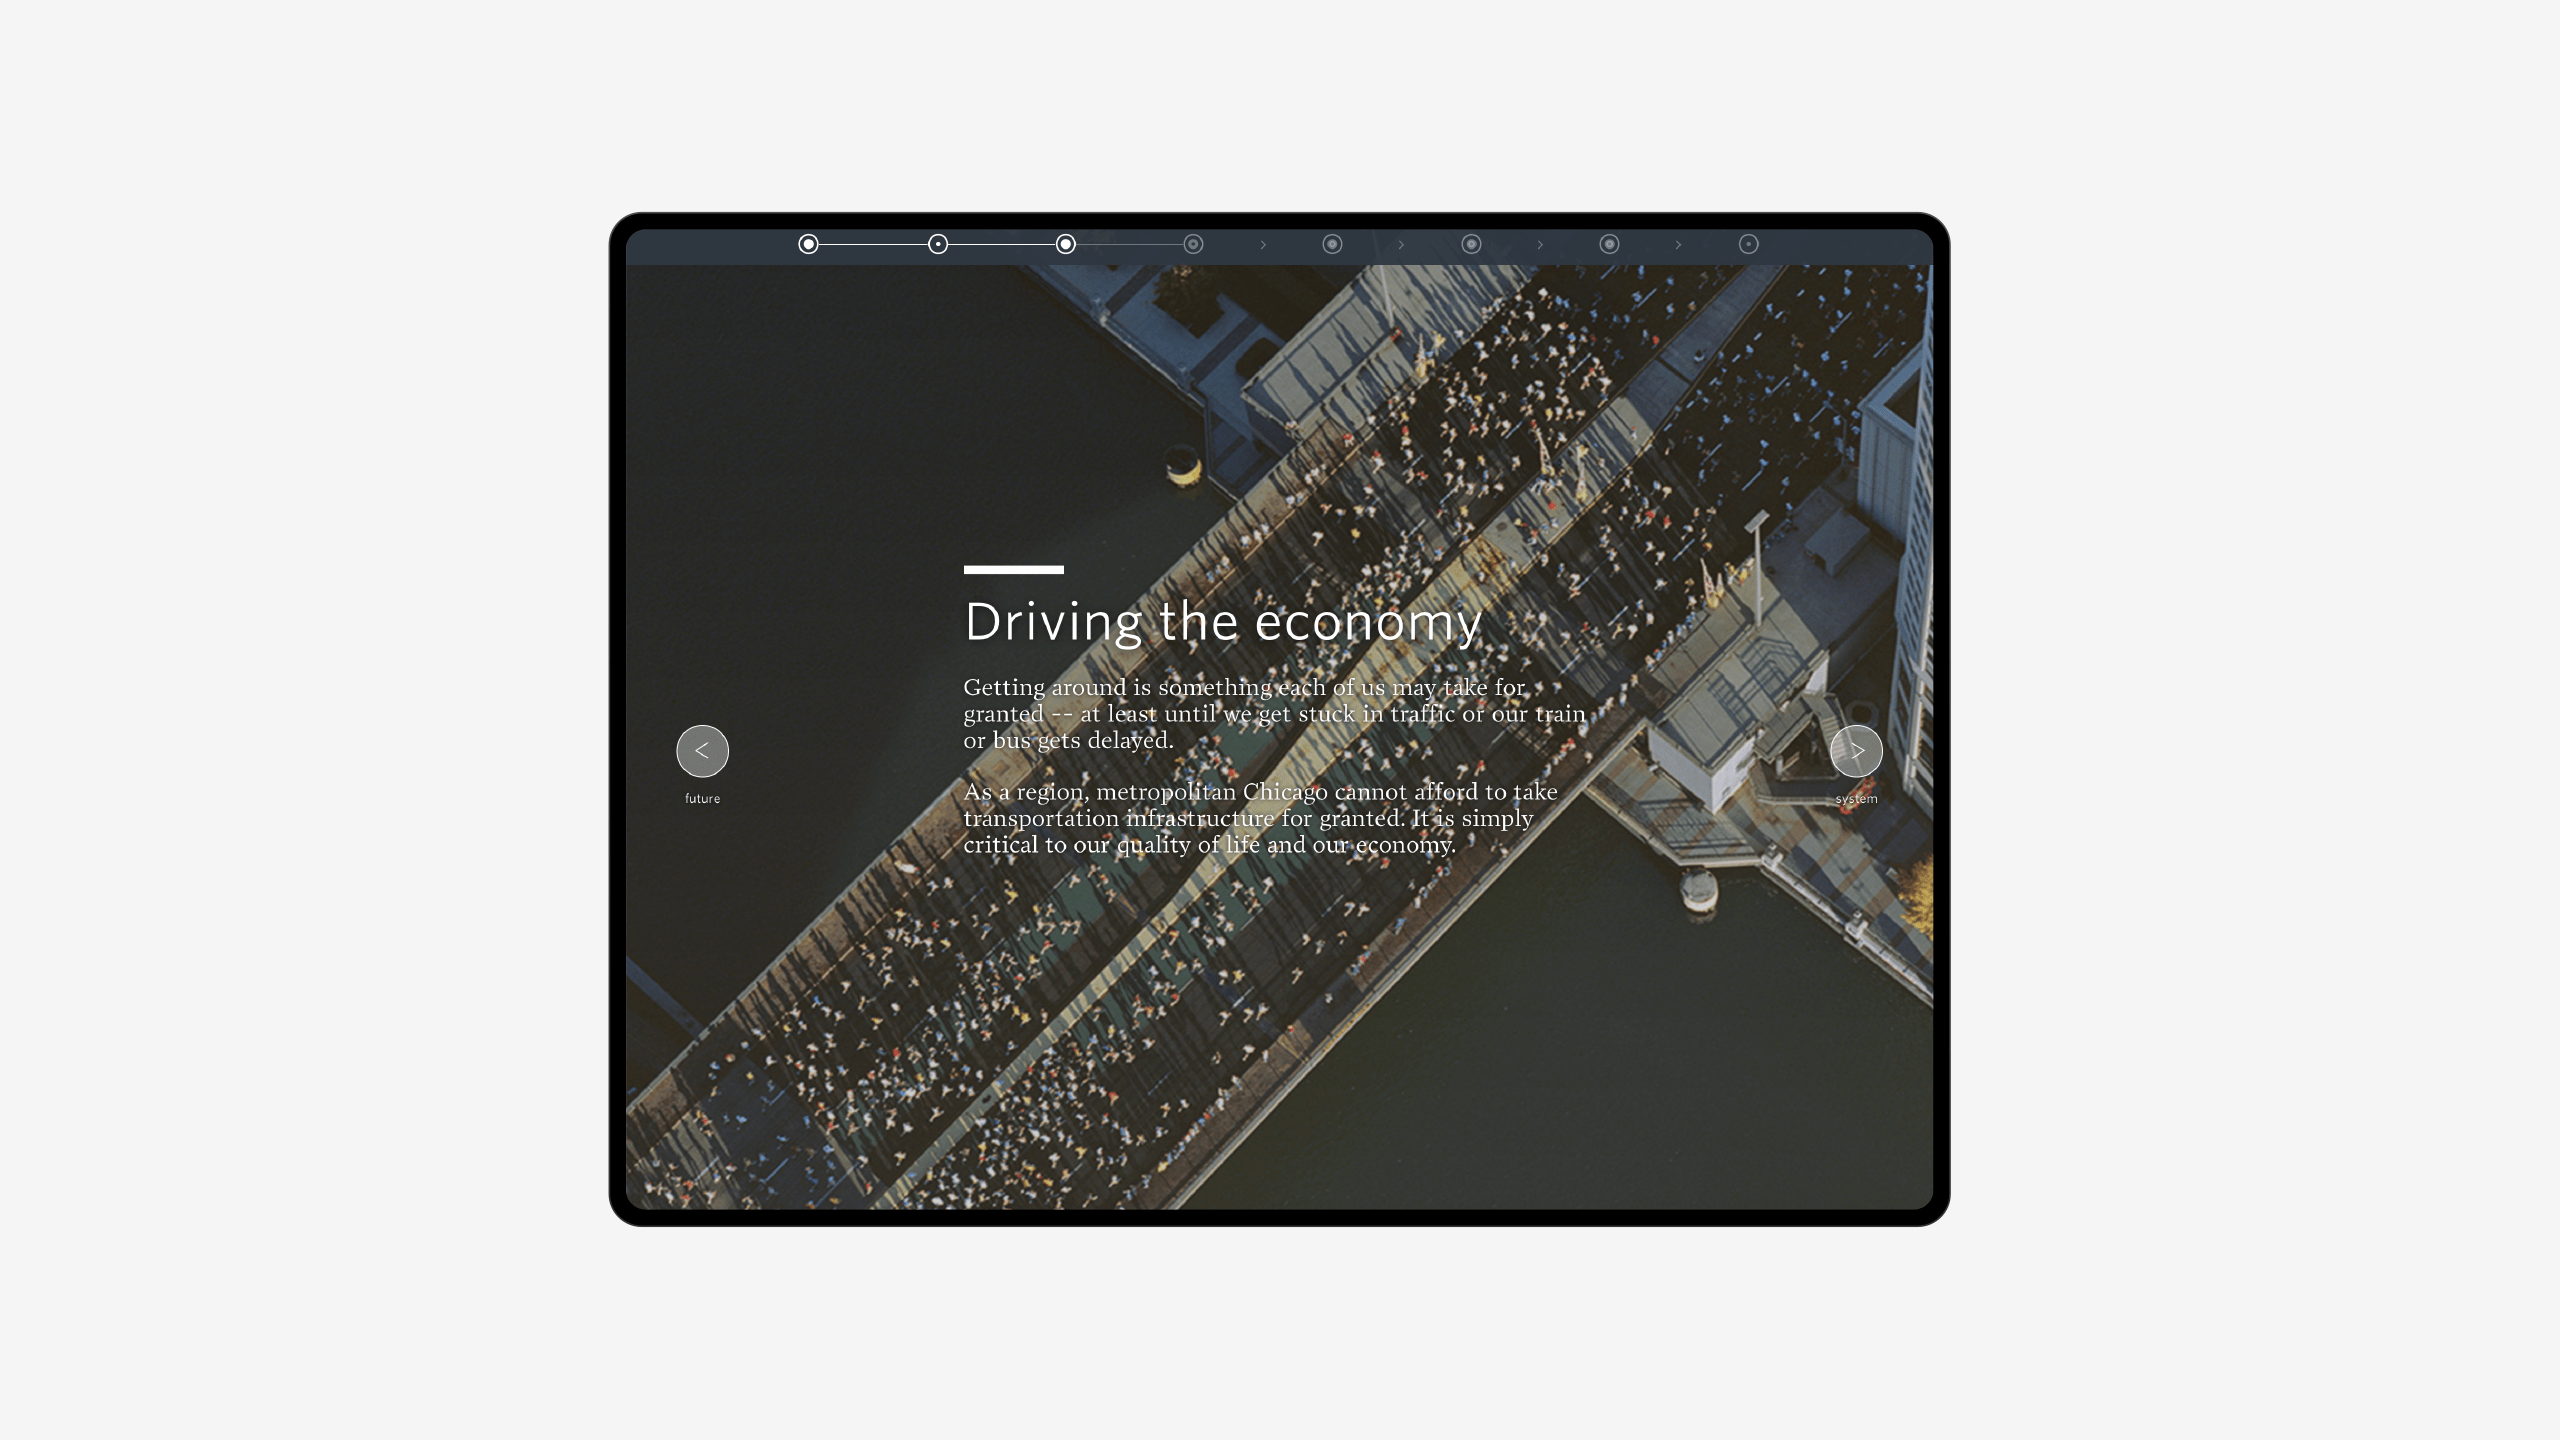
Timelapse movies with statements show the core of the issue. The situation as a statement in a video helps users easily contextualize the information.
Technology
We created time-lapse videos of geospatial information, used as video textures on 3D map models. We chose three.js for the 3D charts, combining 3D models with video textures to create visualizations that show the full complexity of the data. By using video textures we drastically reduced the impact on performance, keeping the system load to a minimum. This was also the reason we chose the AngularJS framework as the unifying mechanism of the set of visualizations, enabling us to focus on the visualizations rather than managing page interactions and data loading.
Results
Through this website our transportation-related content has gathered significant and positive recognition here in our region, state, and the U.S. at large, calling attention to important issues of funding for infrastructure. The site will remain an important tool as CMAP communicates its mobility priorities, including regional indicators for measuring progress.
Tom Garritano
Communication Director, CMAP