Visualizing the process of everyday decision-making driven by algorithms
- Client
- 150 Media Stream
- Partners
- Michael Salisbury – Photography of installation
- Awards
- FWA of the day
- European Design Awards – Finalist
- Deliverables
- Digital Installation
The challenge
Every day we rely on algorithms that solve complex problems and efficiently execute tasks. Some of the real-life examples are optimizing traffic lights or public transport schedules. In this project, we created a visual experience showing the multiple levels of decision-making driven by algorithms so you can ‘see’ how an algorithm works.
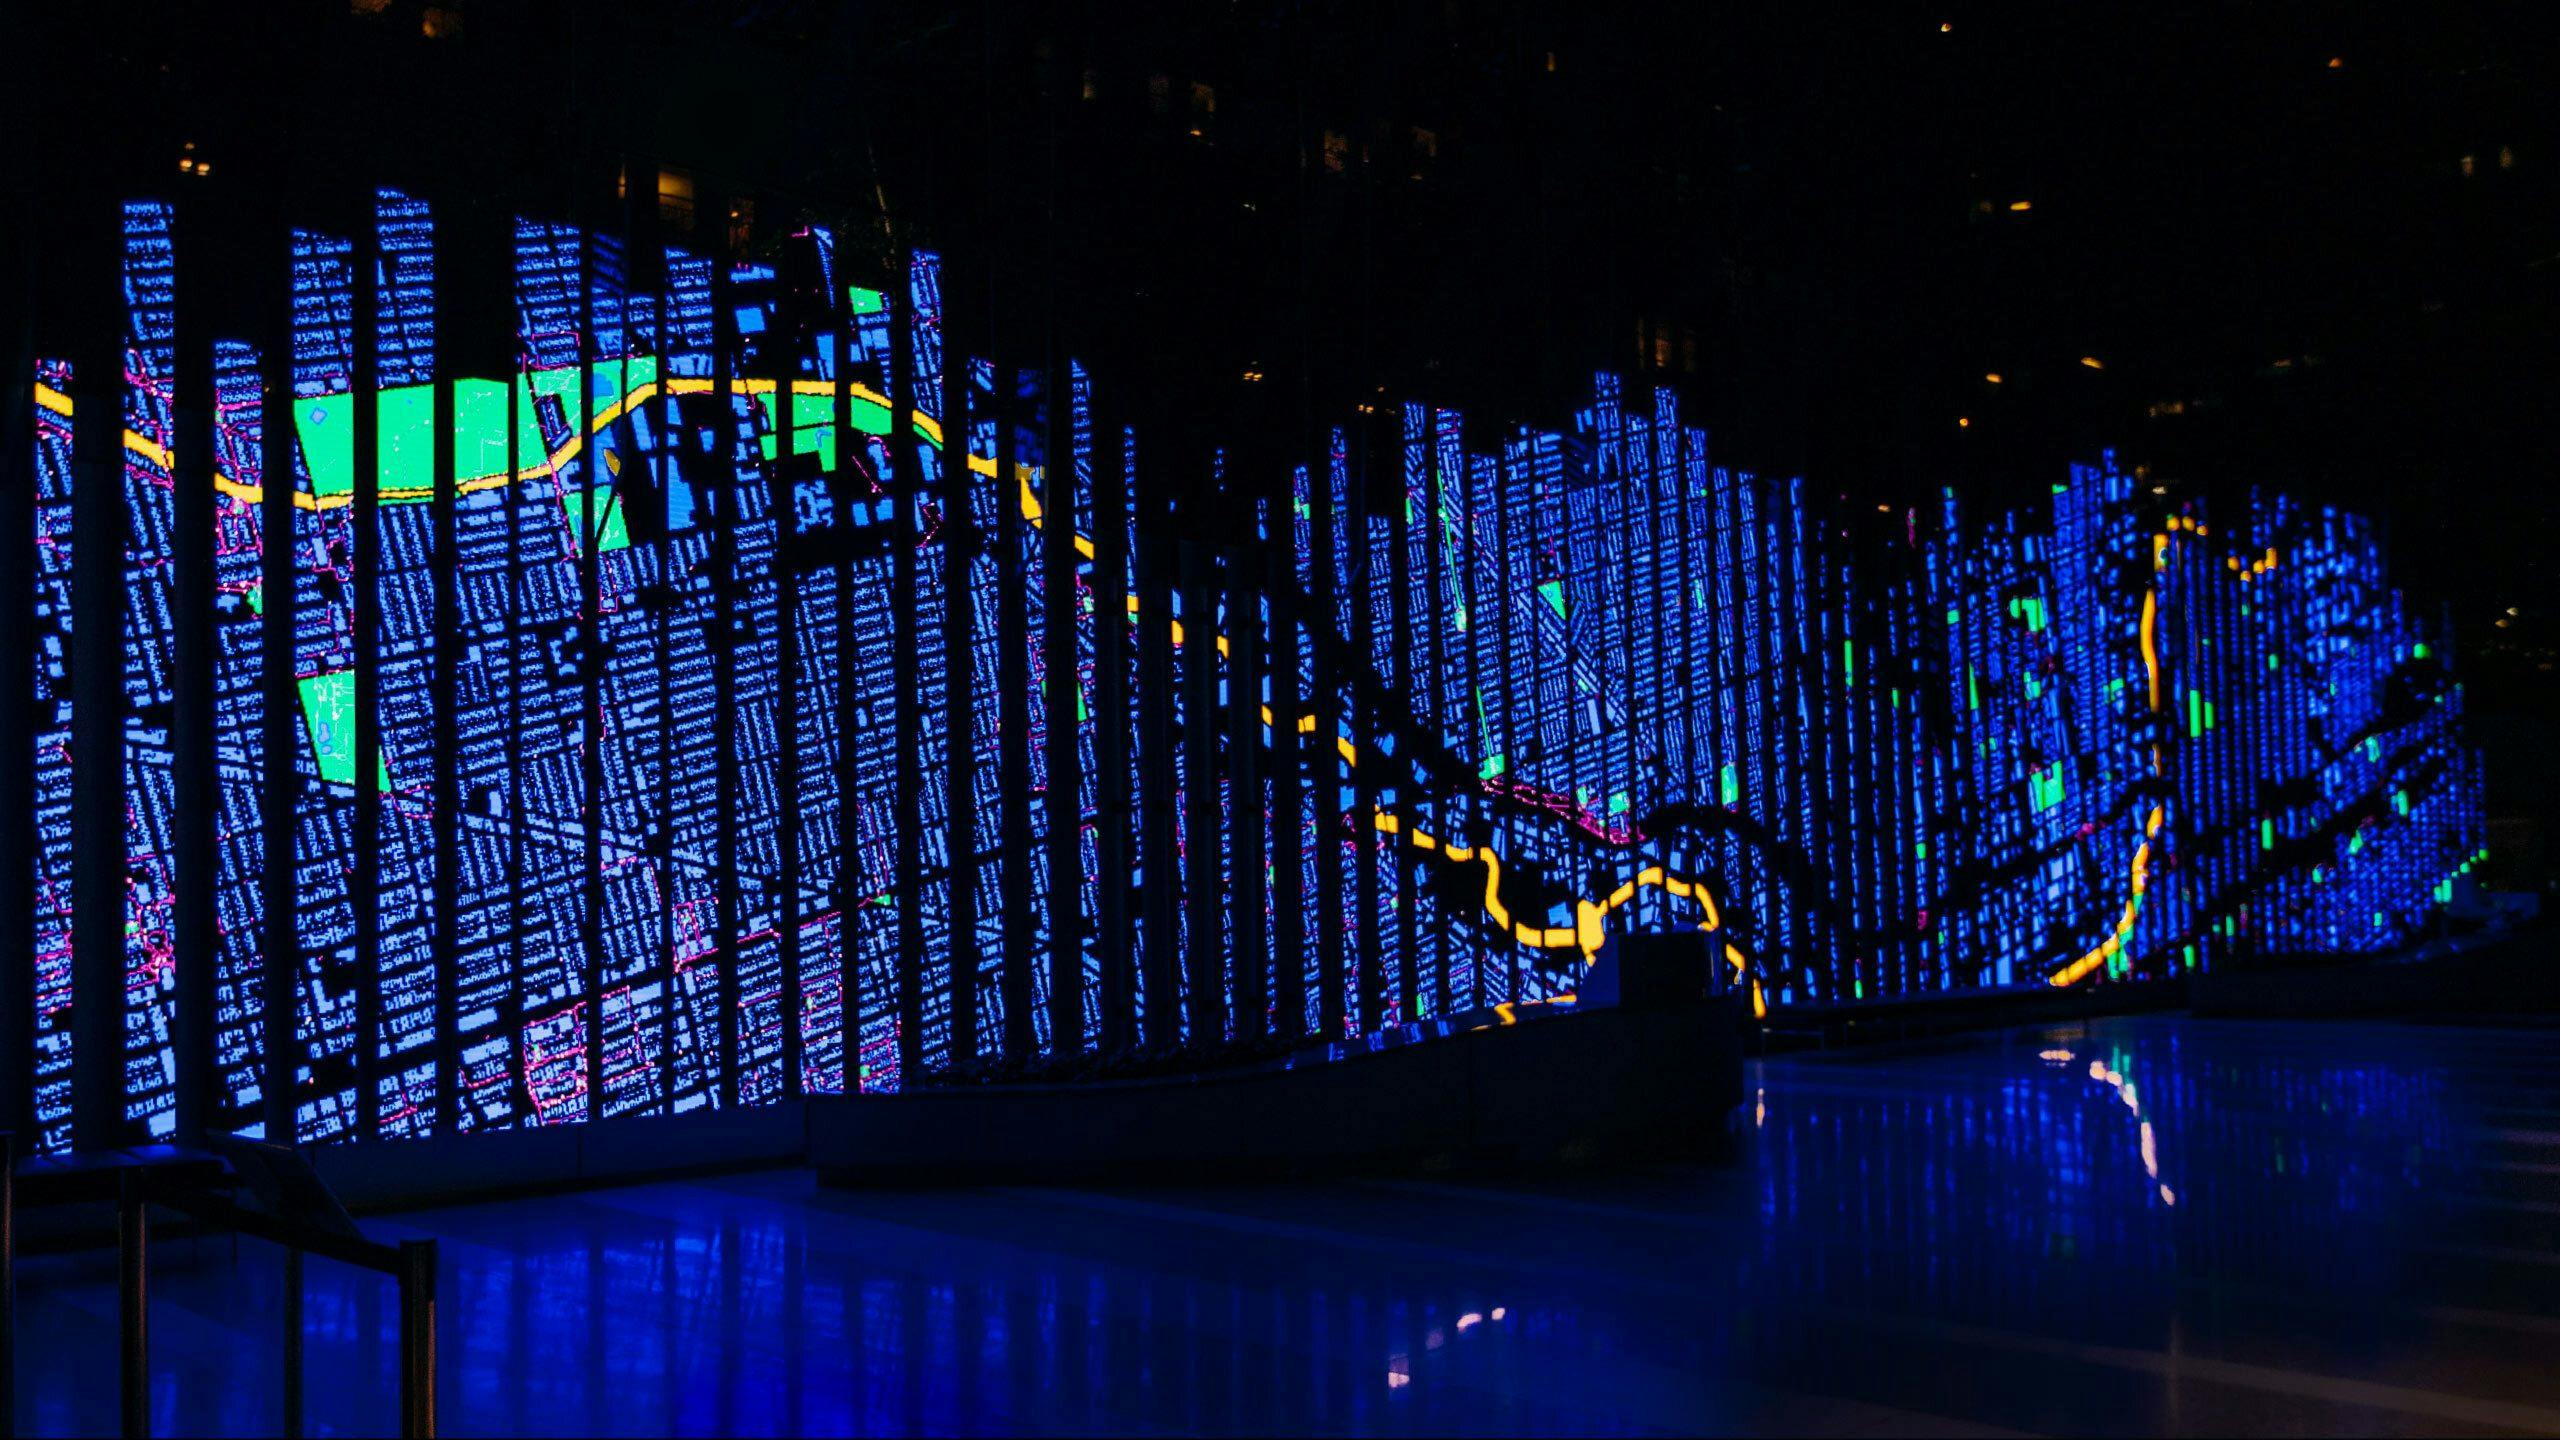
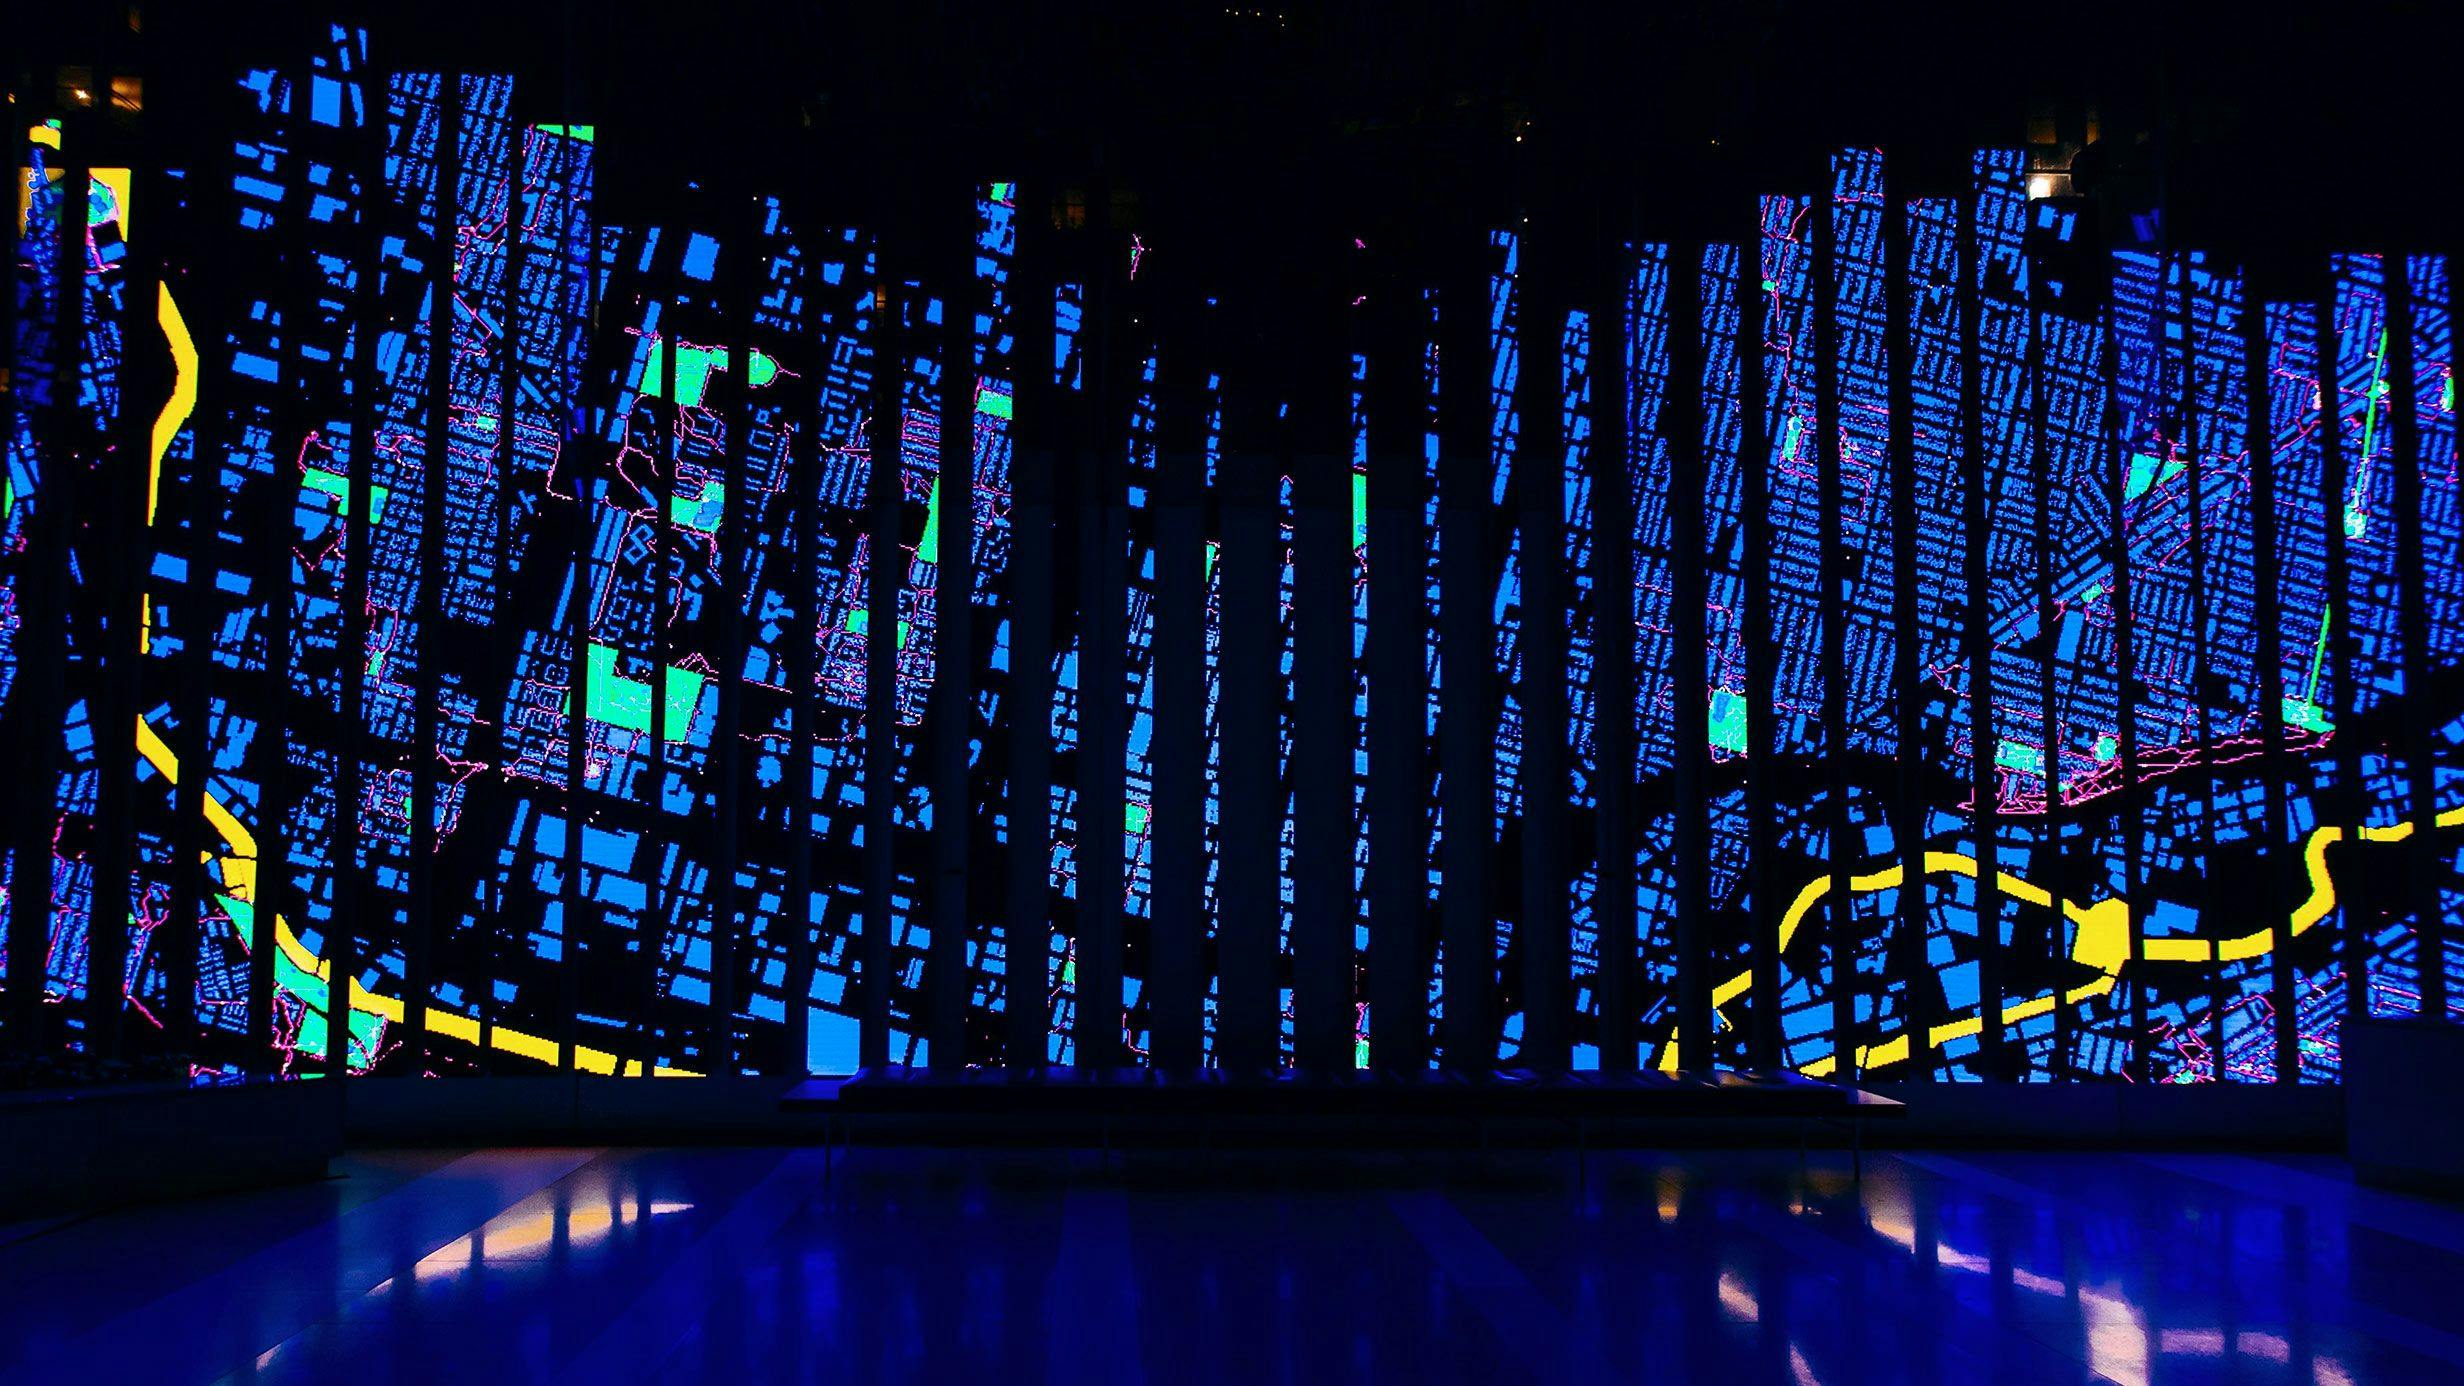
Our client, 150 Media Stream, is an international platform that showcases both rising and established global media artists. We created a digital art installation for the 150 feet LED screen in the lobby of the 150 North Riverside building. It visualizes the complexity of a running Ant Colony that tries to find the shortest route between natural resources, in this case, all parks in Chicago.
Value delivered
Bridging abstract technology to the real world and showing the levels of complexity that occur within a computer algorithm in a visual way.
Background
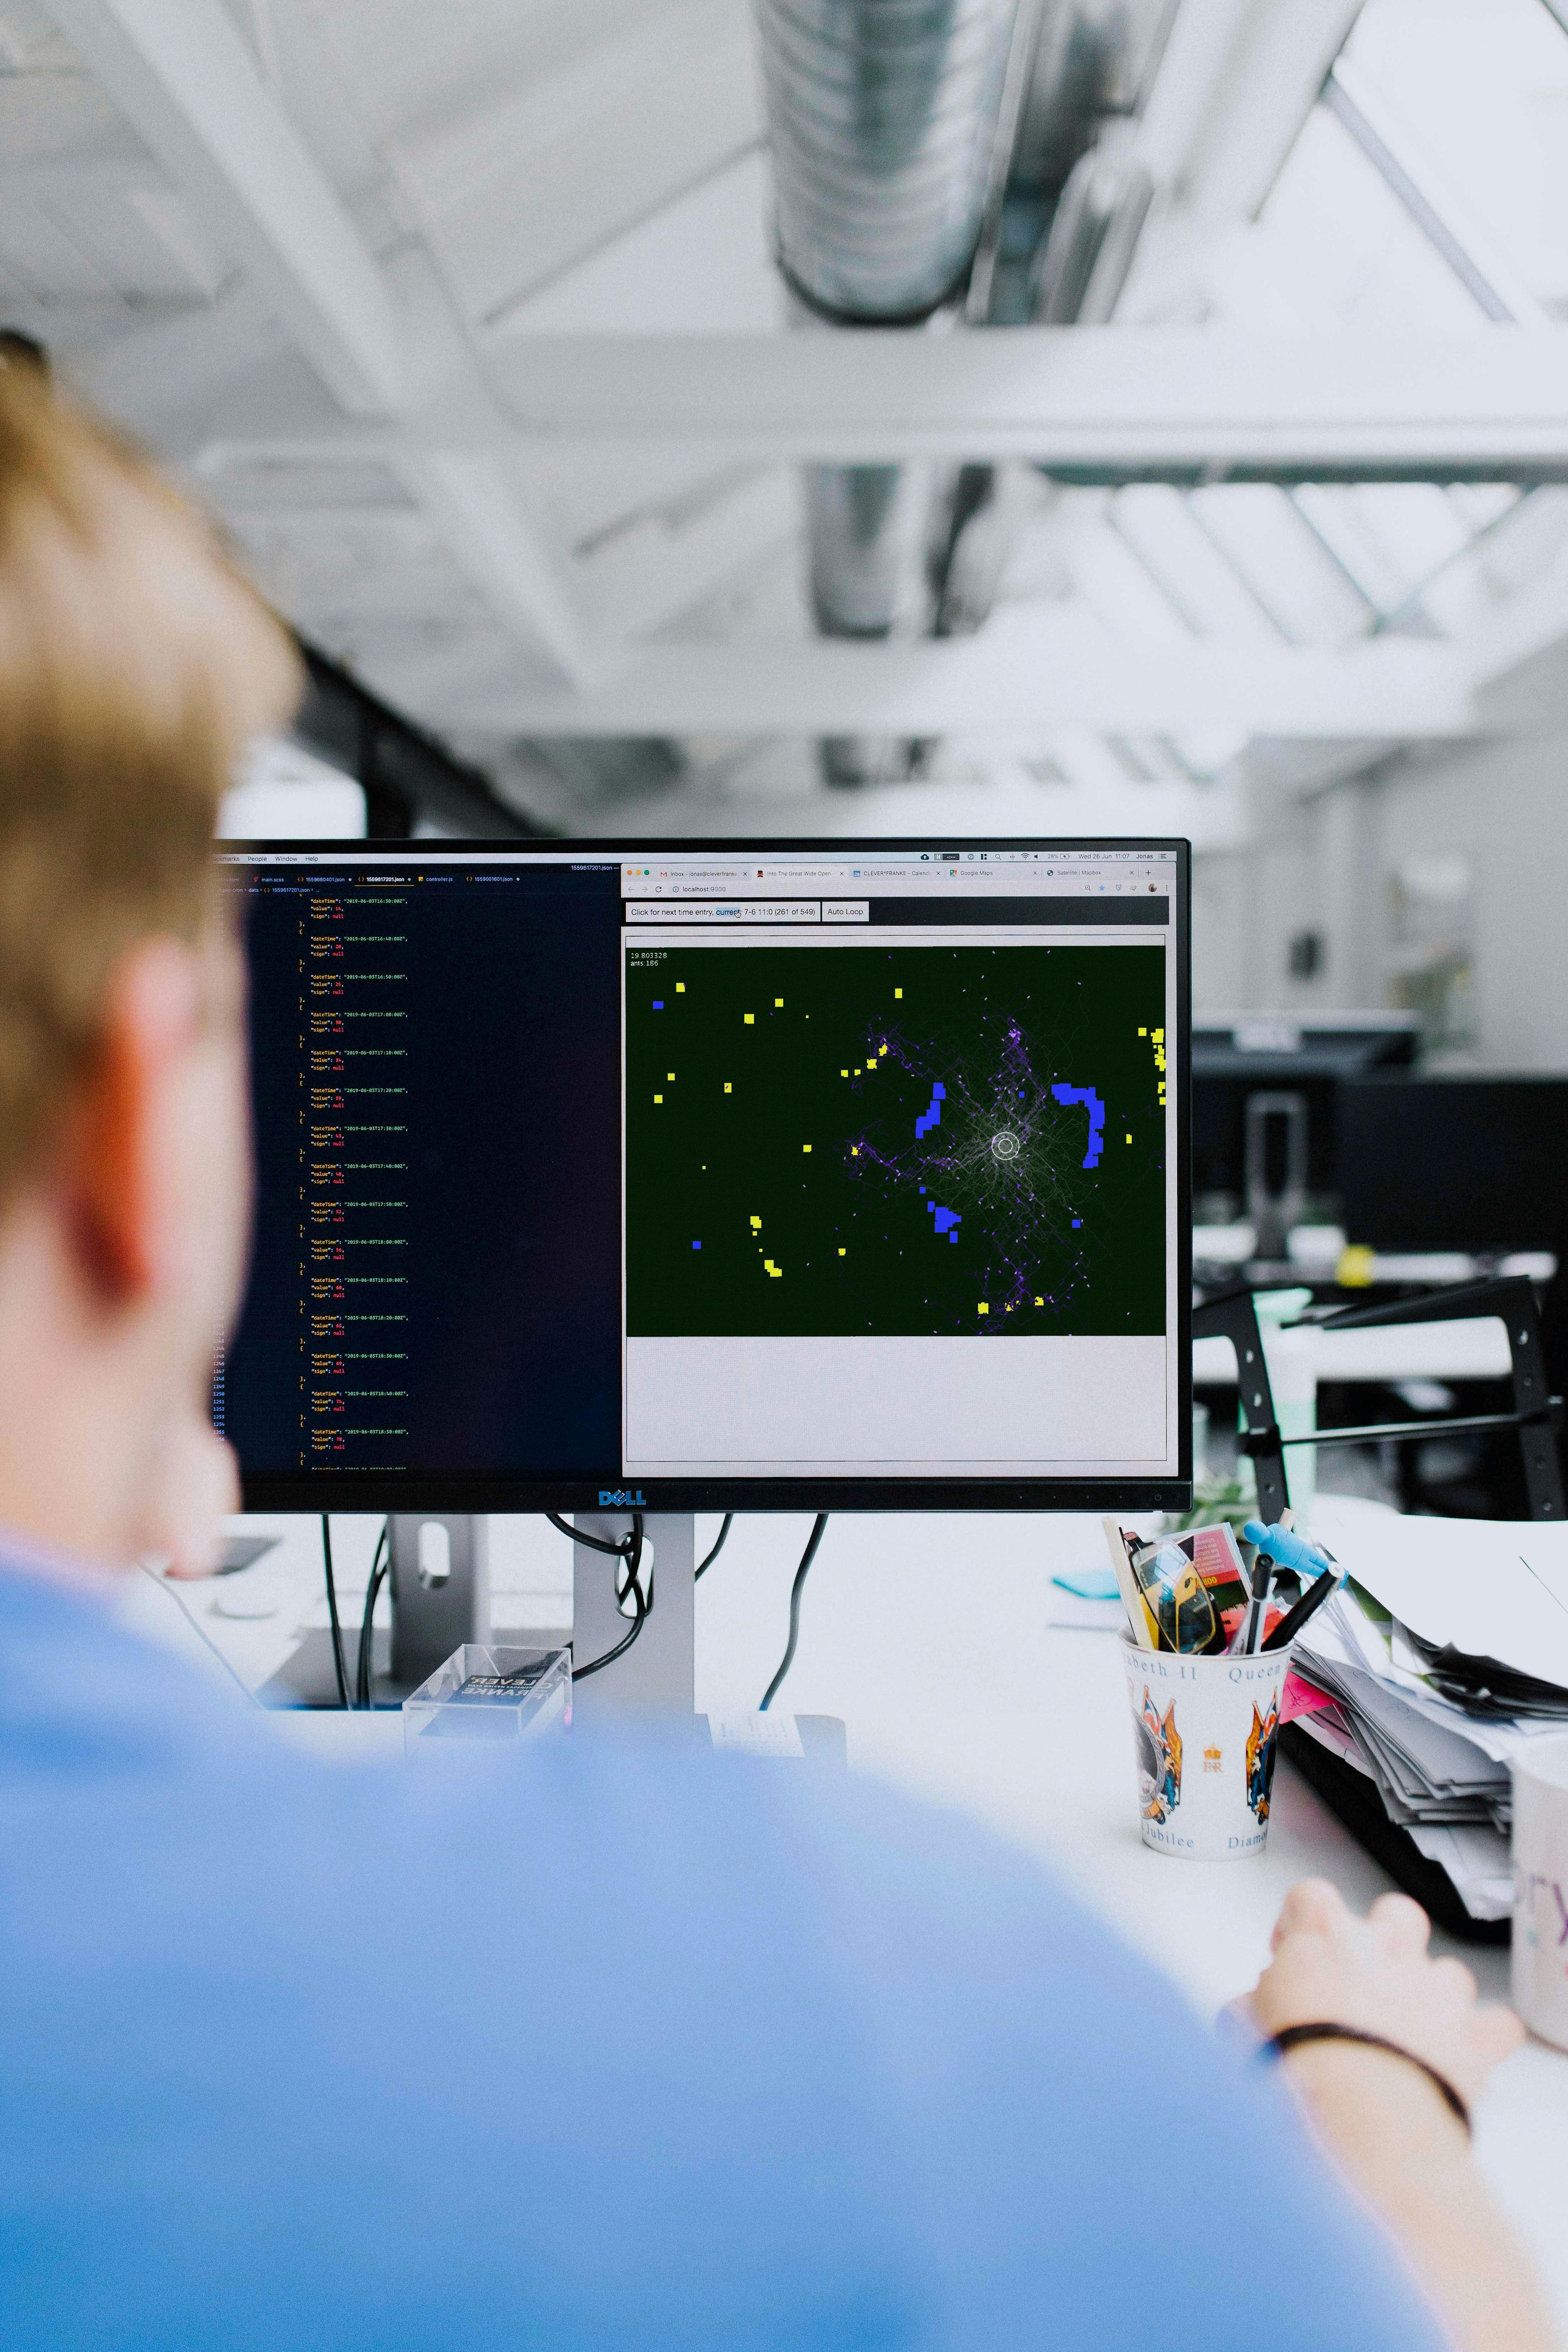
After several ideation sessions, we decided to visualize a complex algorithm that mimicked nature. We chose an Ant Colony Optimization (ACO) algorithm to bring our idea to life.
The ACO algorithm imitates the behavior of ants seeking a path between their colony and food source and is used to solve various optimization problems.
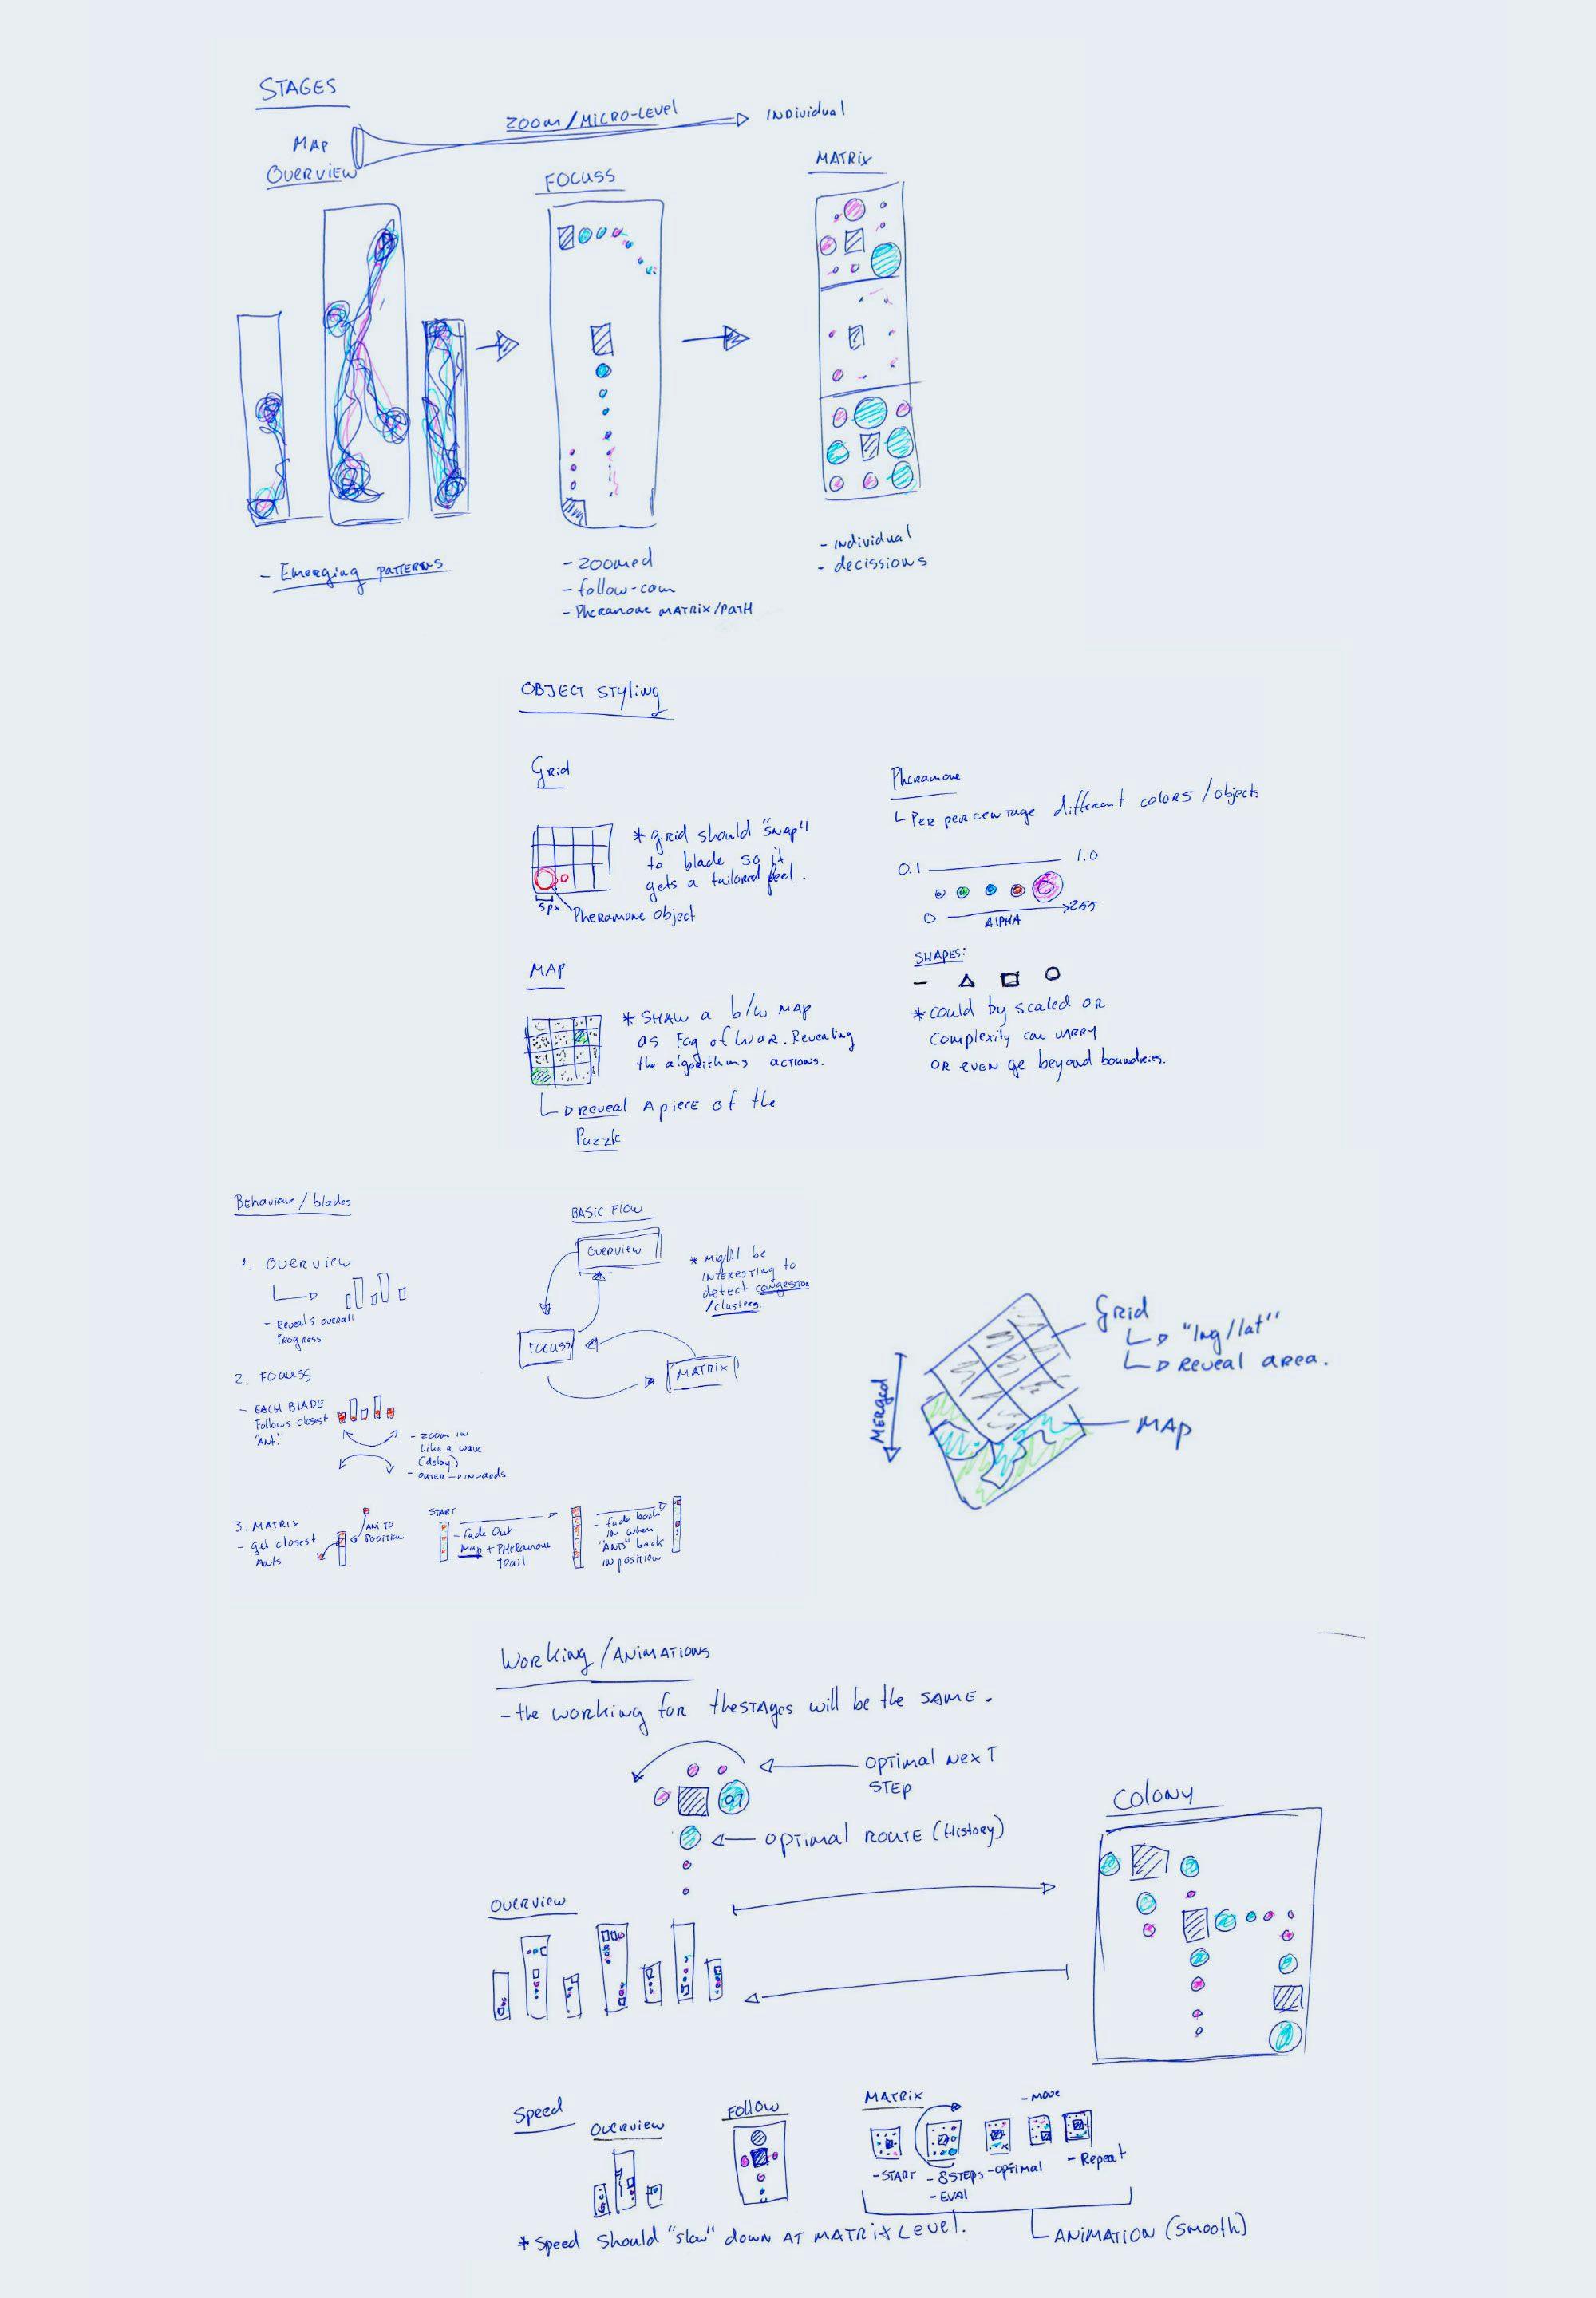
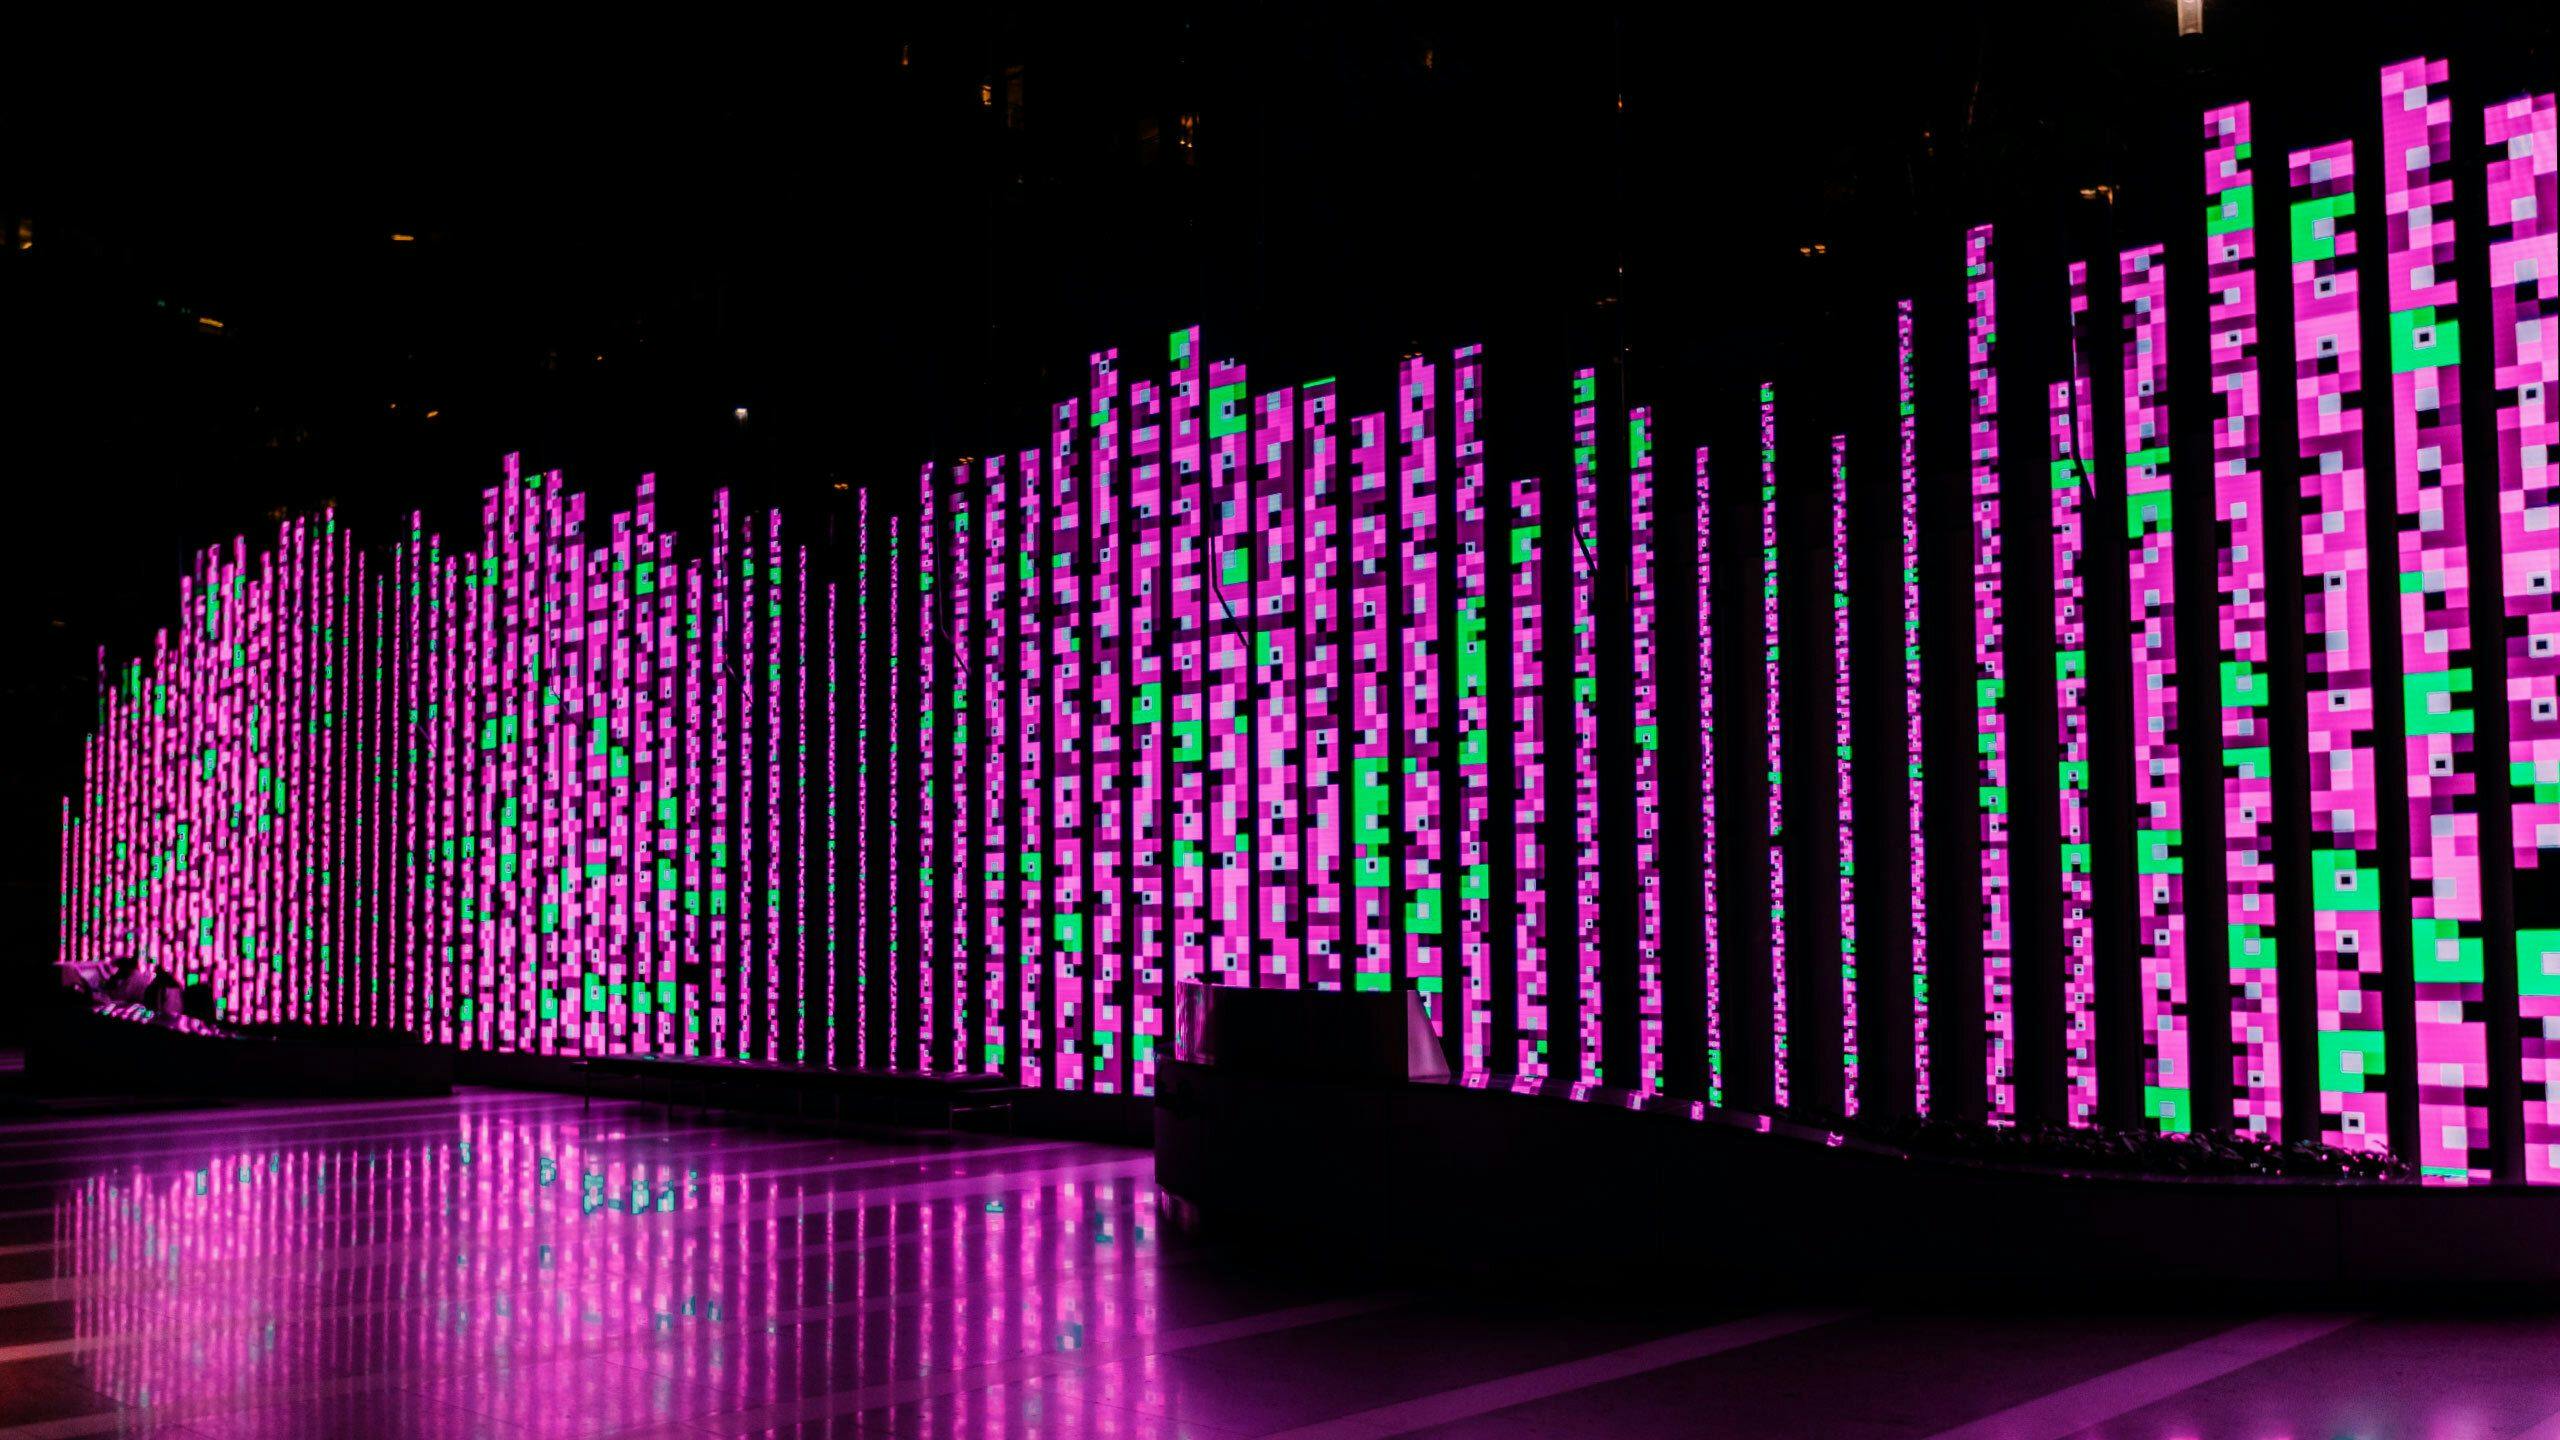
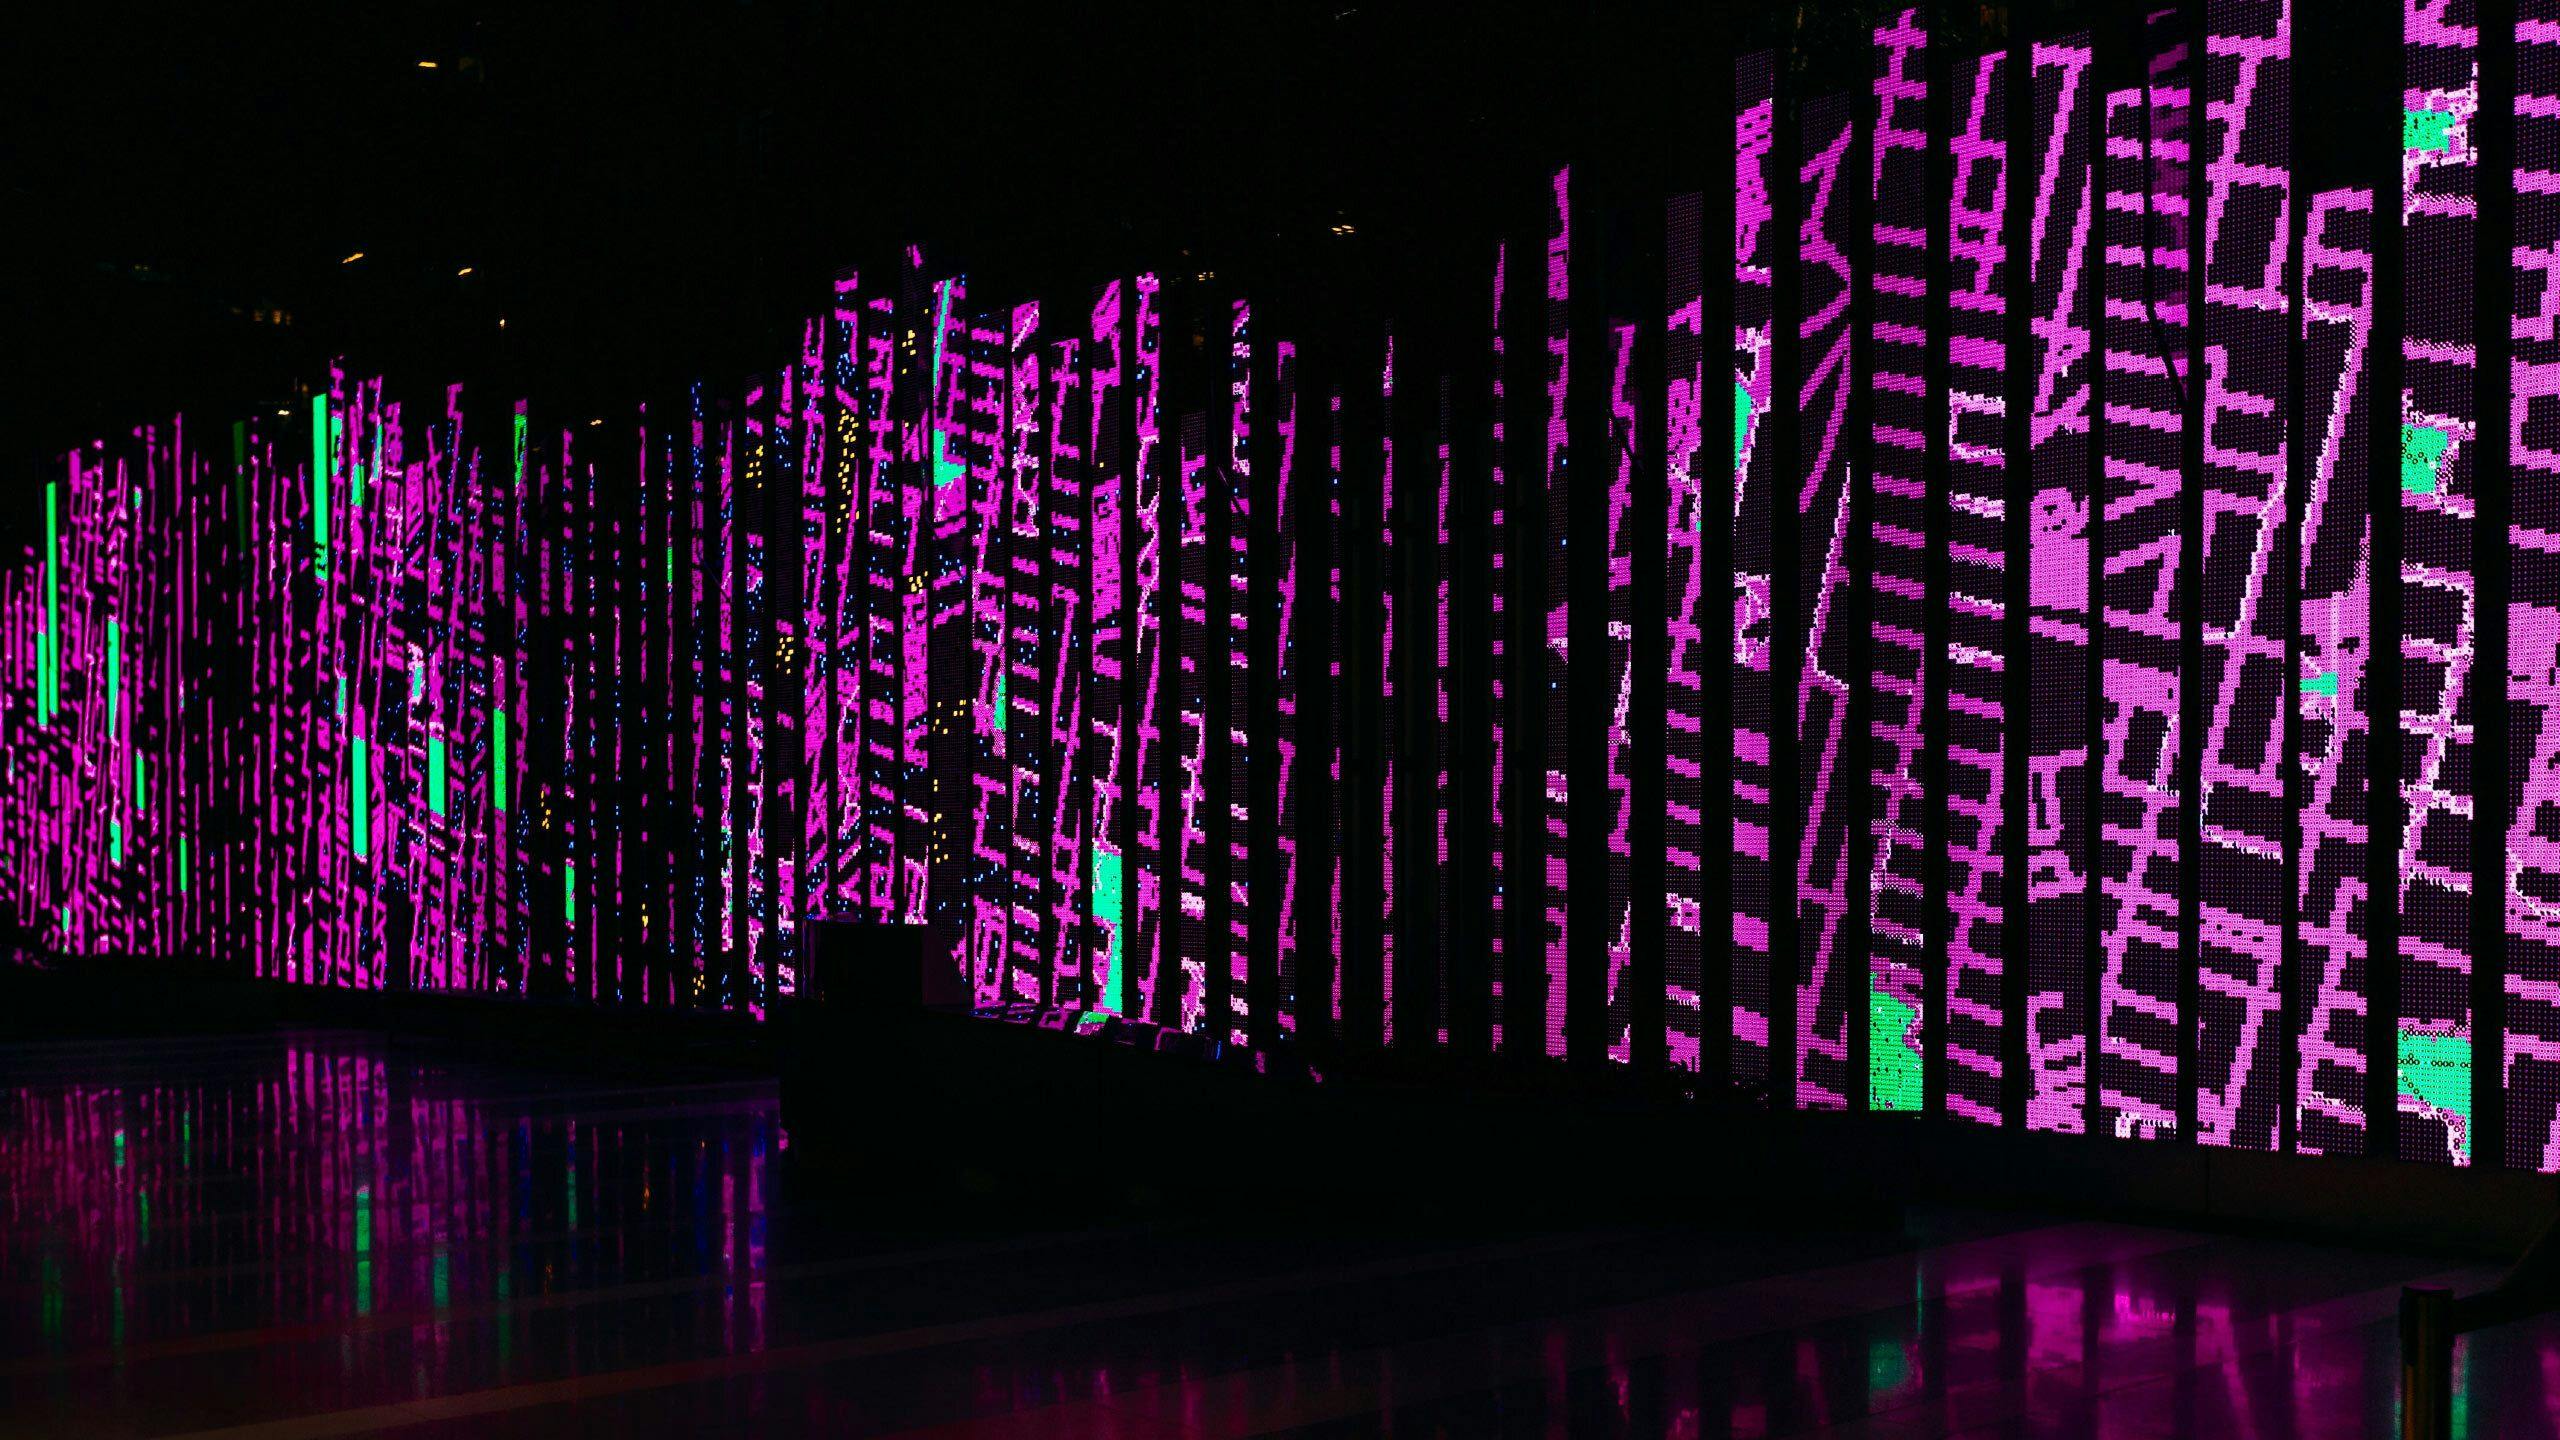
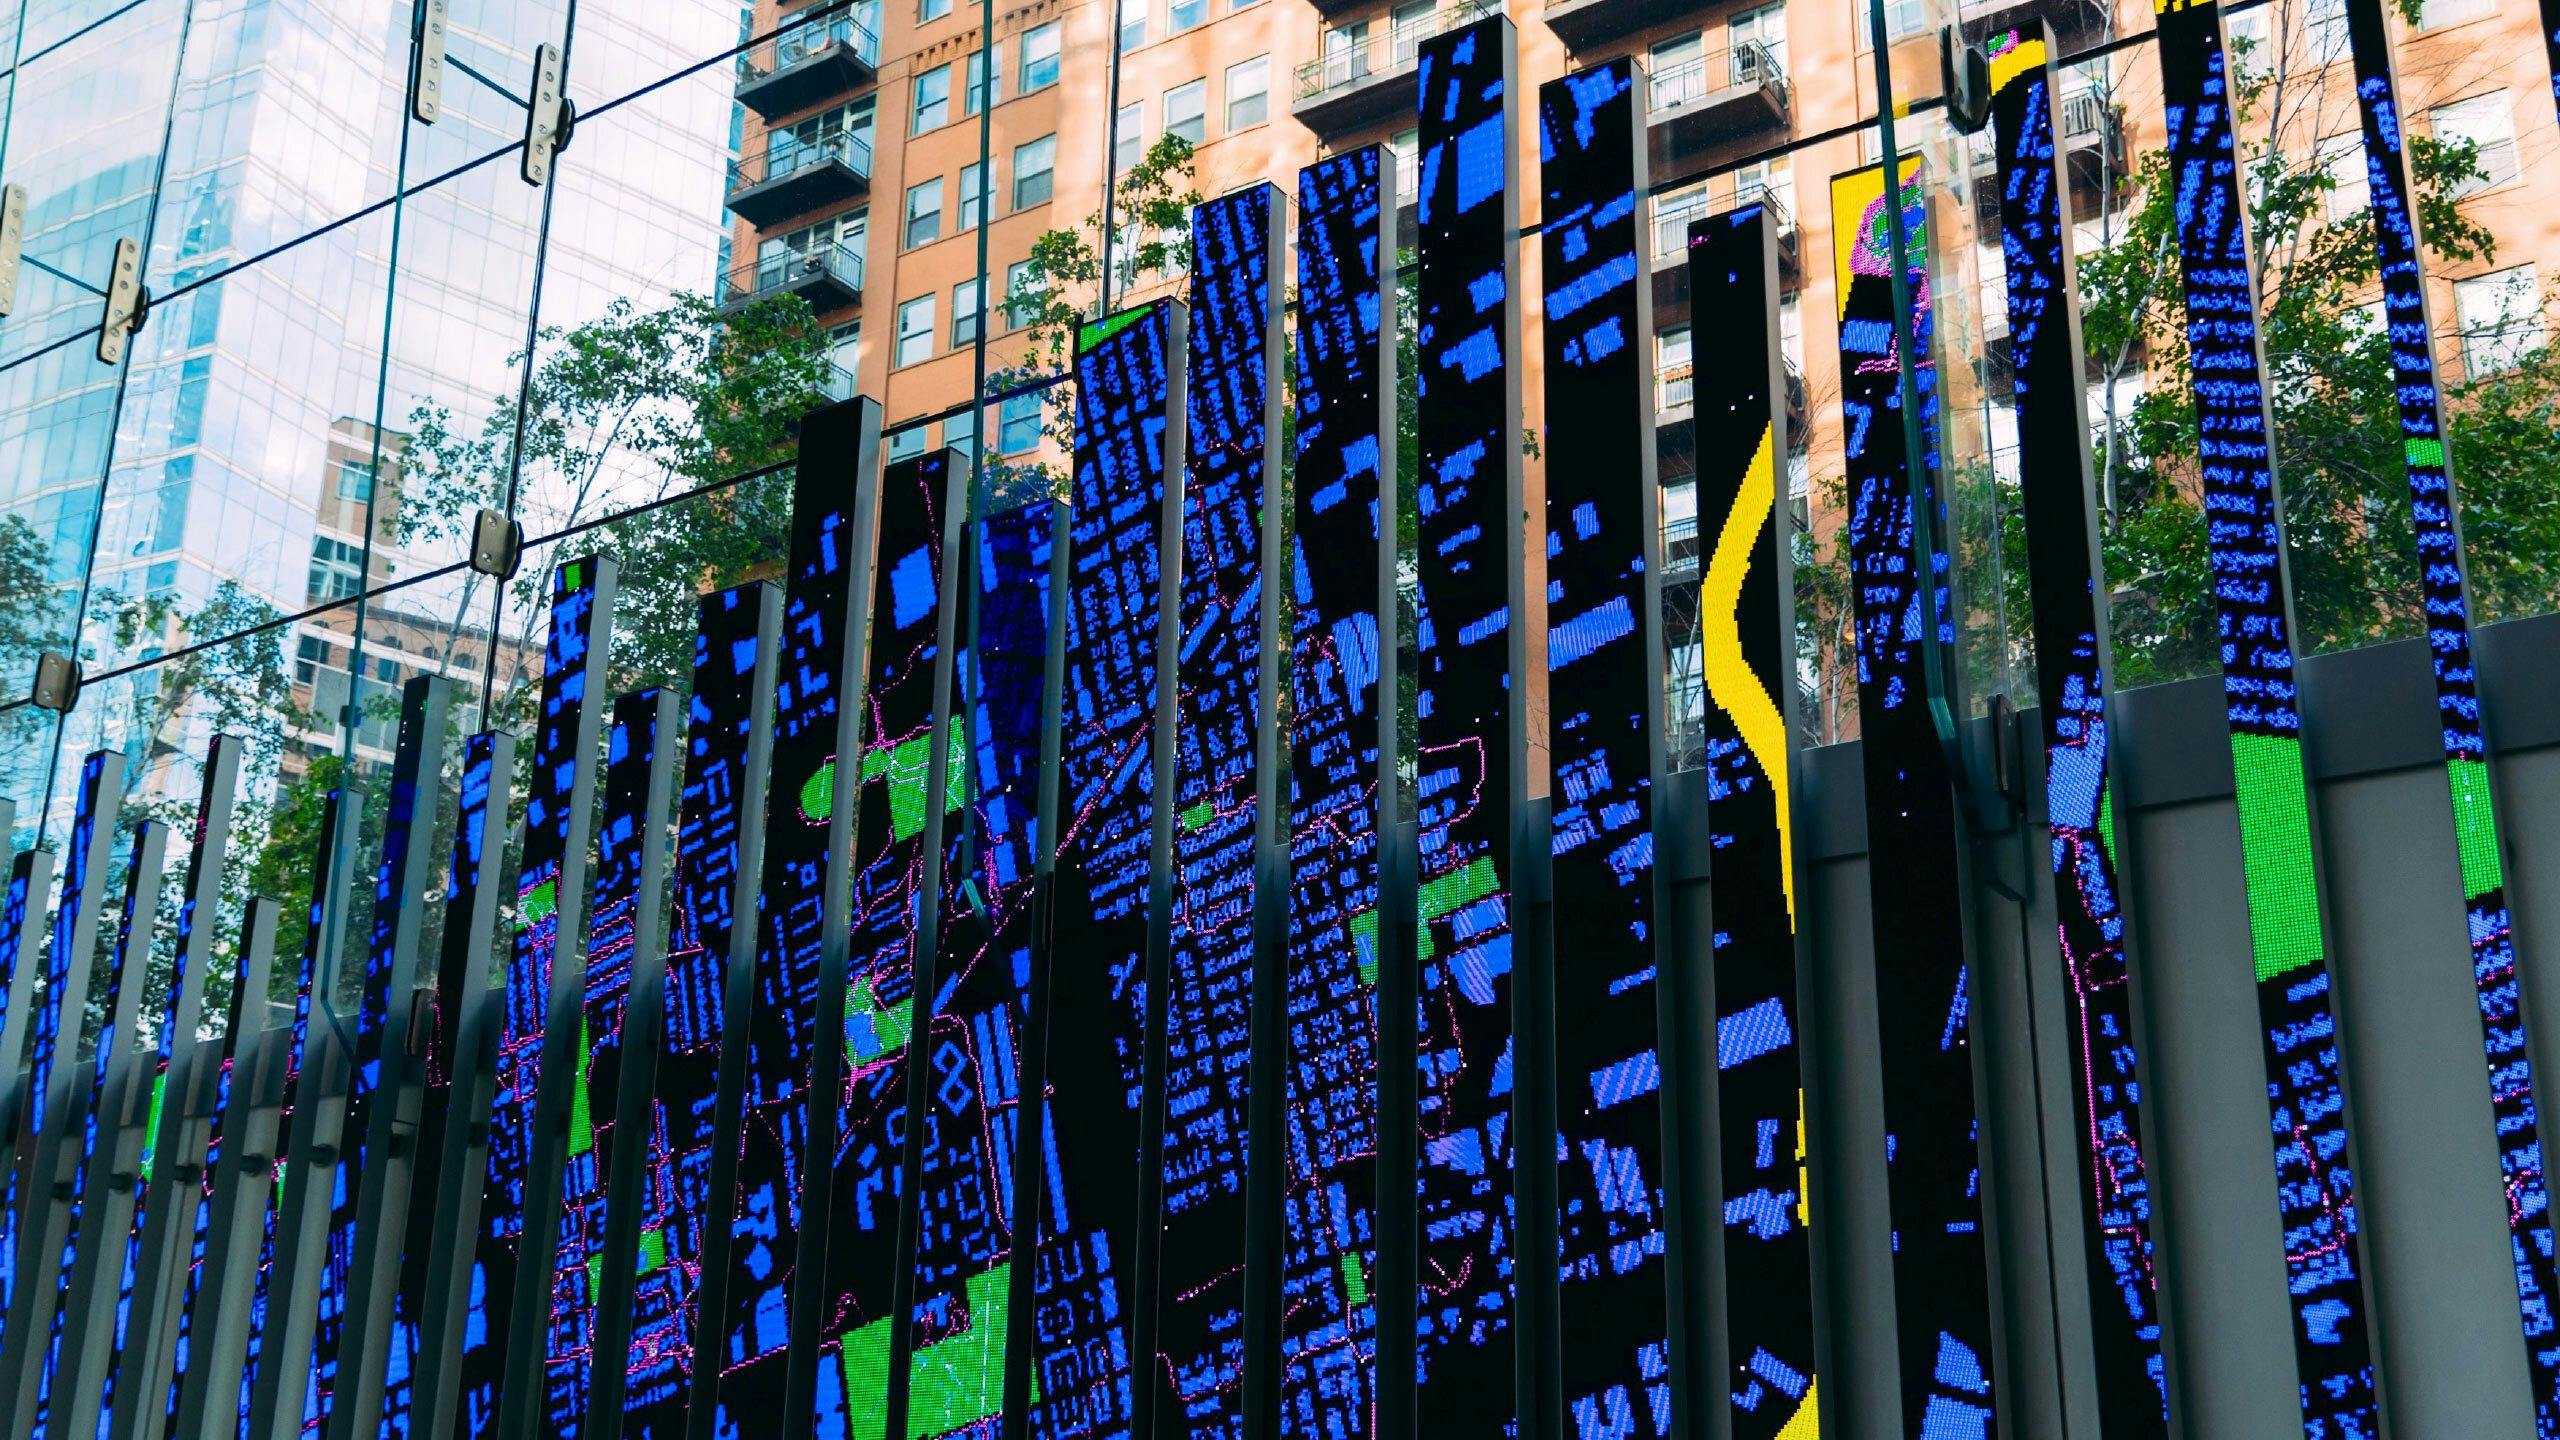
The massive screen (38x6.5 m / 125x21 ft) for which we set out to do visualizations has an unorthodox layout with multiple tall narrow ‘sub’-screens called blades.
Wanting to do justice to this special setup we aimed to design a visualization that caters specifically to this unique geometry.
Design
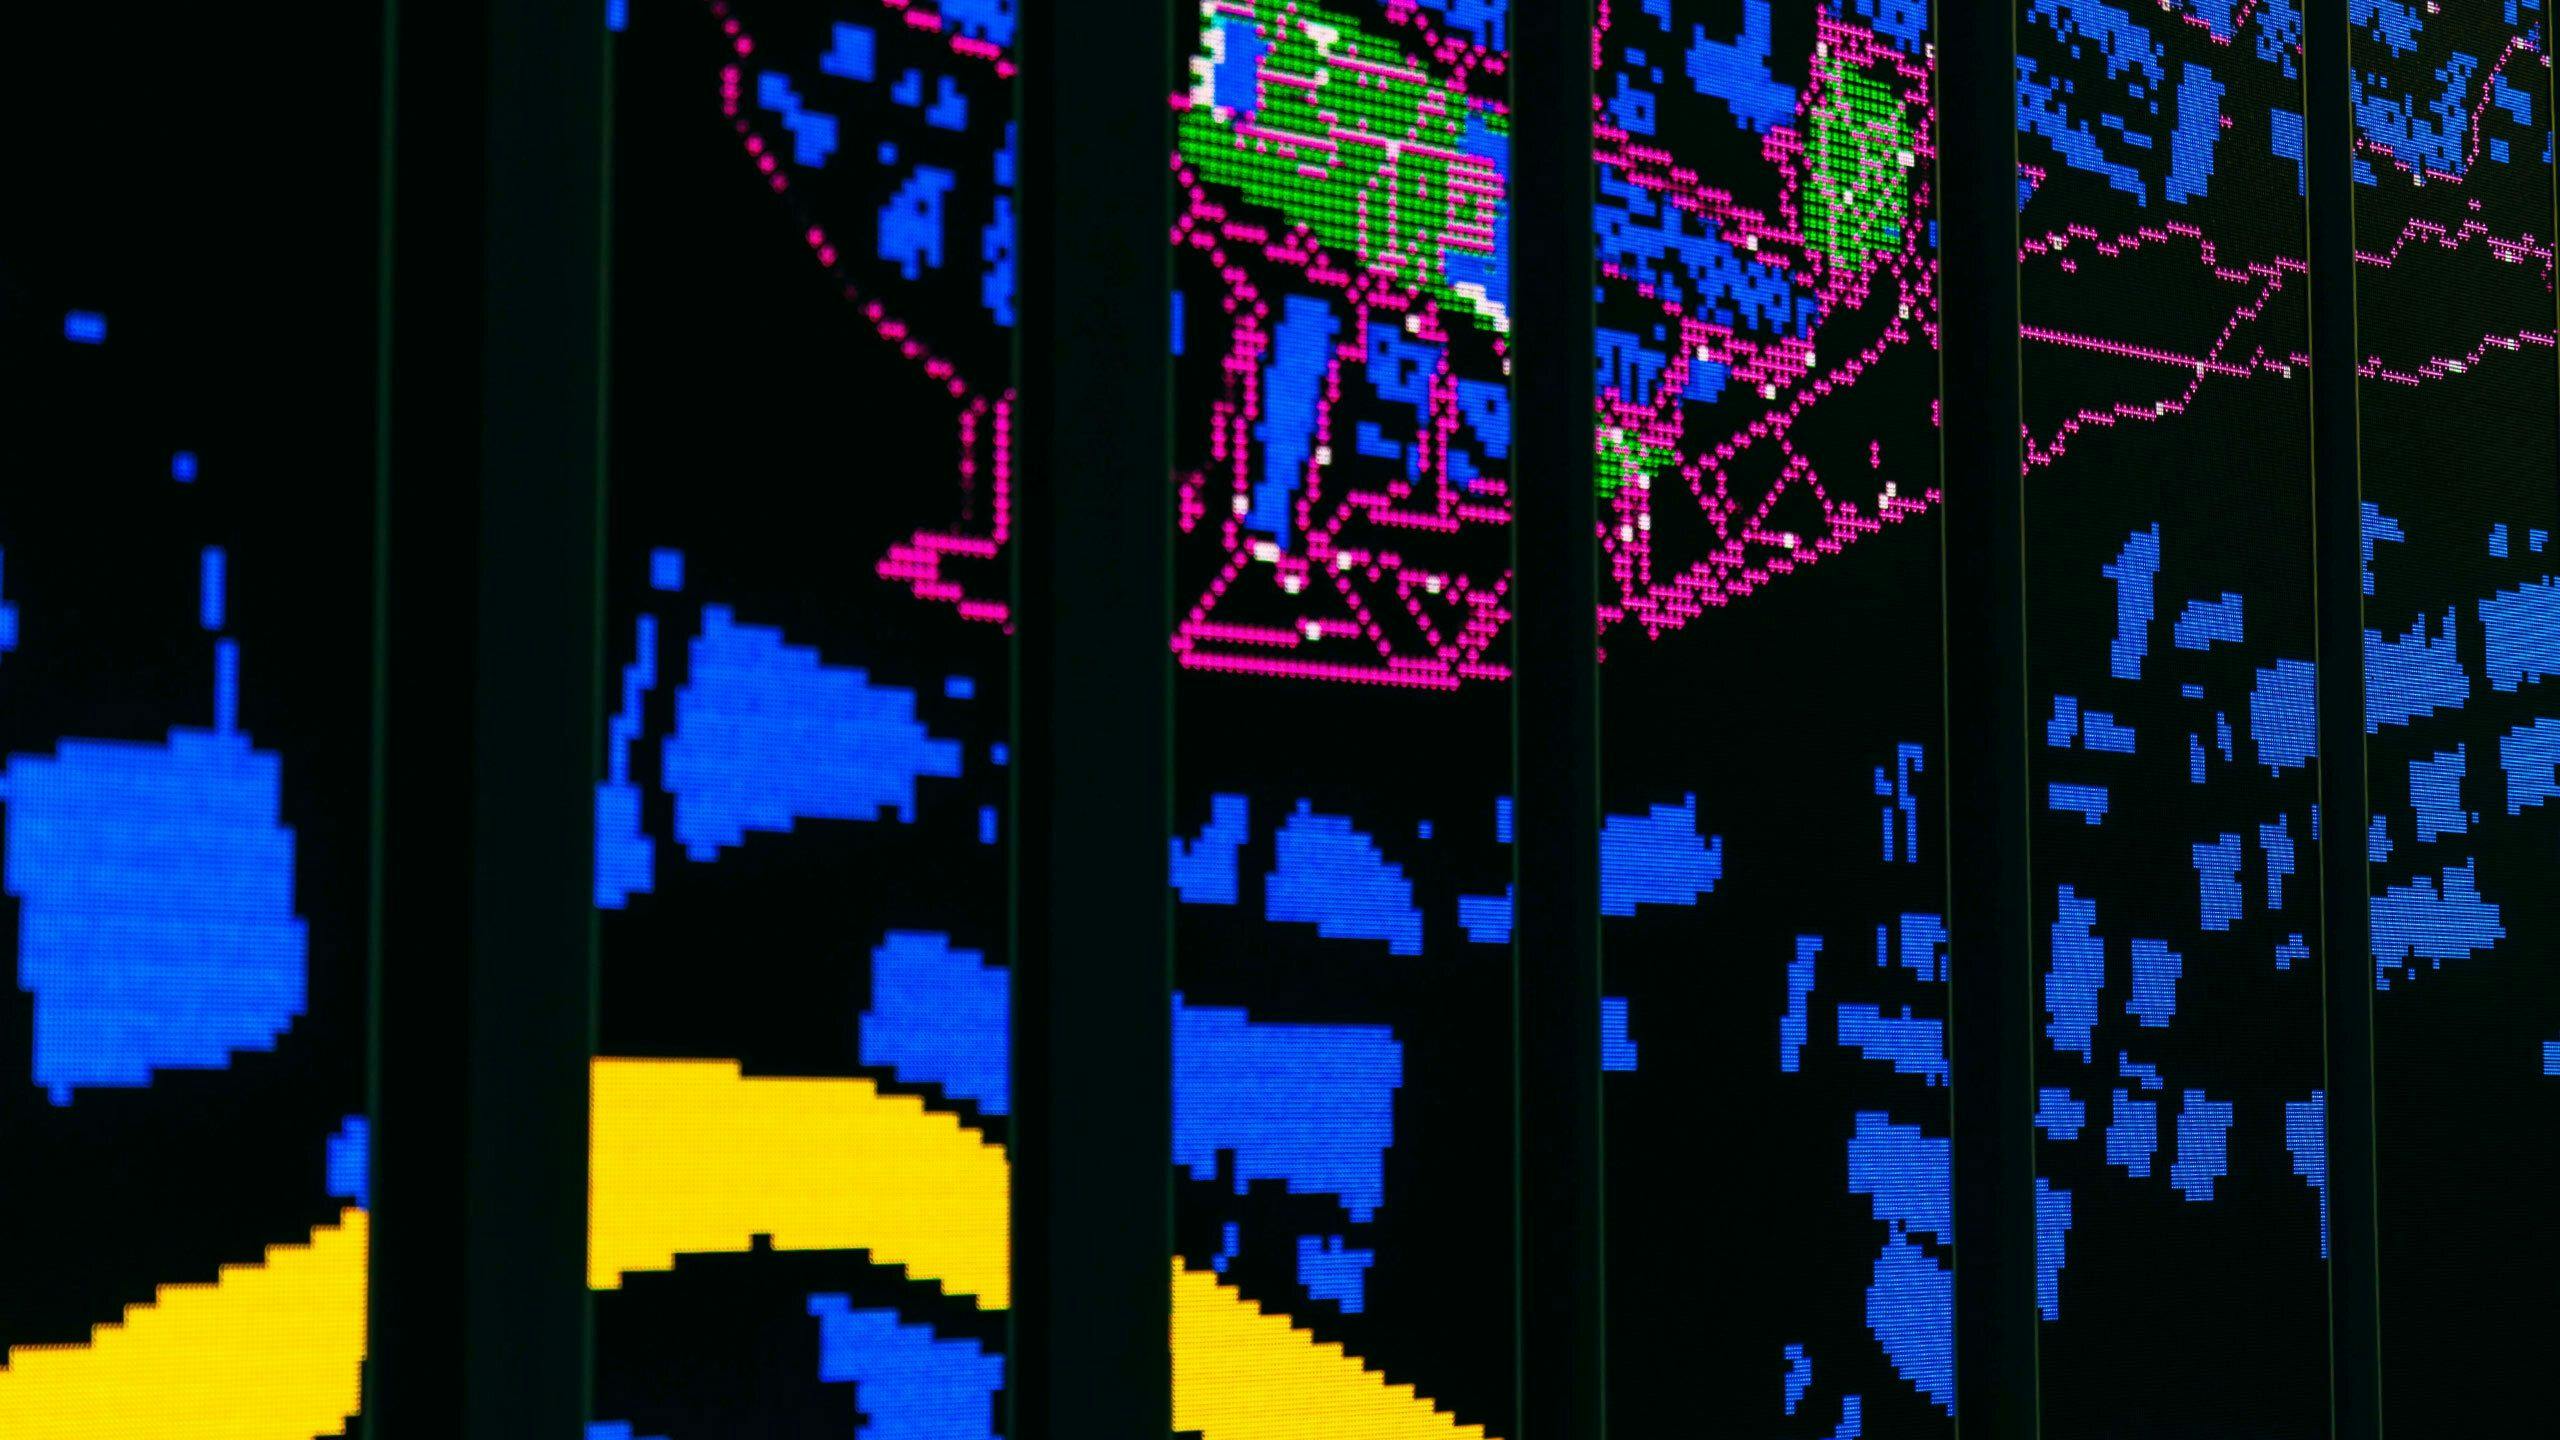
As the ants move around on a raster map, and the output is in pixels, we visualized everything on a scalable, square grid.
The pheromones deposited on routes evaporate over time. On more successful (sub-)routes more pheromones will accumulate. All optimal solutions (routes) between different parks are stored.
When shorter routes between parks are found, they replace the longer routes. Eventually, the shortest routes between parks will emerge.
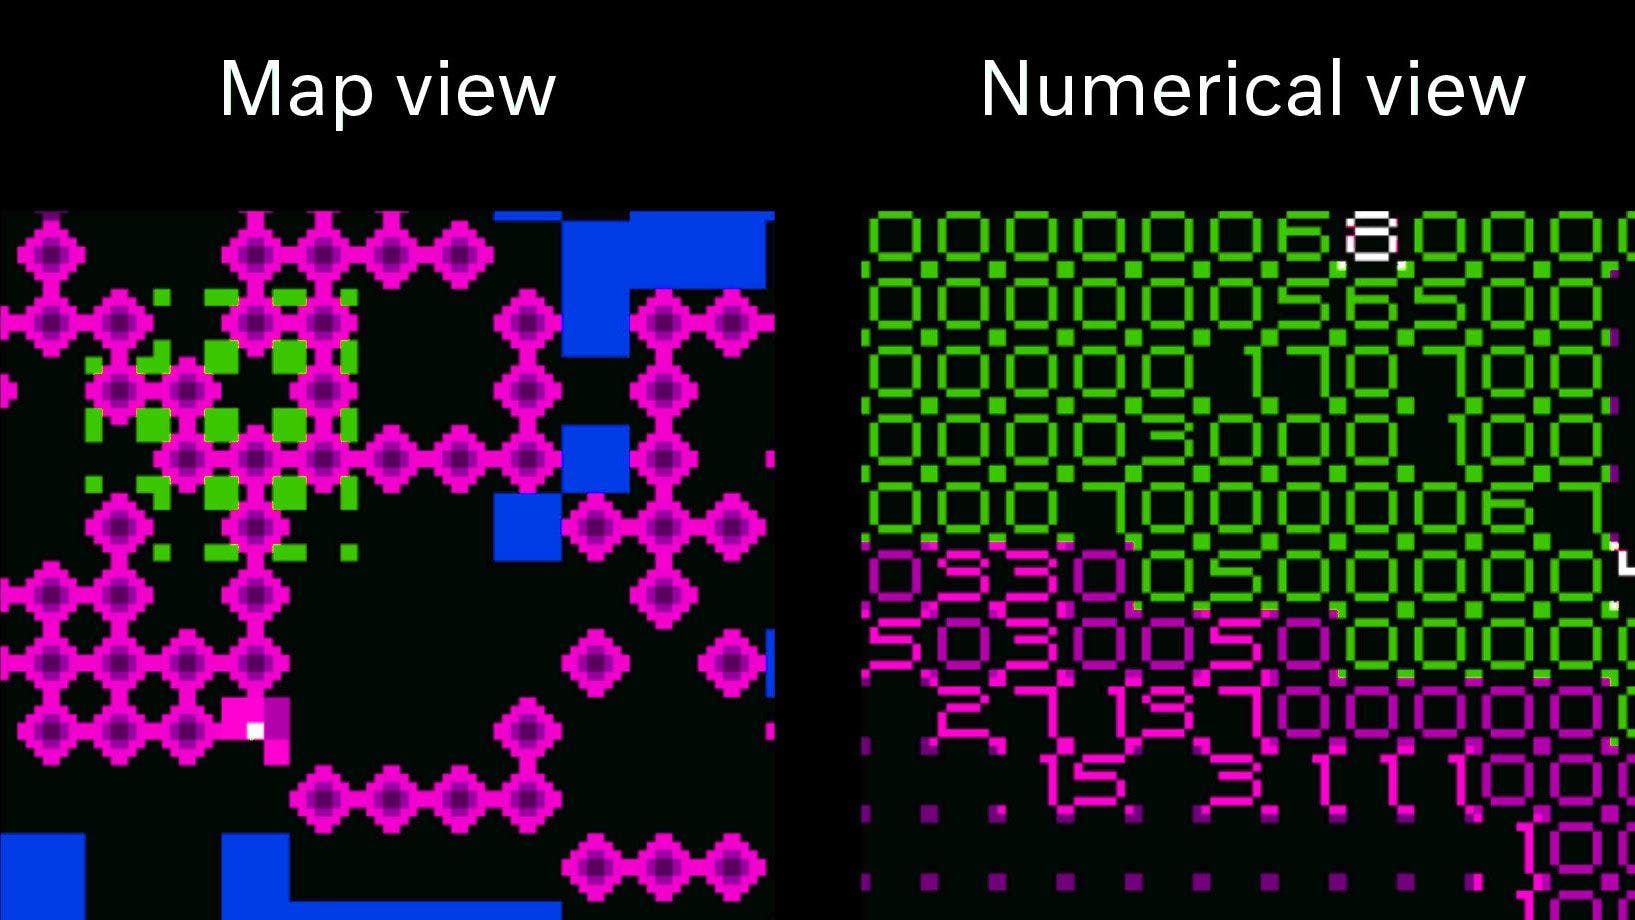
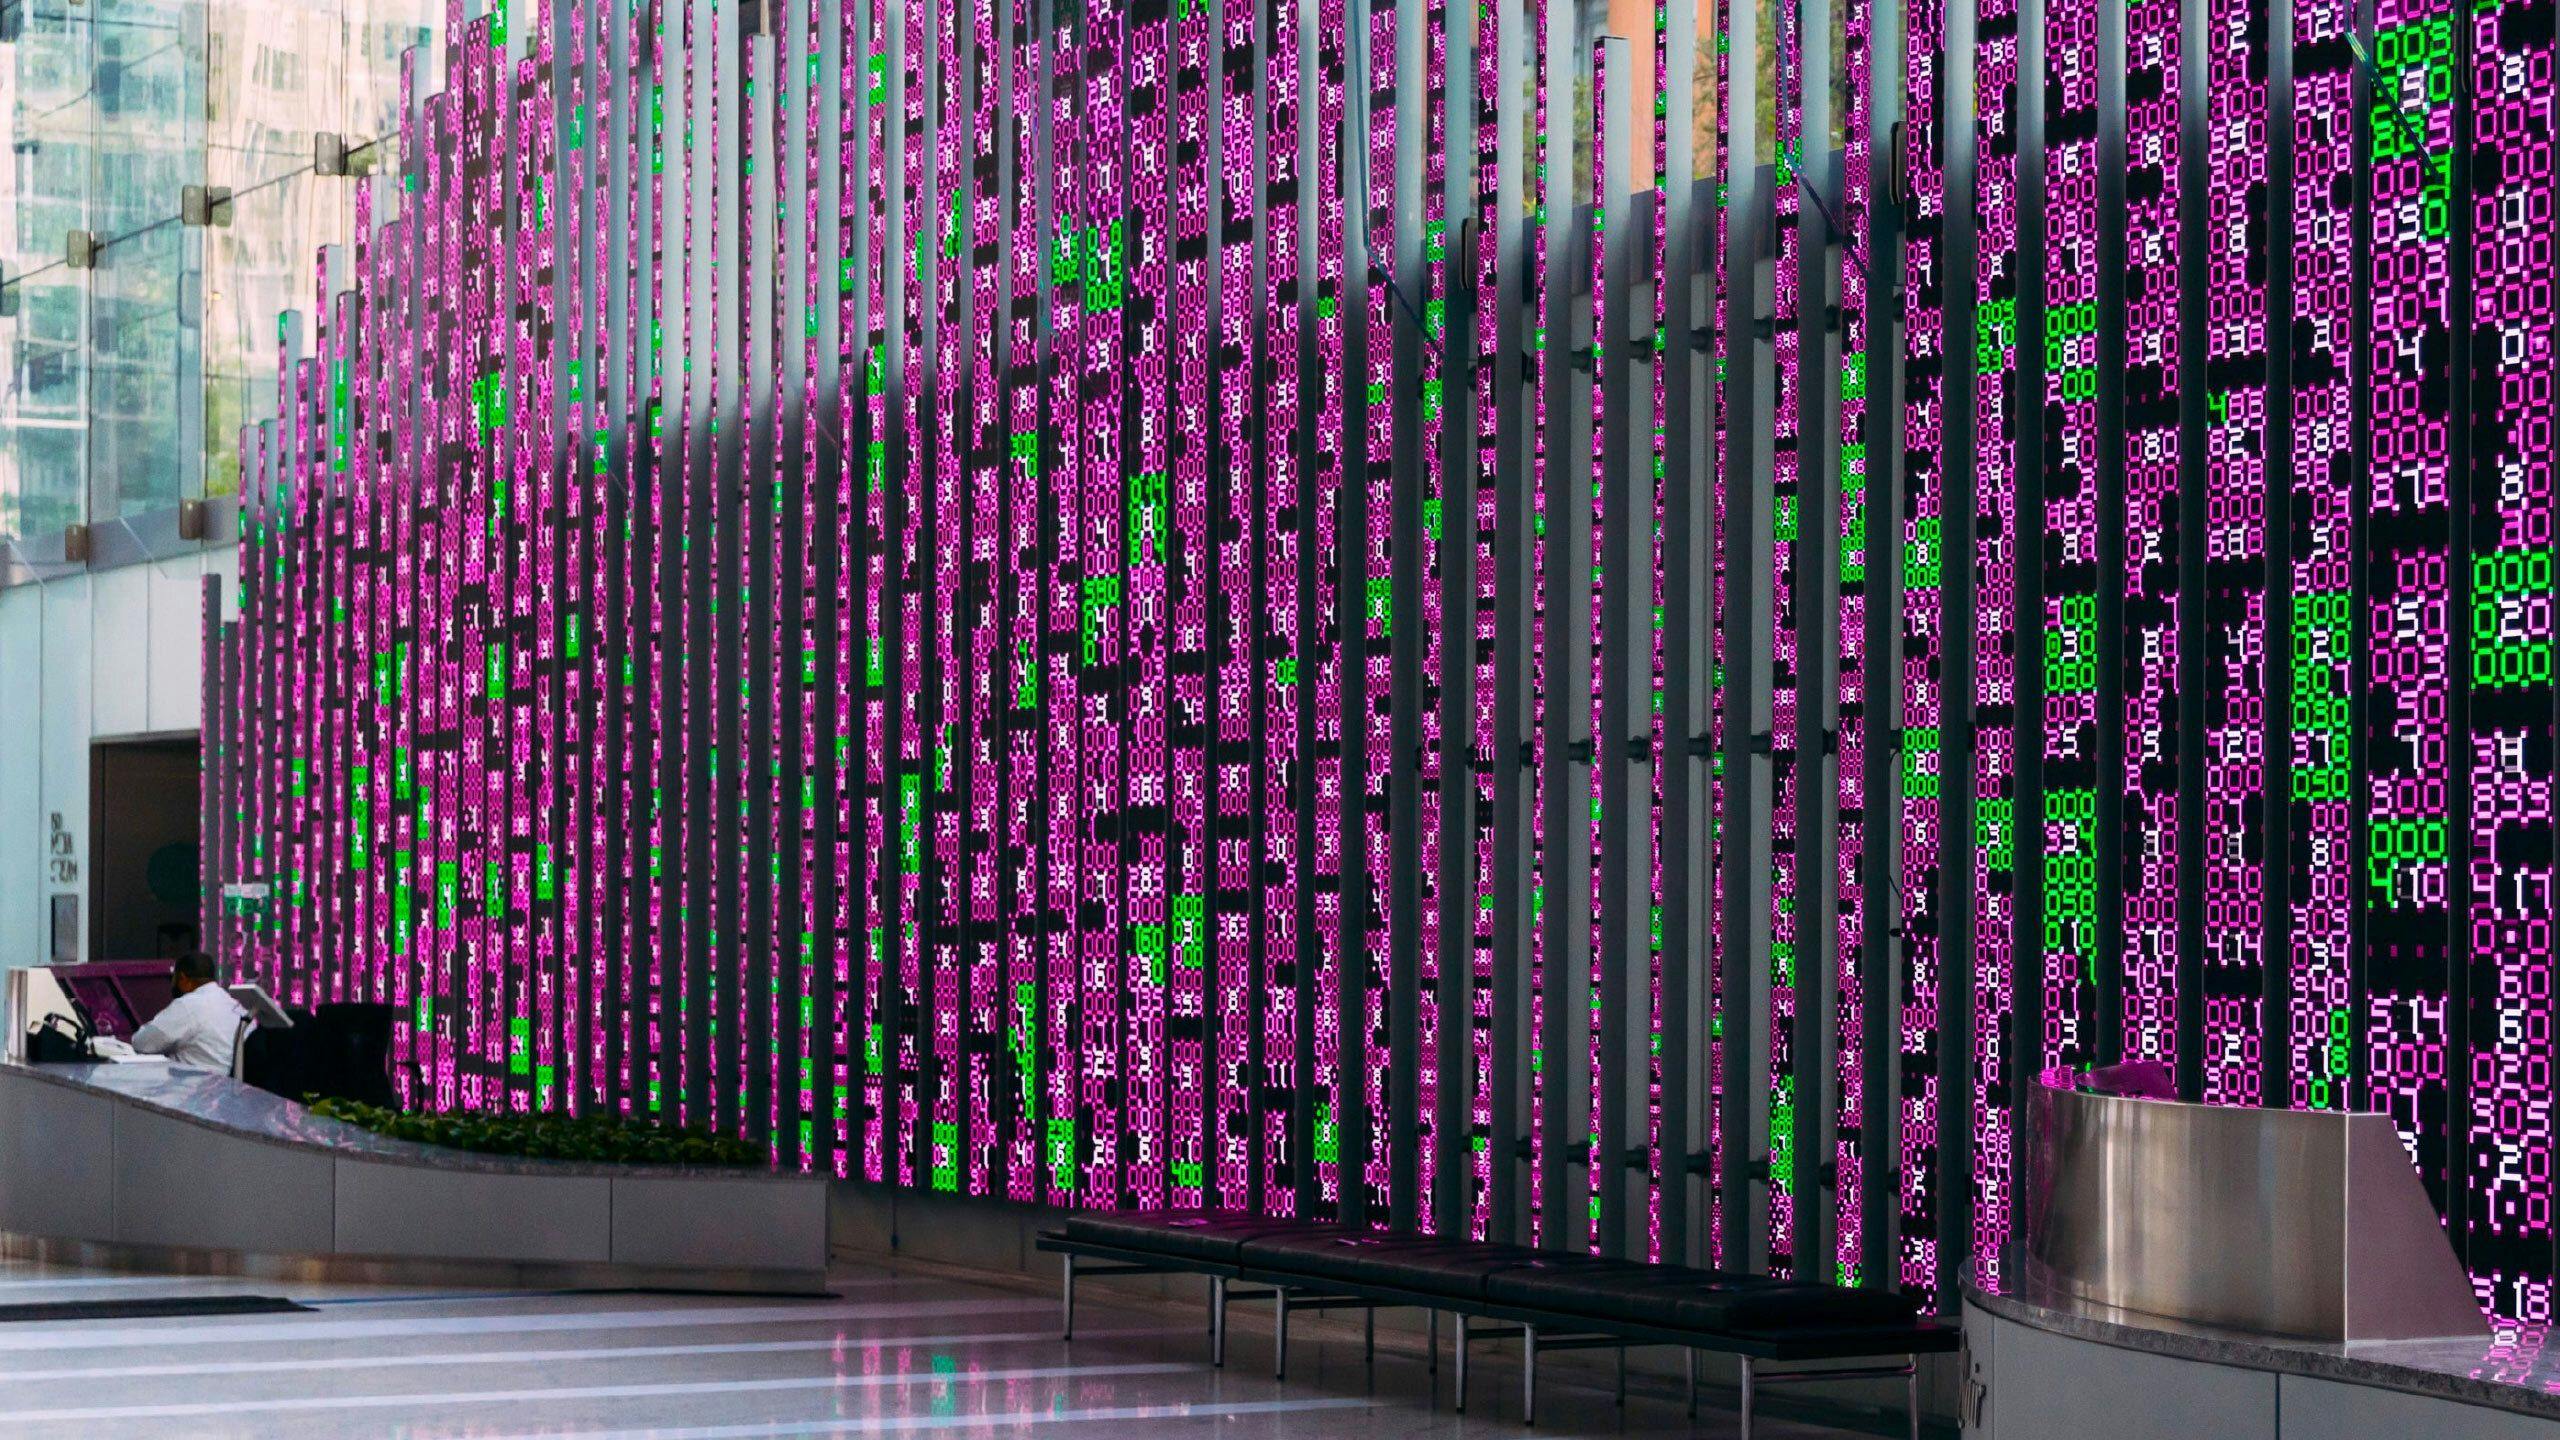
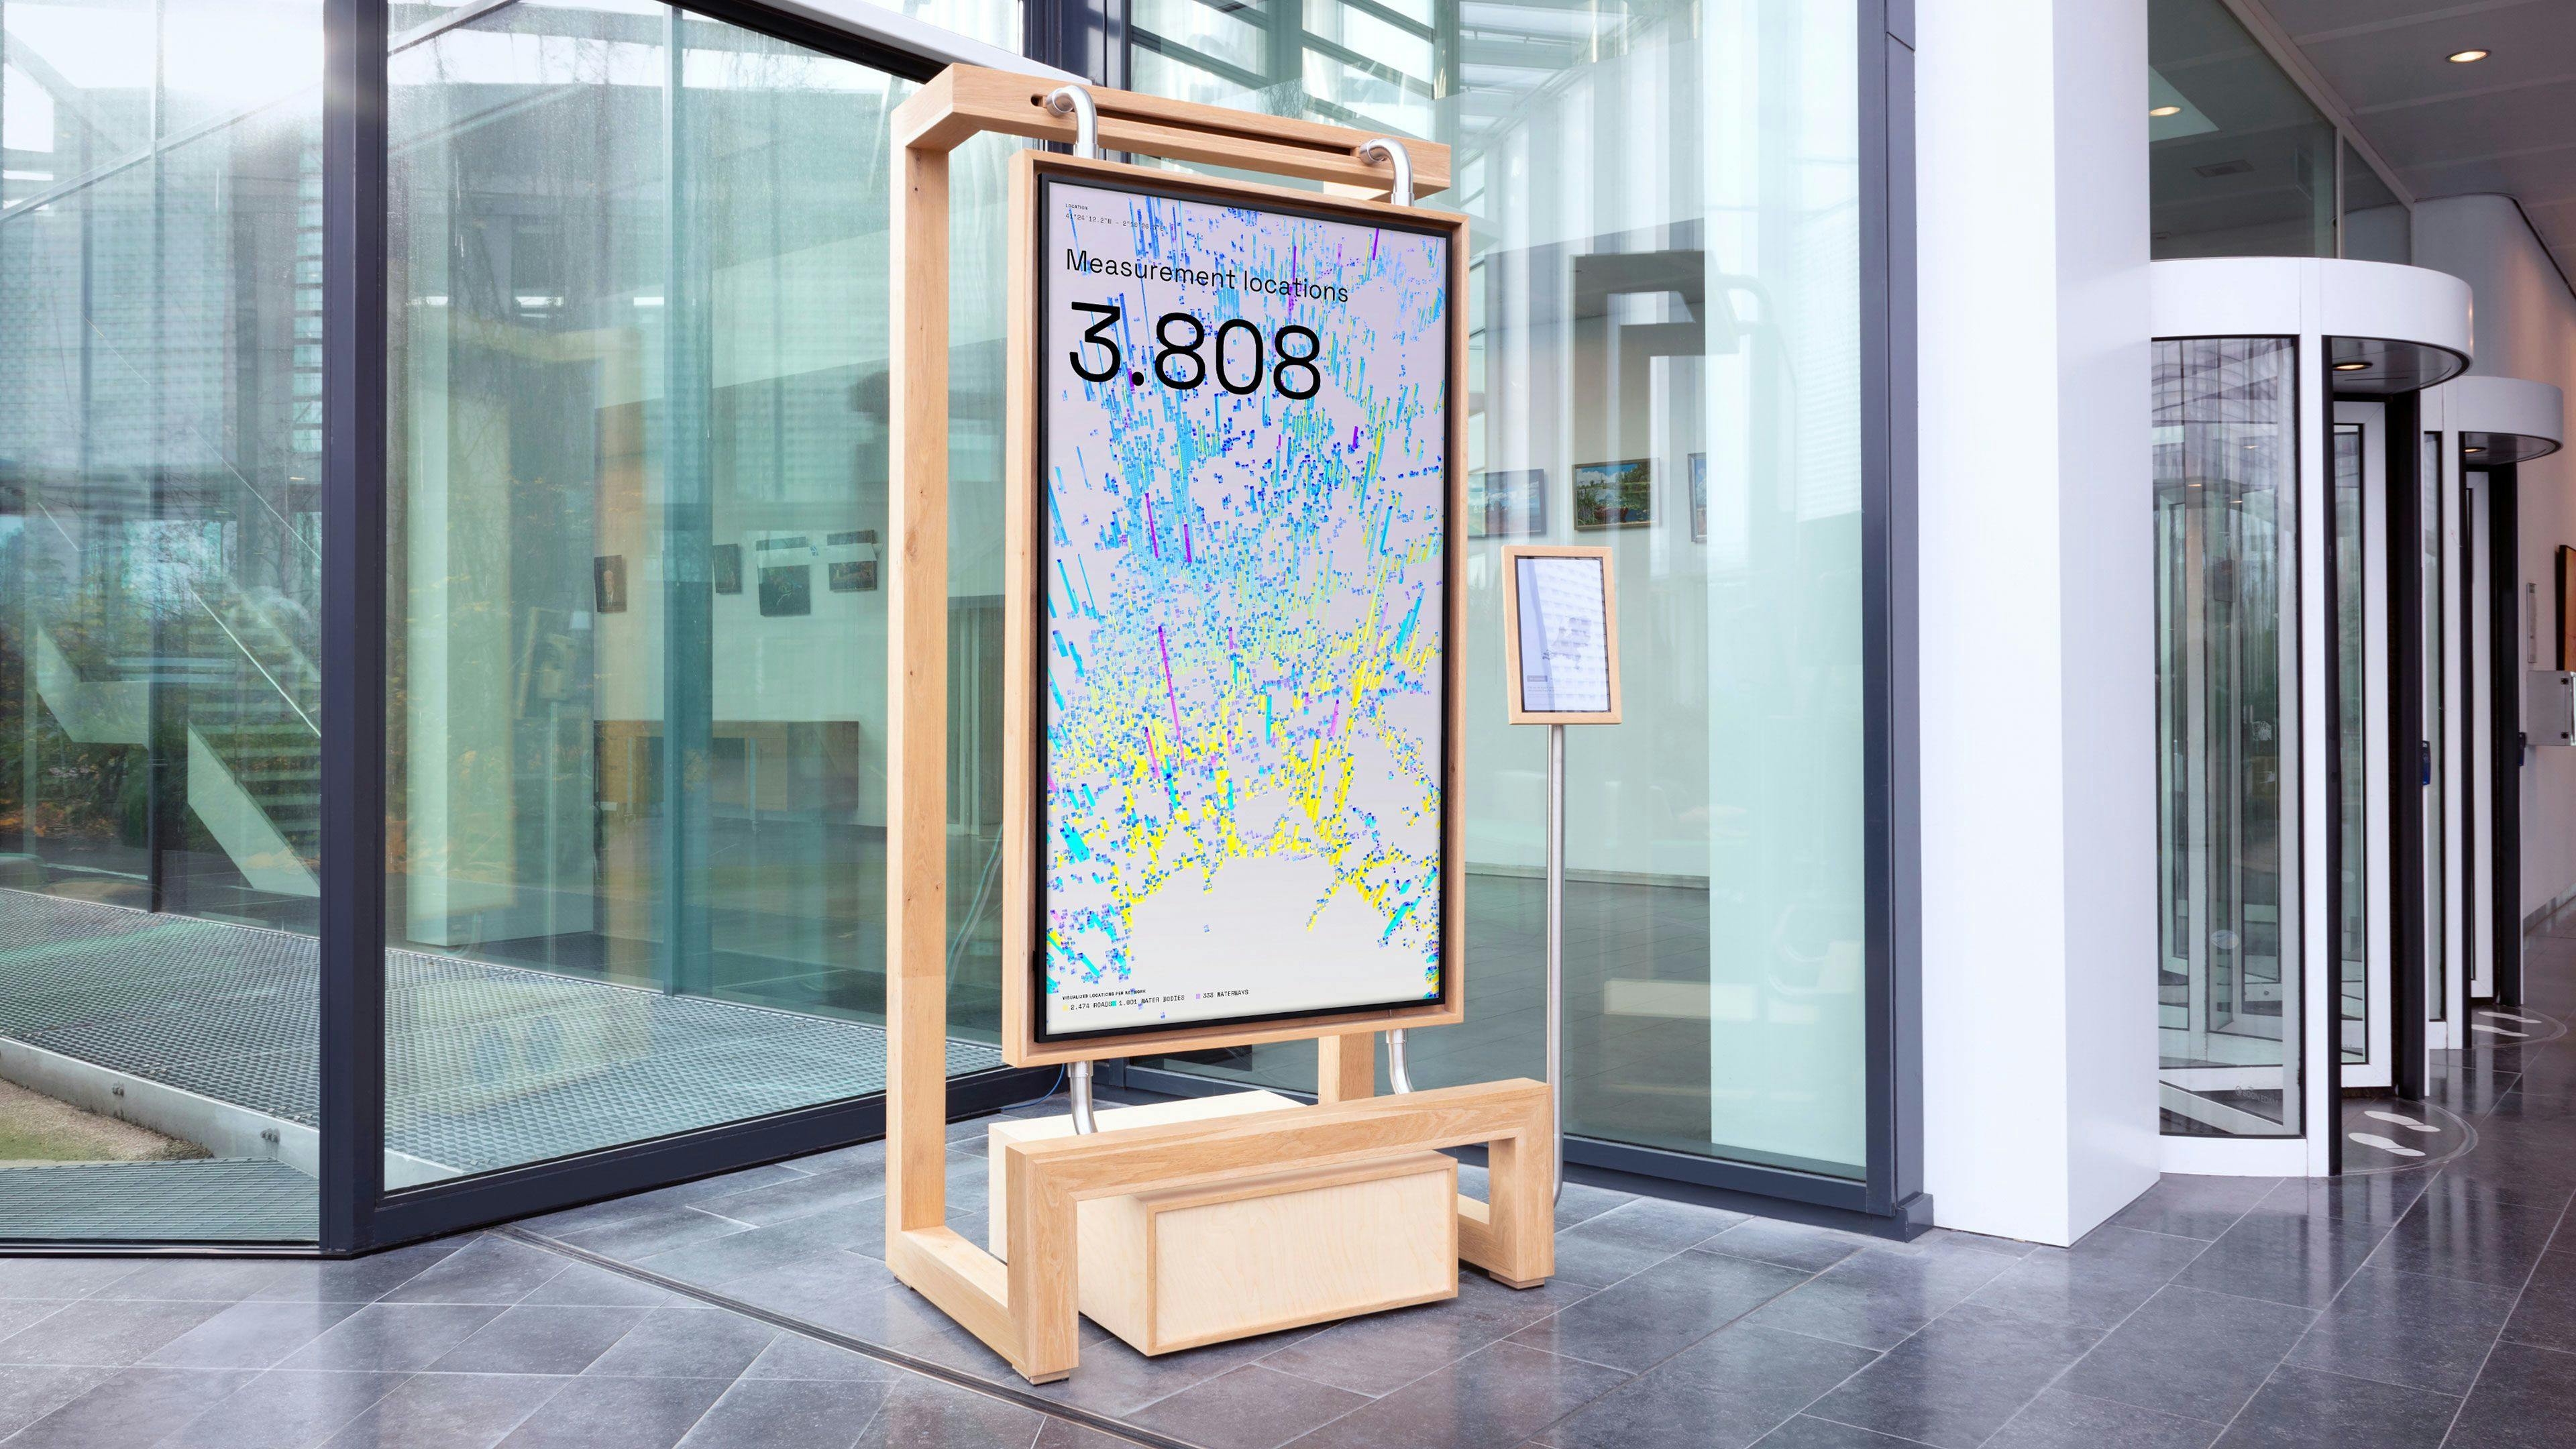
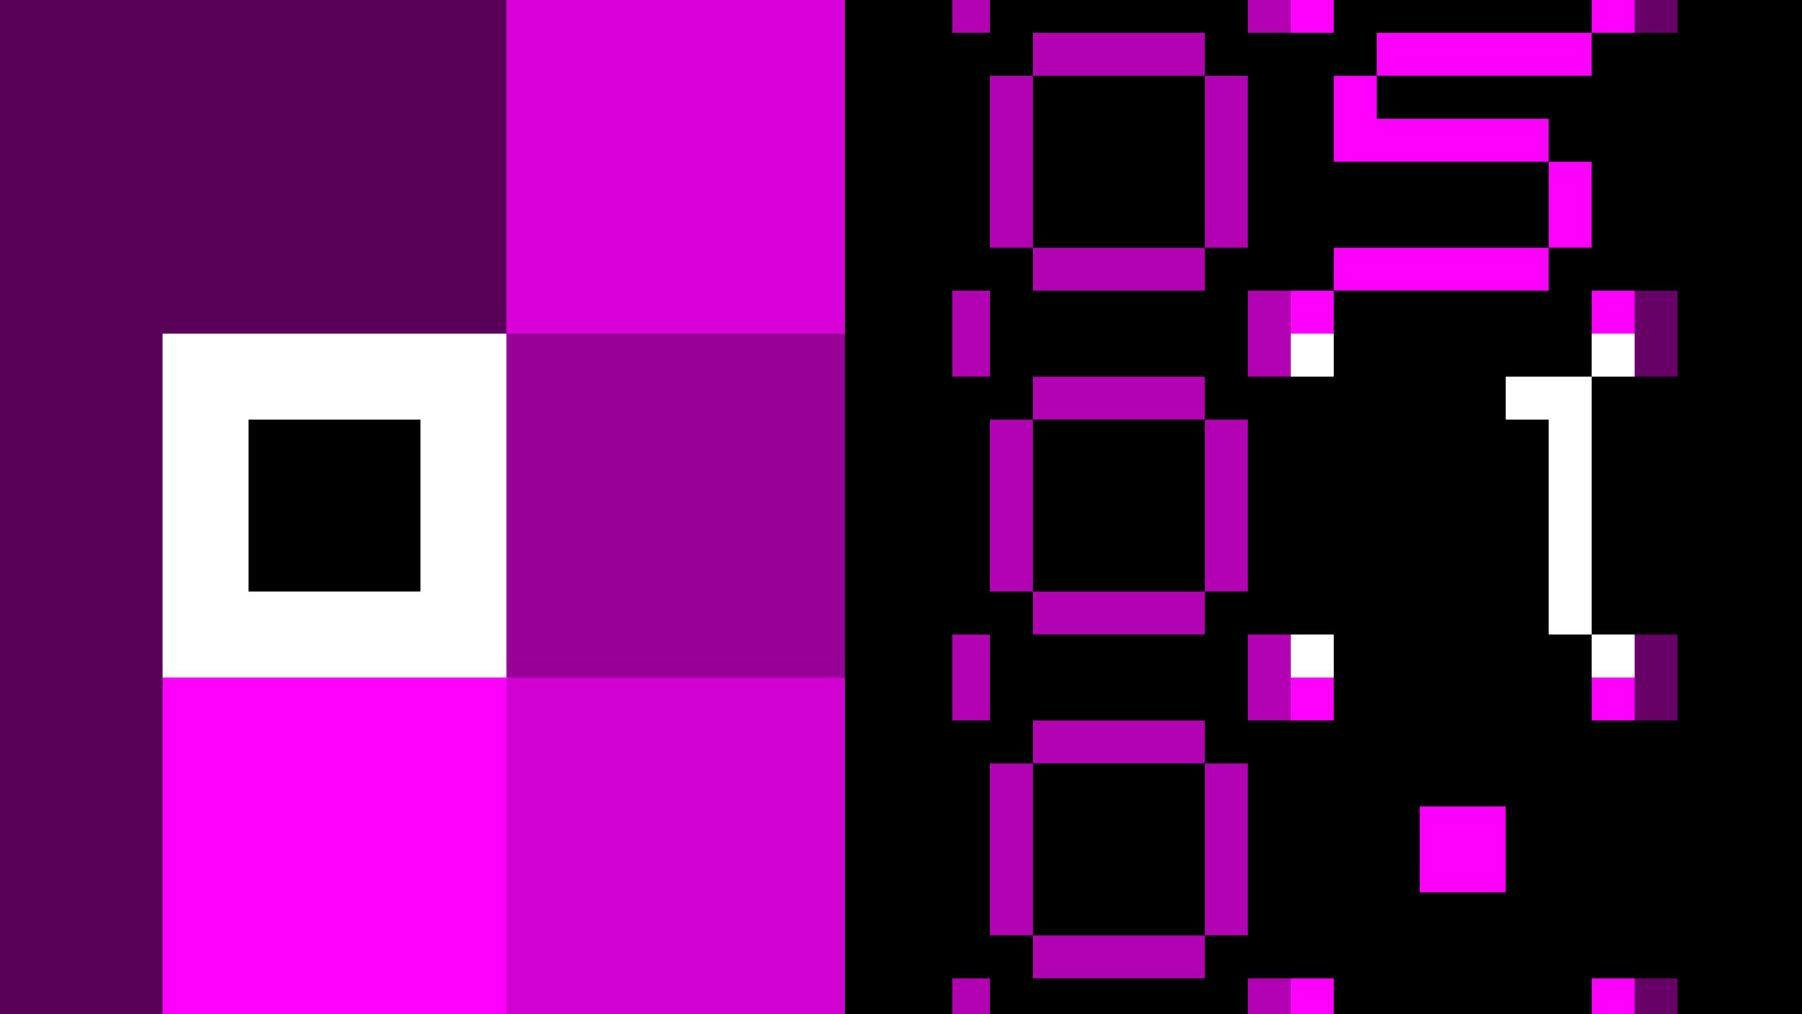
Mapandnumericalviews
To show that each tile in the map is encoded in numerical values (pheromone levels, parks' IDs), the visualization occasionally switches between map view and numerical view.
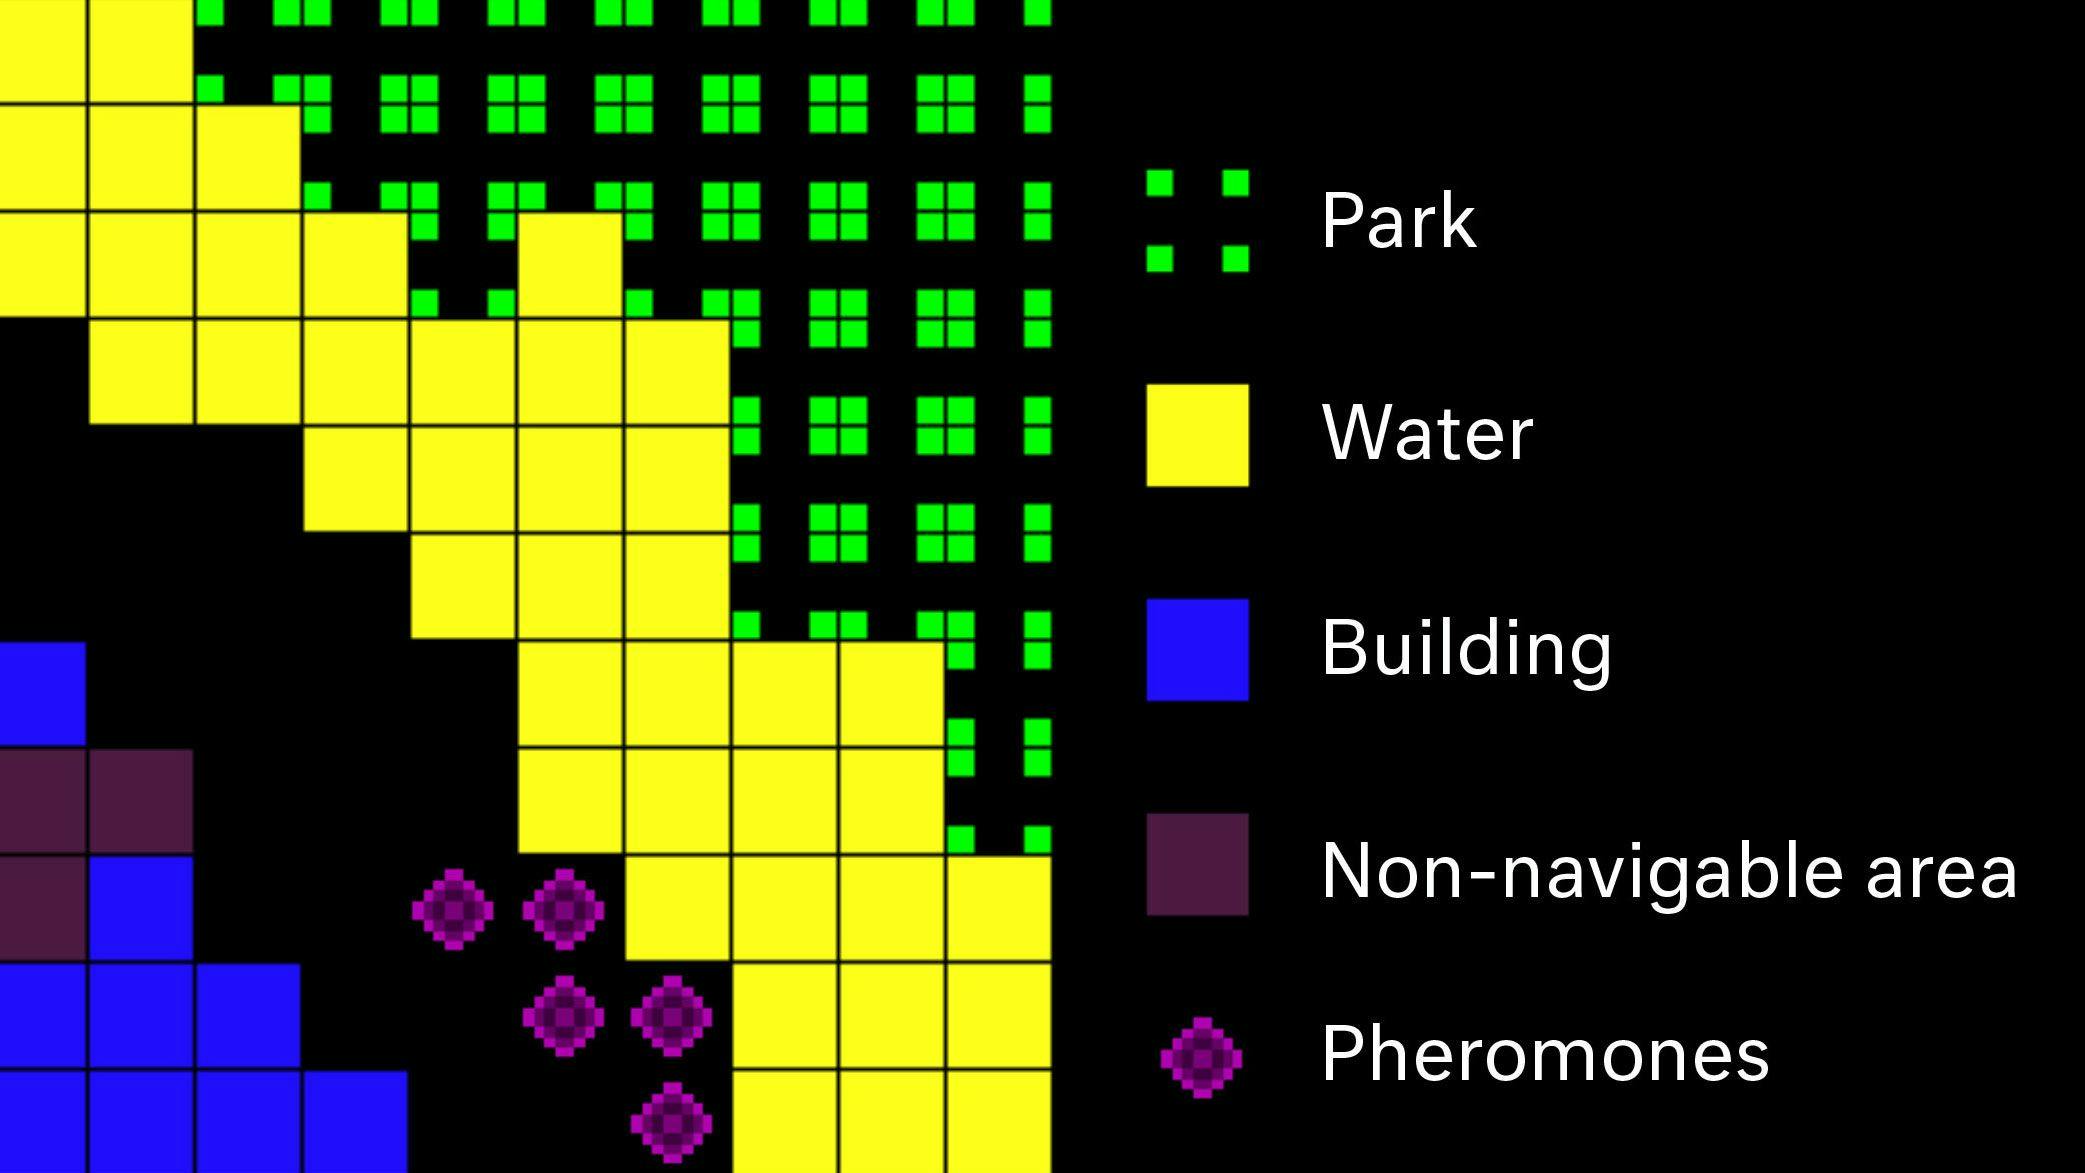
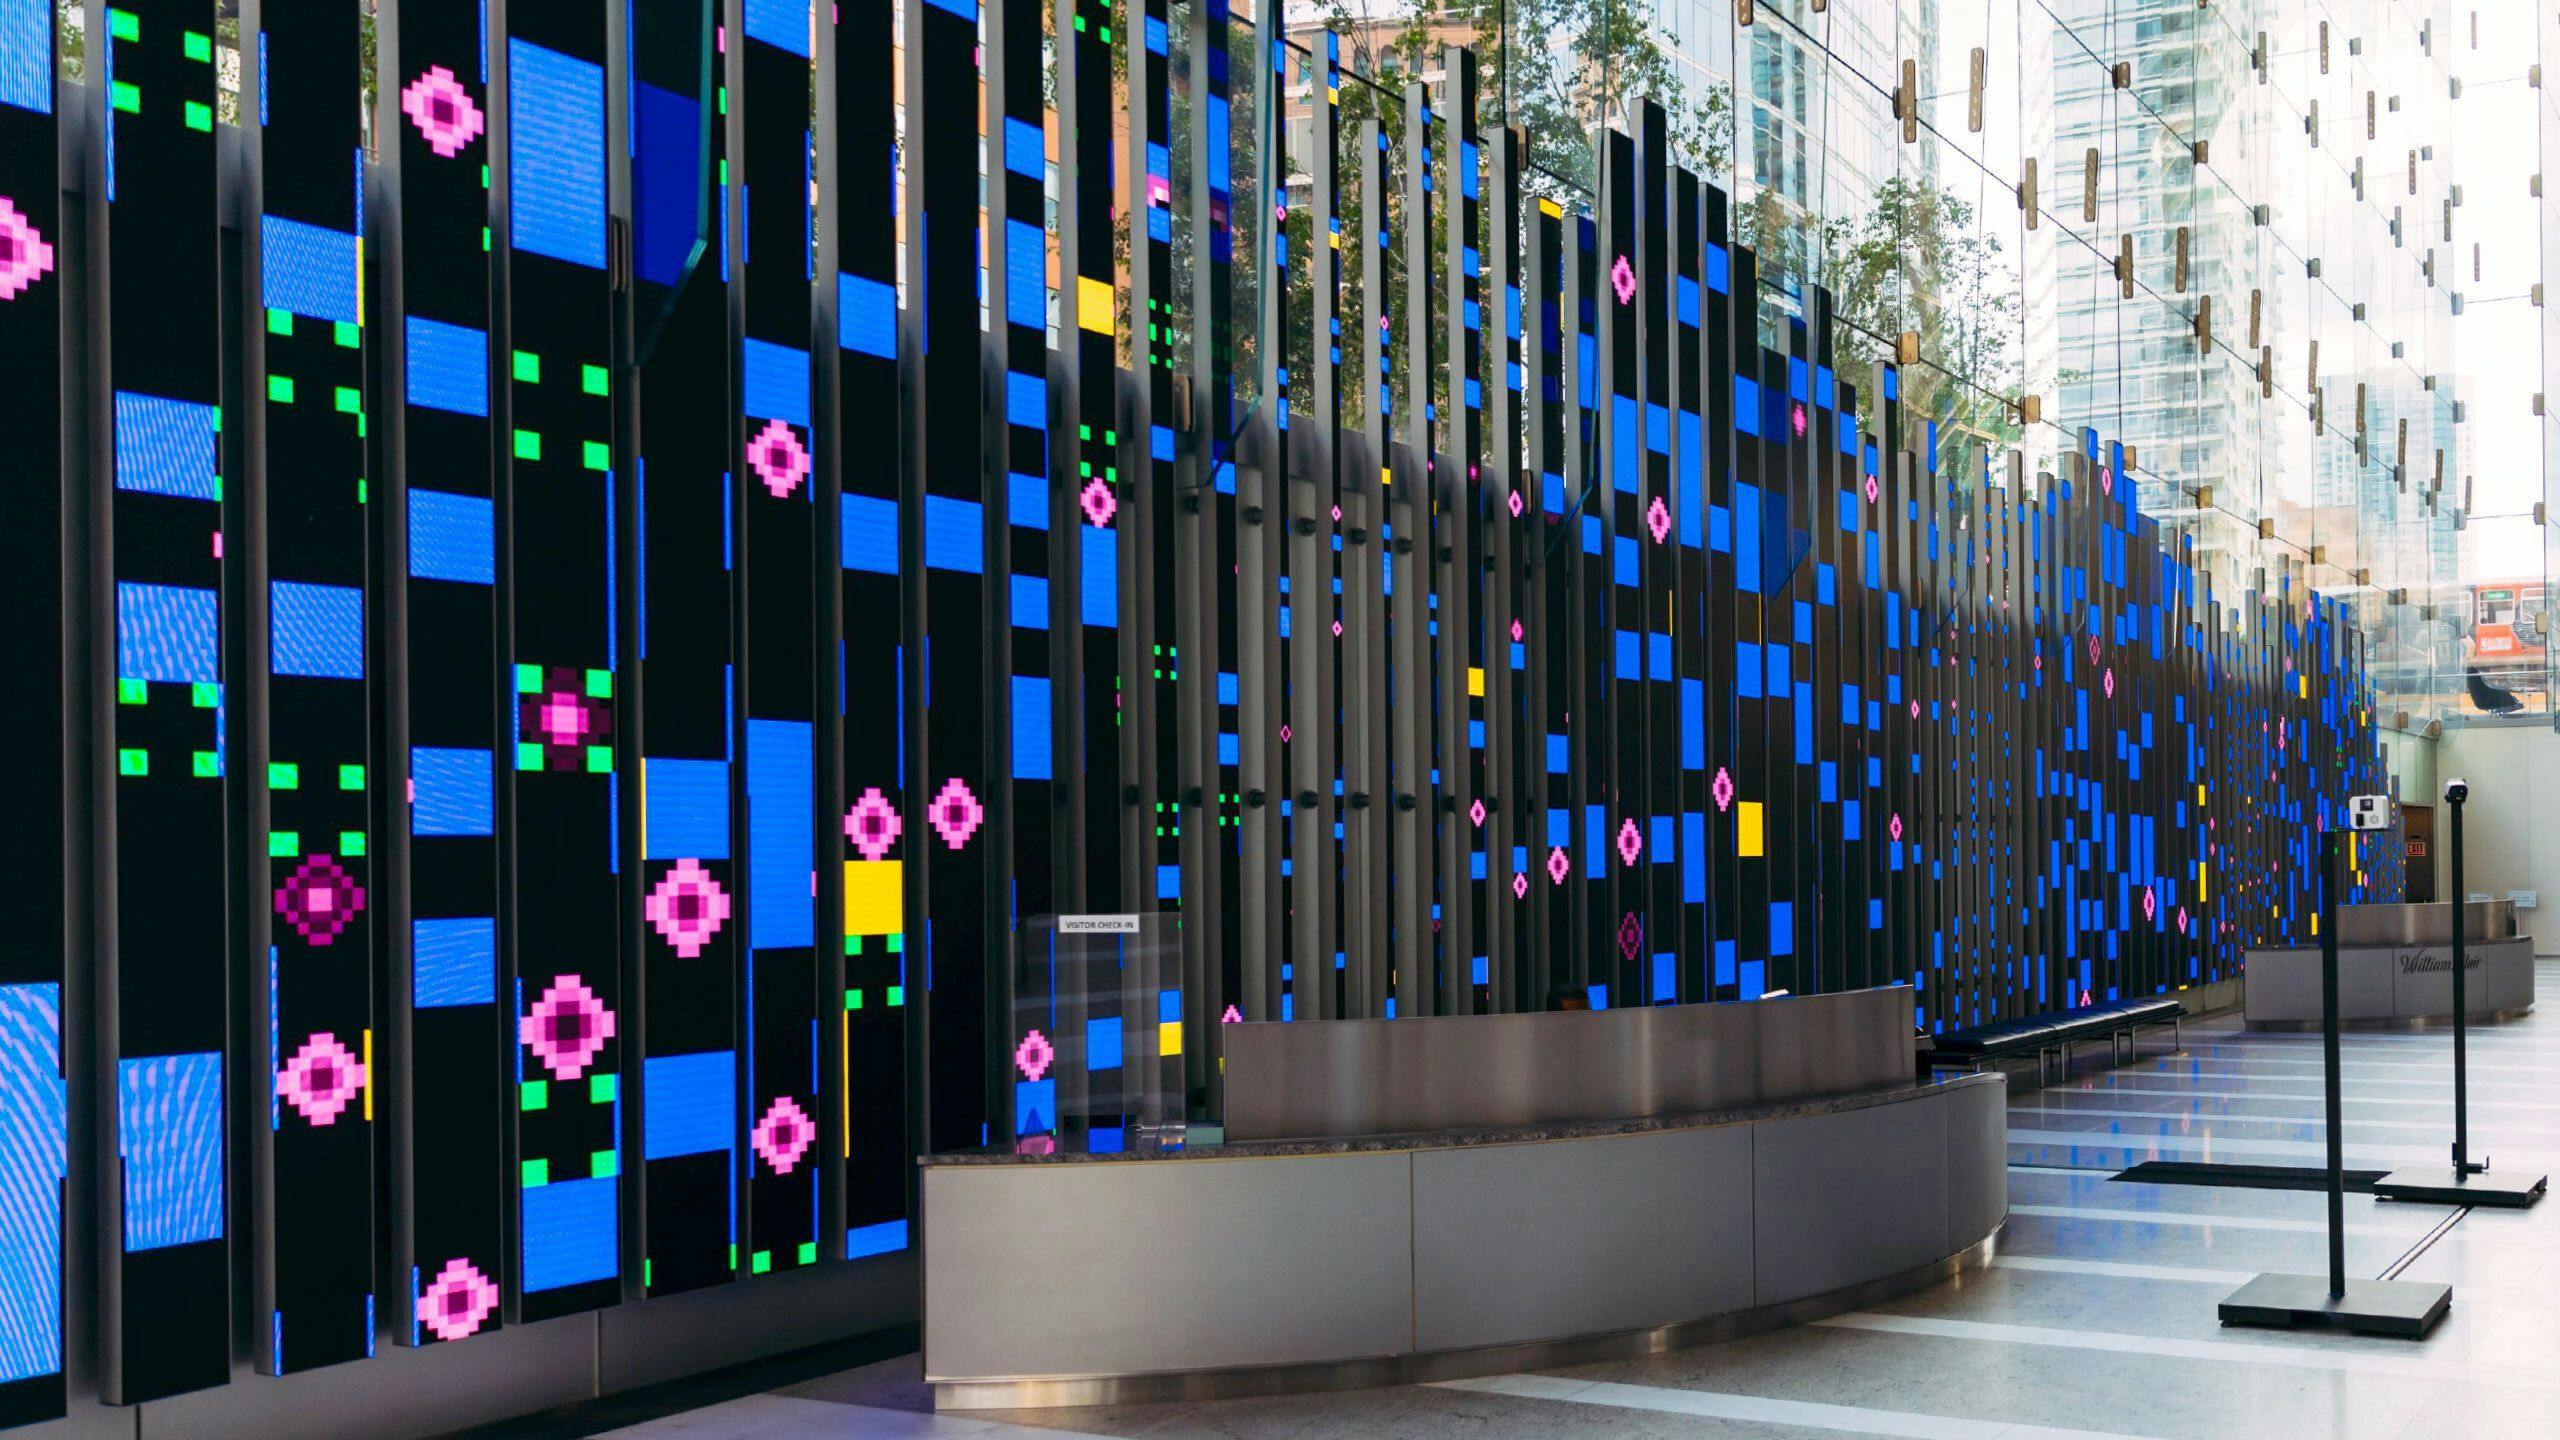
Symbolsandmeaning
Each location type and object gets its own visual representation.
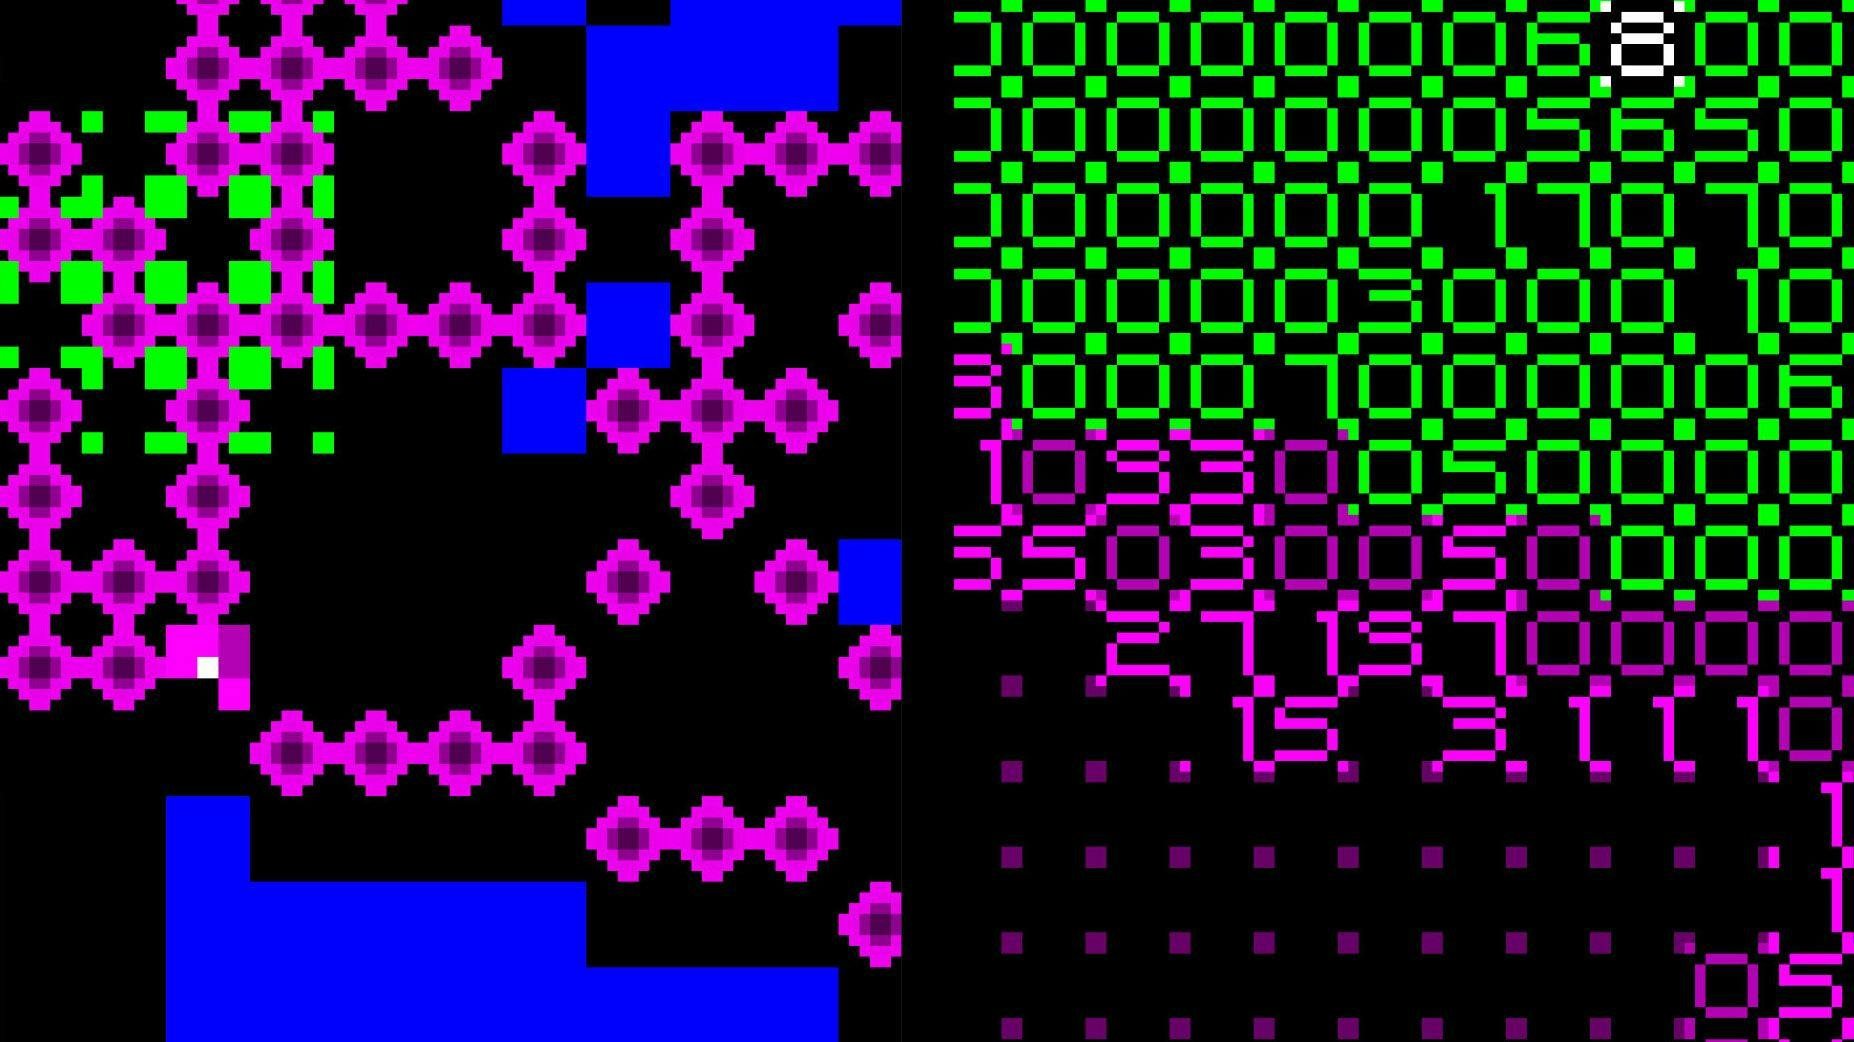
Colonyview
As the pheromones evaporate over time, shorter routes are more likely to retain more pheromones, thus the optimal (shortest) route will emerge over time and be reinforced by other ants.
Antpathview
If a park is found, the ant returns to the park where it started its path along the same route, depositing pheromones along the way. This way two parks are connected.
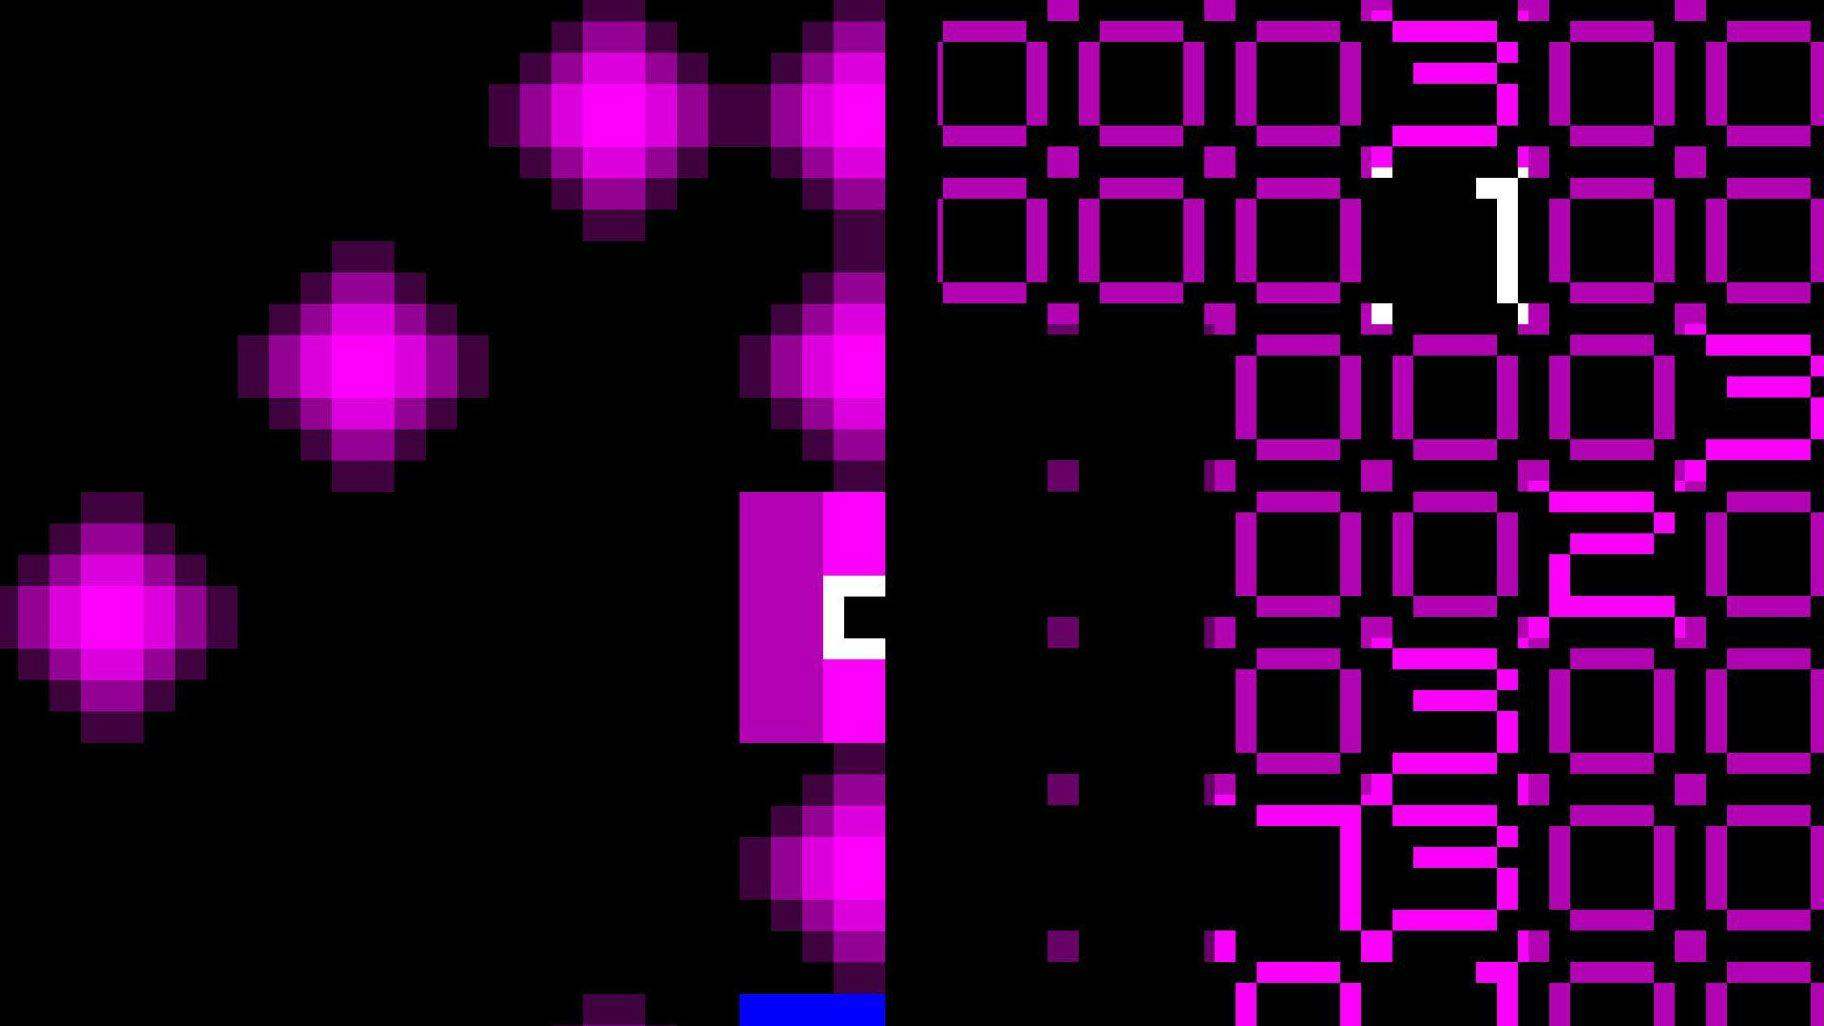
Antstepview
The ants in the algorithm all individually solve a local problem: where to go in the next step based on their immediate surroundings. They will go to a park if one is near, or otherwise favor directions with more pheromones.
Technology
CLEVER°FRANKE's visualization software ensured Ant Algorithm’s problem fits the layout and size of the 150 Media Stream perfectly and allowed for the different levels of problem-solving to be shown. To handle the incredibly high resolution of the video wall, they wrote custom software to run massive video files in parallel.
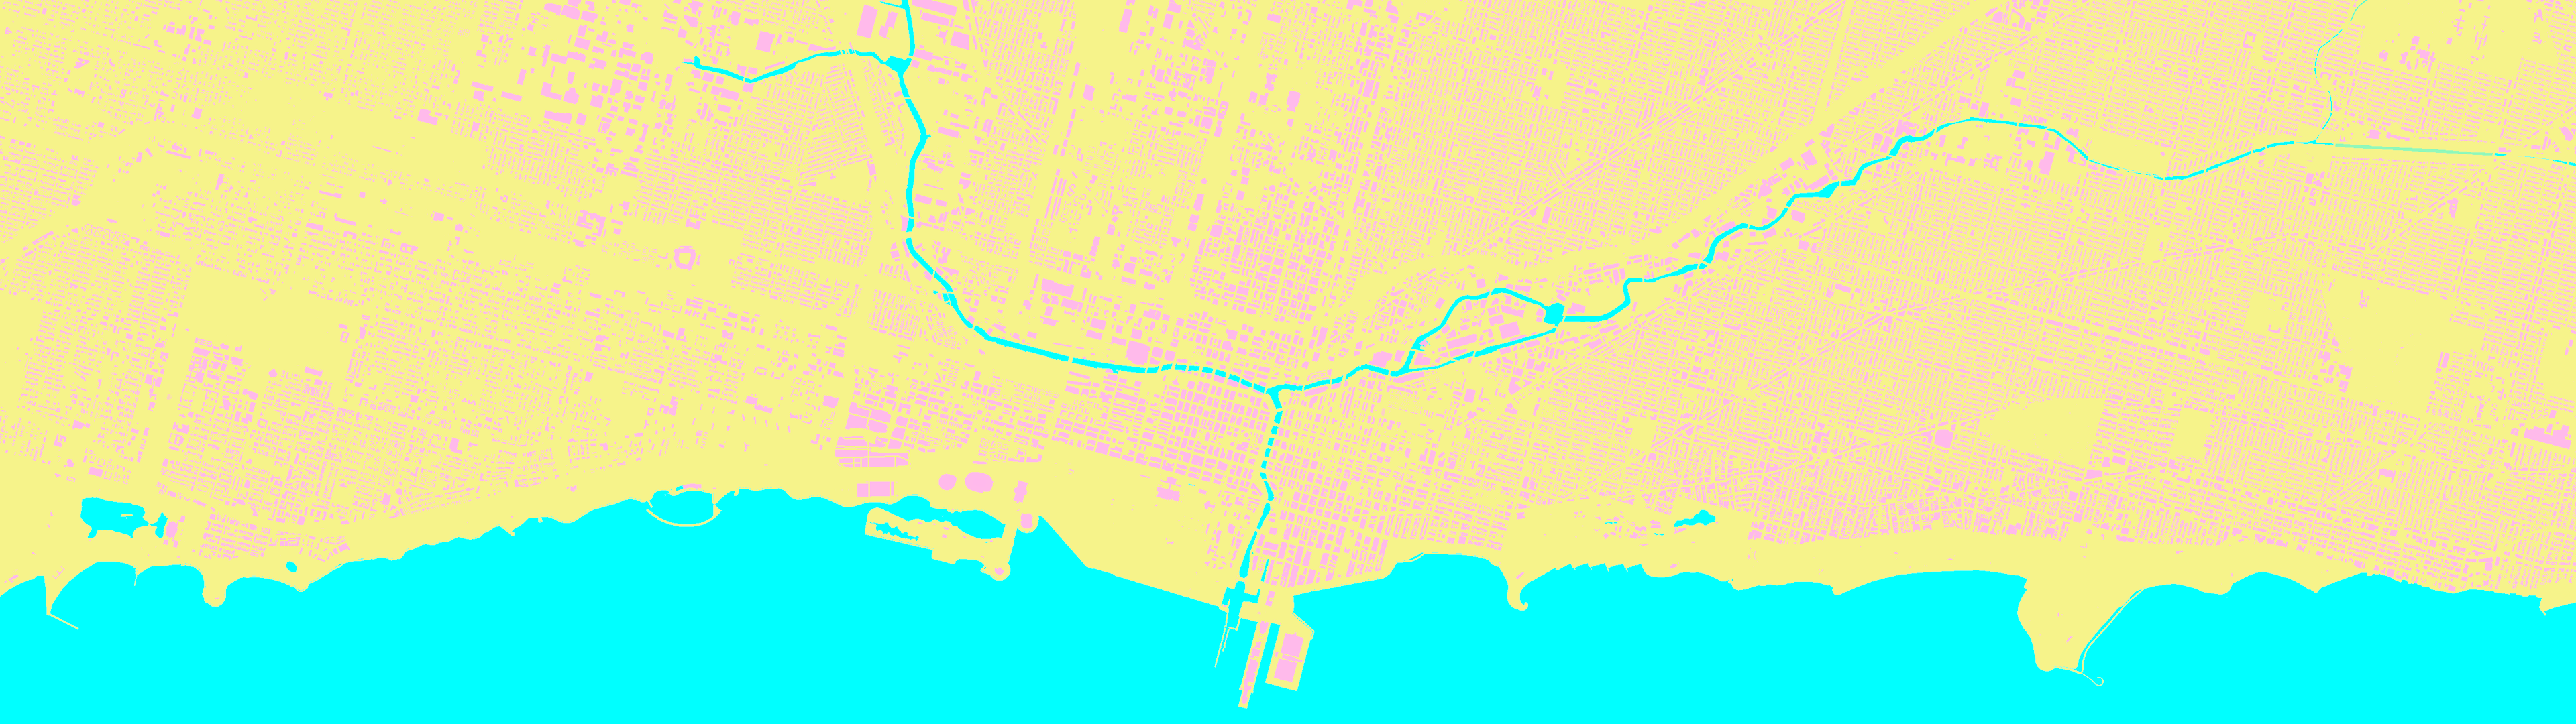
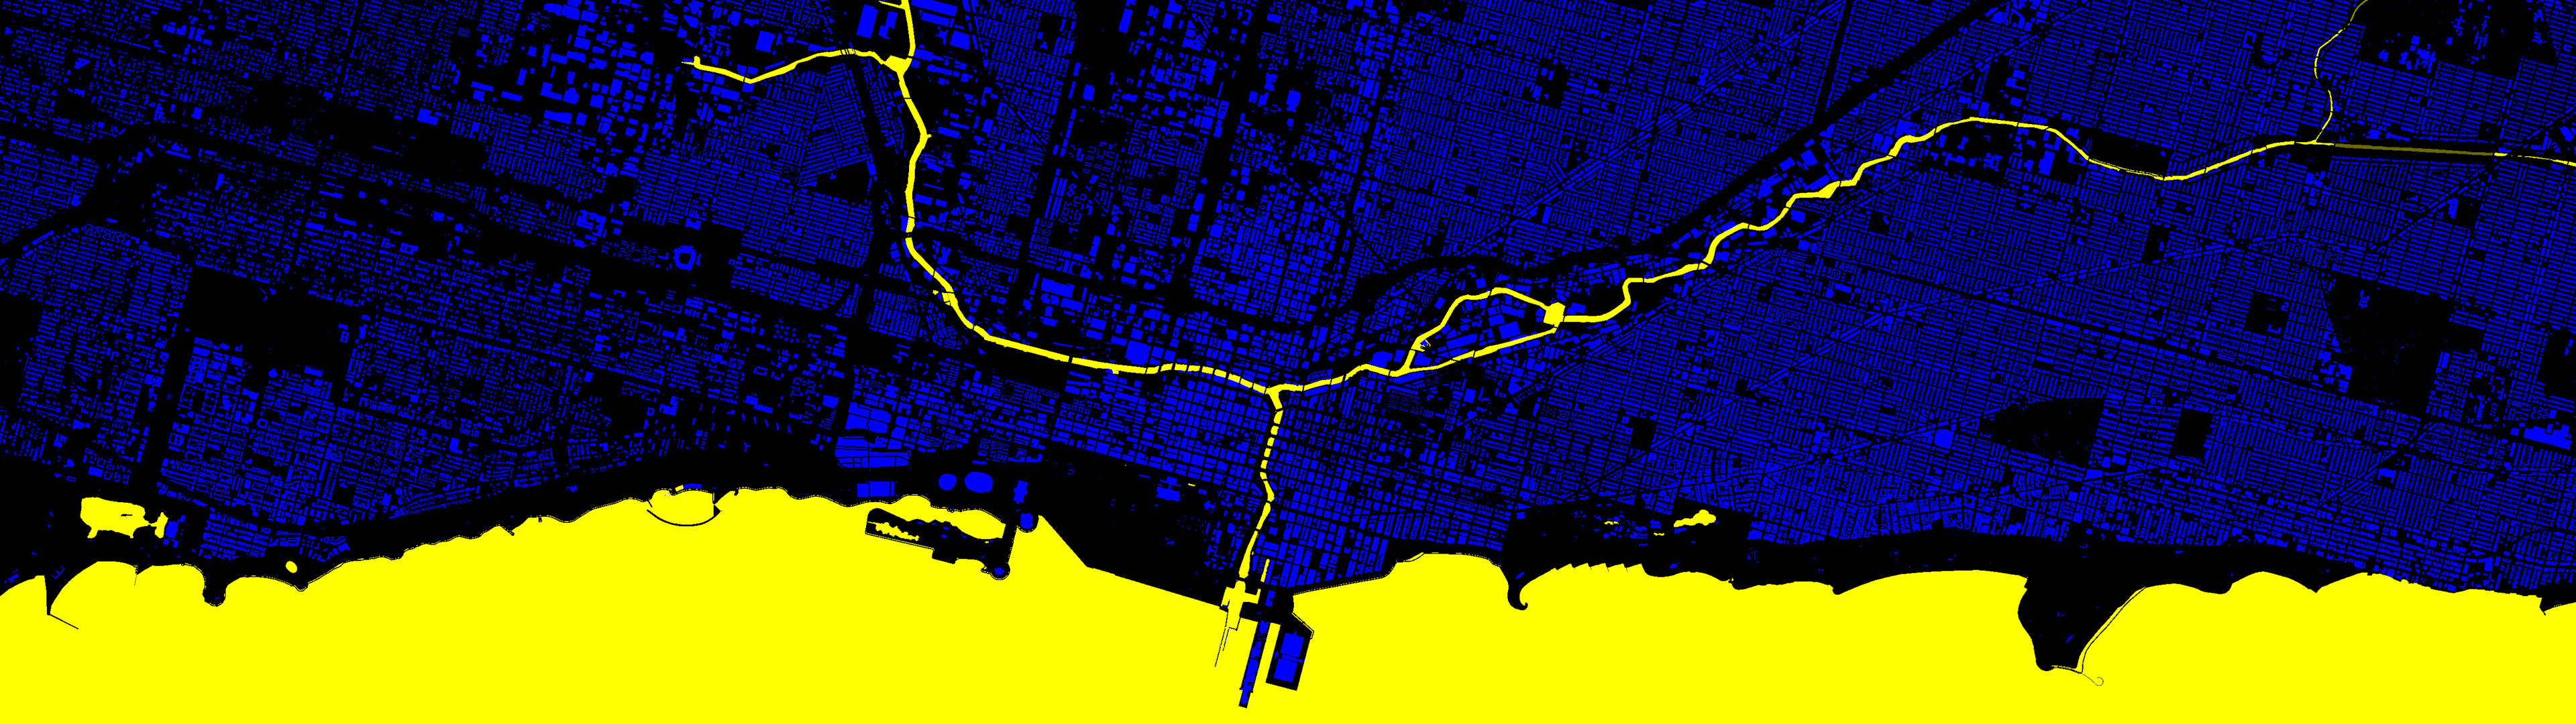
To have ants walk the streets of the city, we created a high-resolution digital map. Using data from OpenStreetMaps, we color-coded places in each individual park or leisure area.
Results
The visualisation was exhibited in the lobby of the 150 North Riverside, located in the city of Chicago.