Leveraging data to bring a new live experience to sports events and athletes
Statistics
- Client
- KNWU (Royal Dutch Cycling Union)
- Partners
- Area 51 Eindhoven
- Urban Sports Performance Center
- Awards
- Dutch Design Award
- FWA of the day
- Red Dot Design Award
- Information is Beautiful Award – Gold
- Deliverables
- Event installation
The challenge
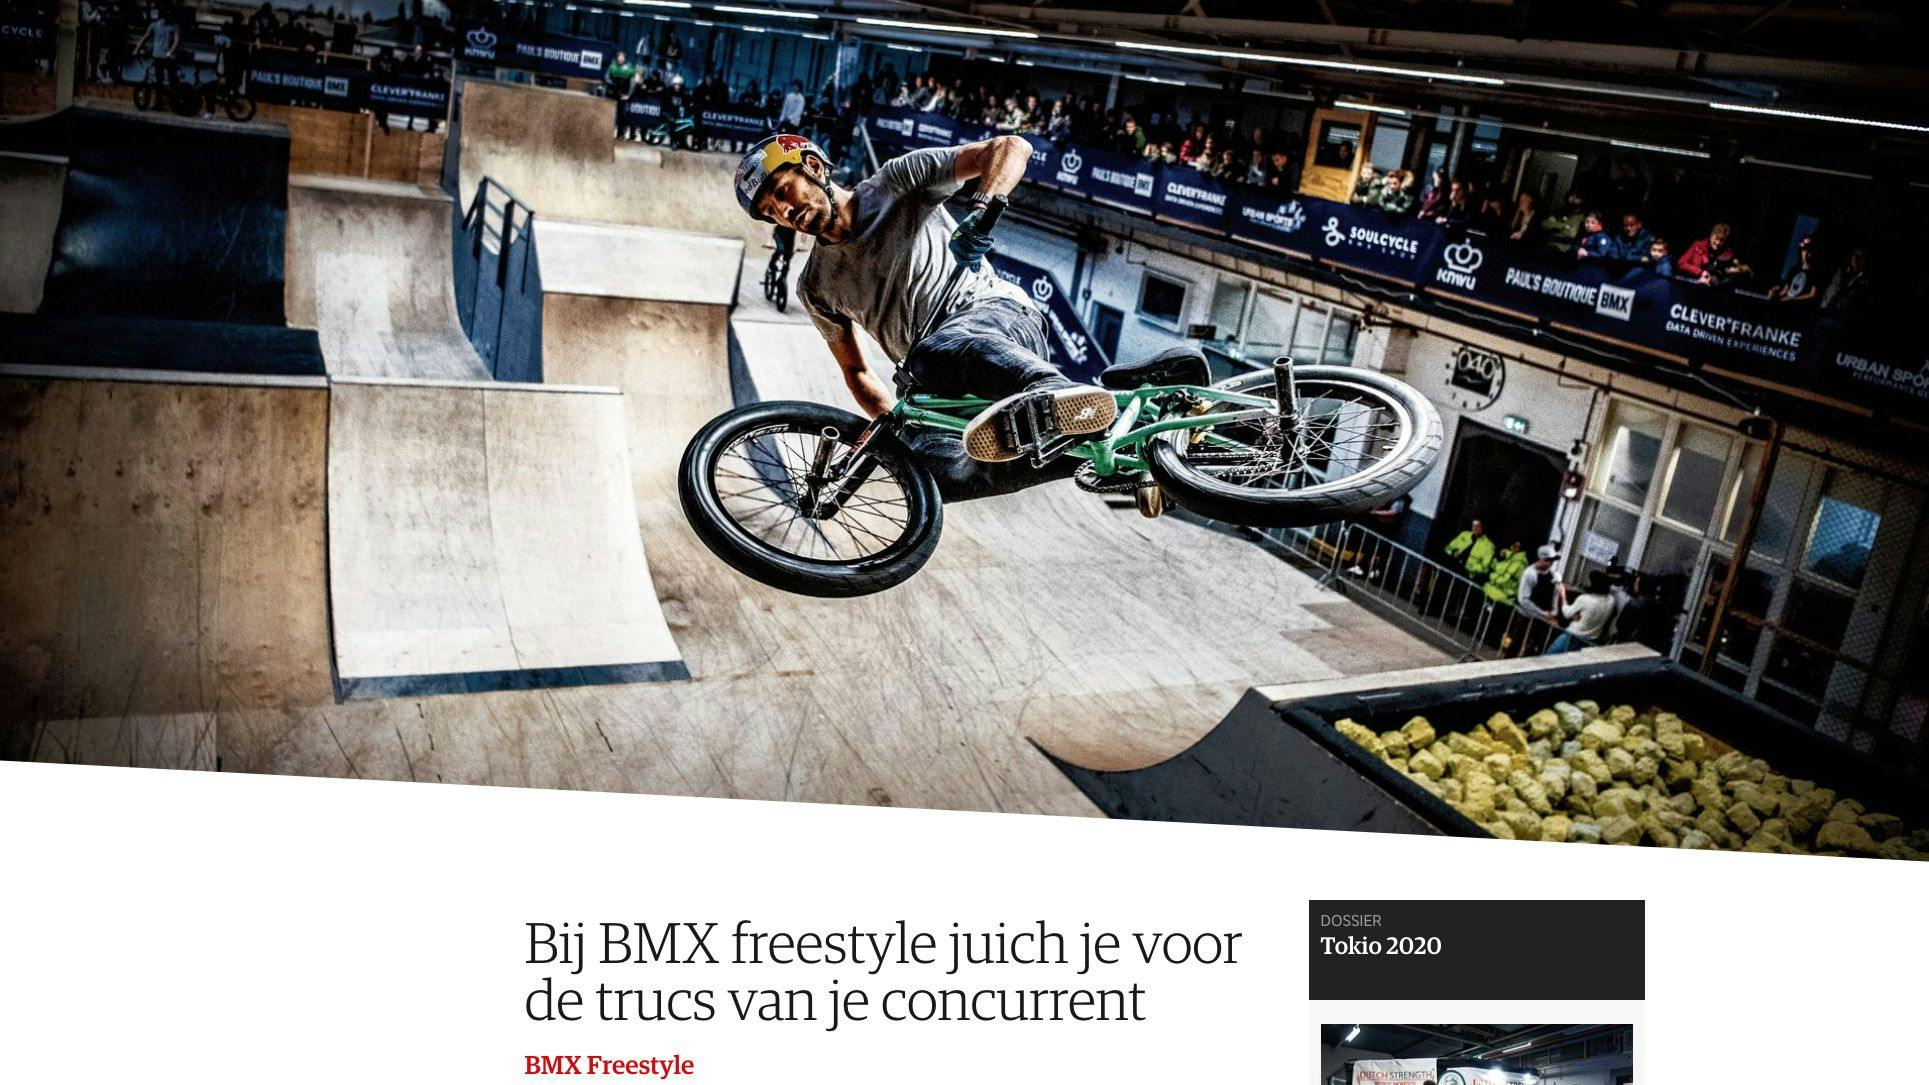
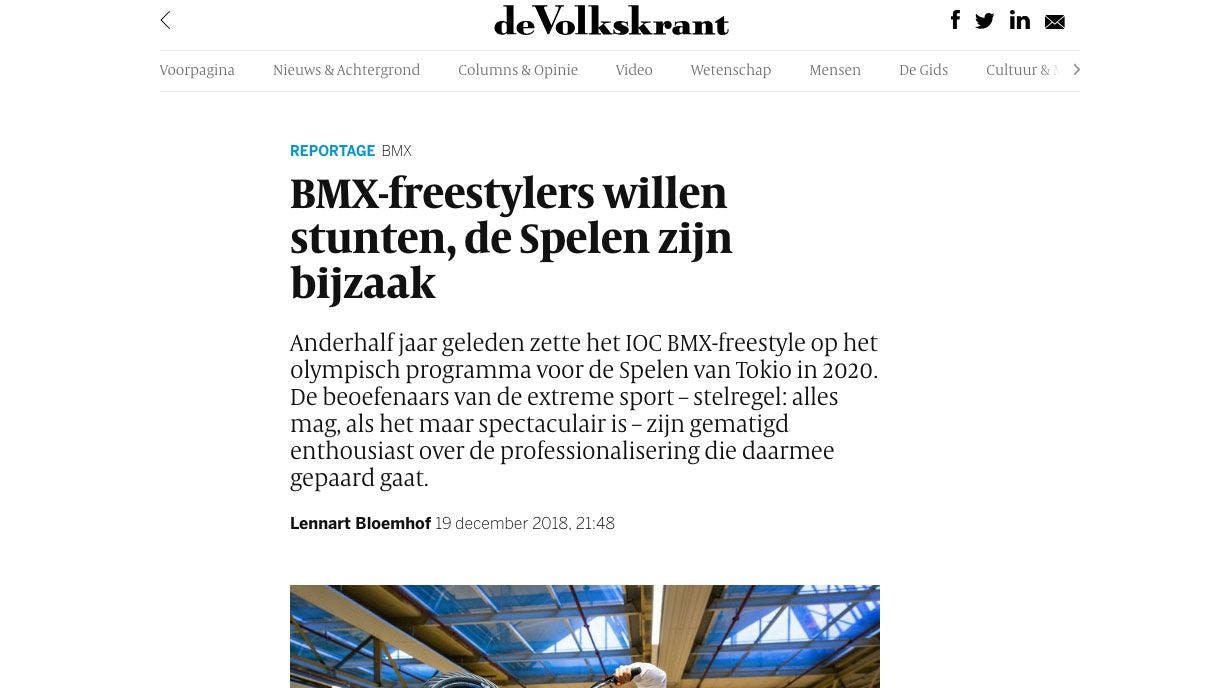
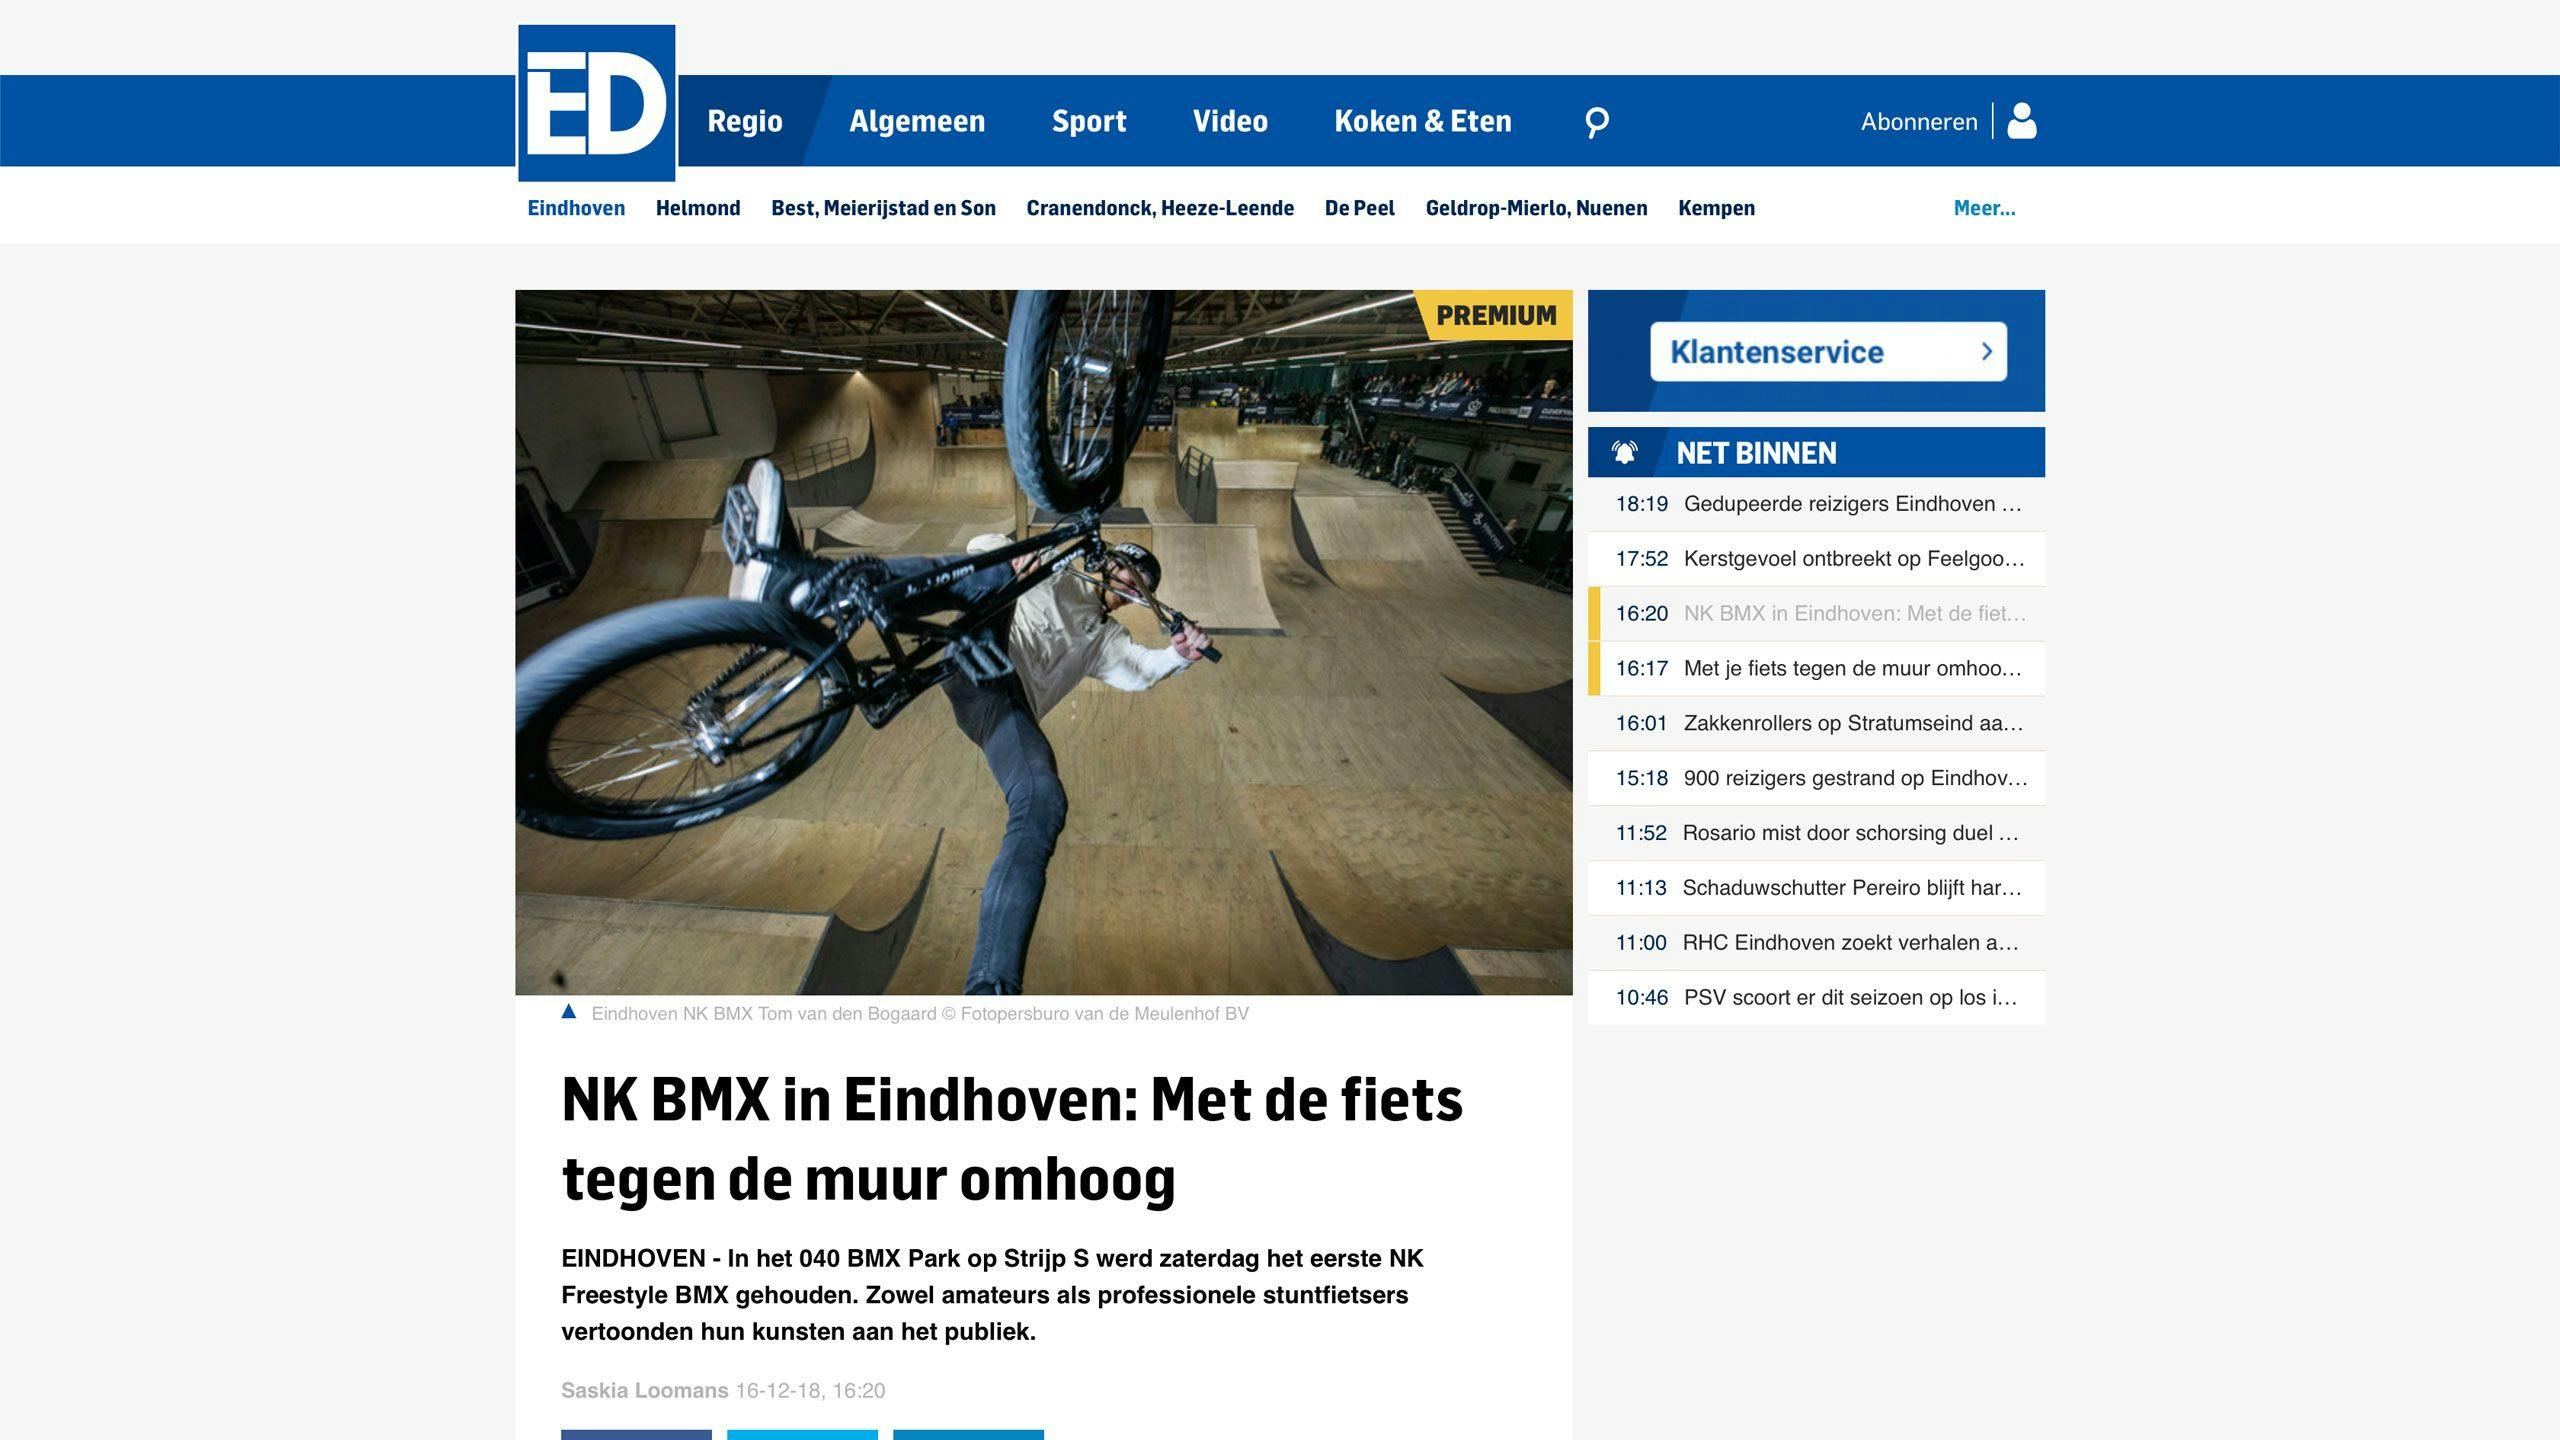
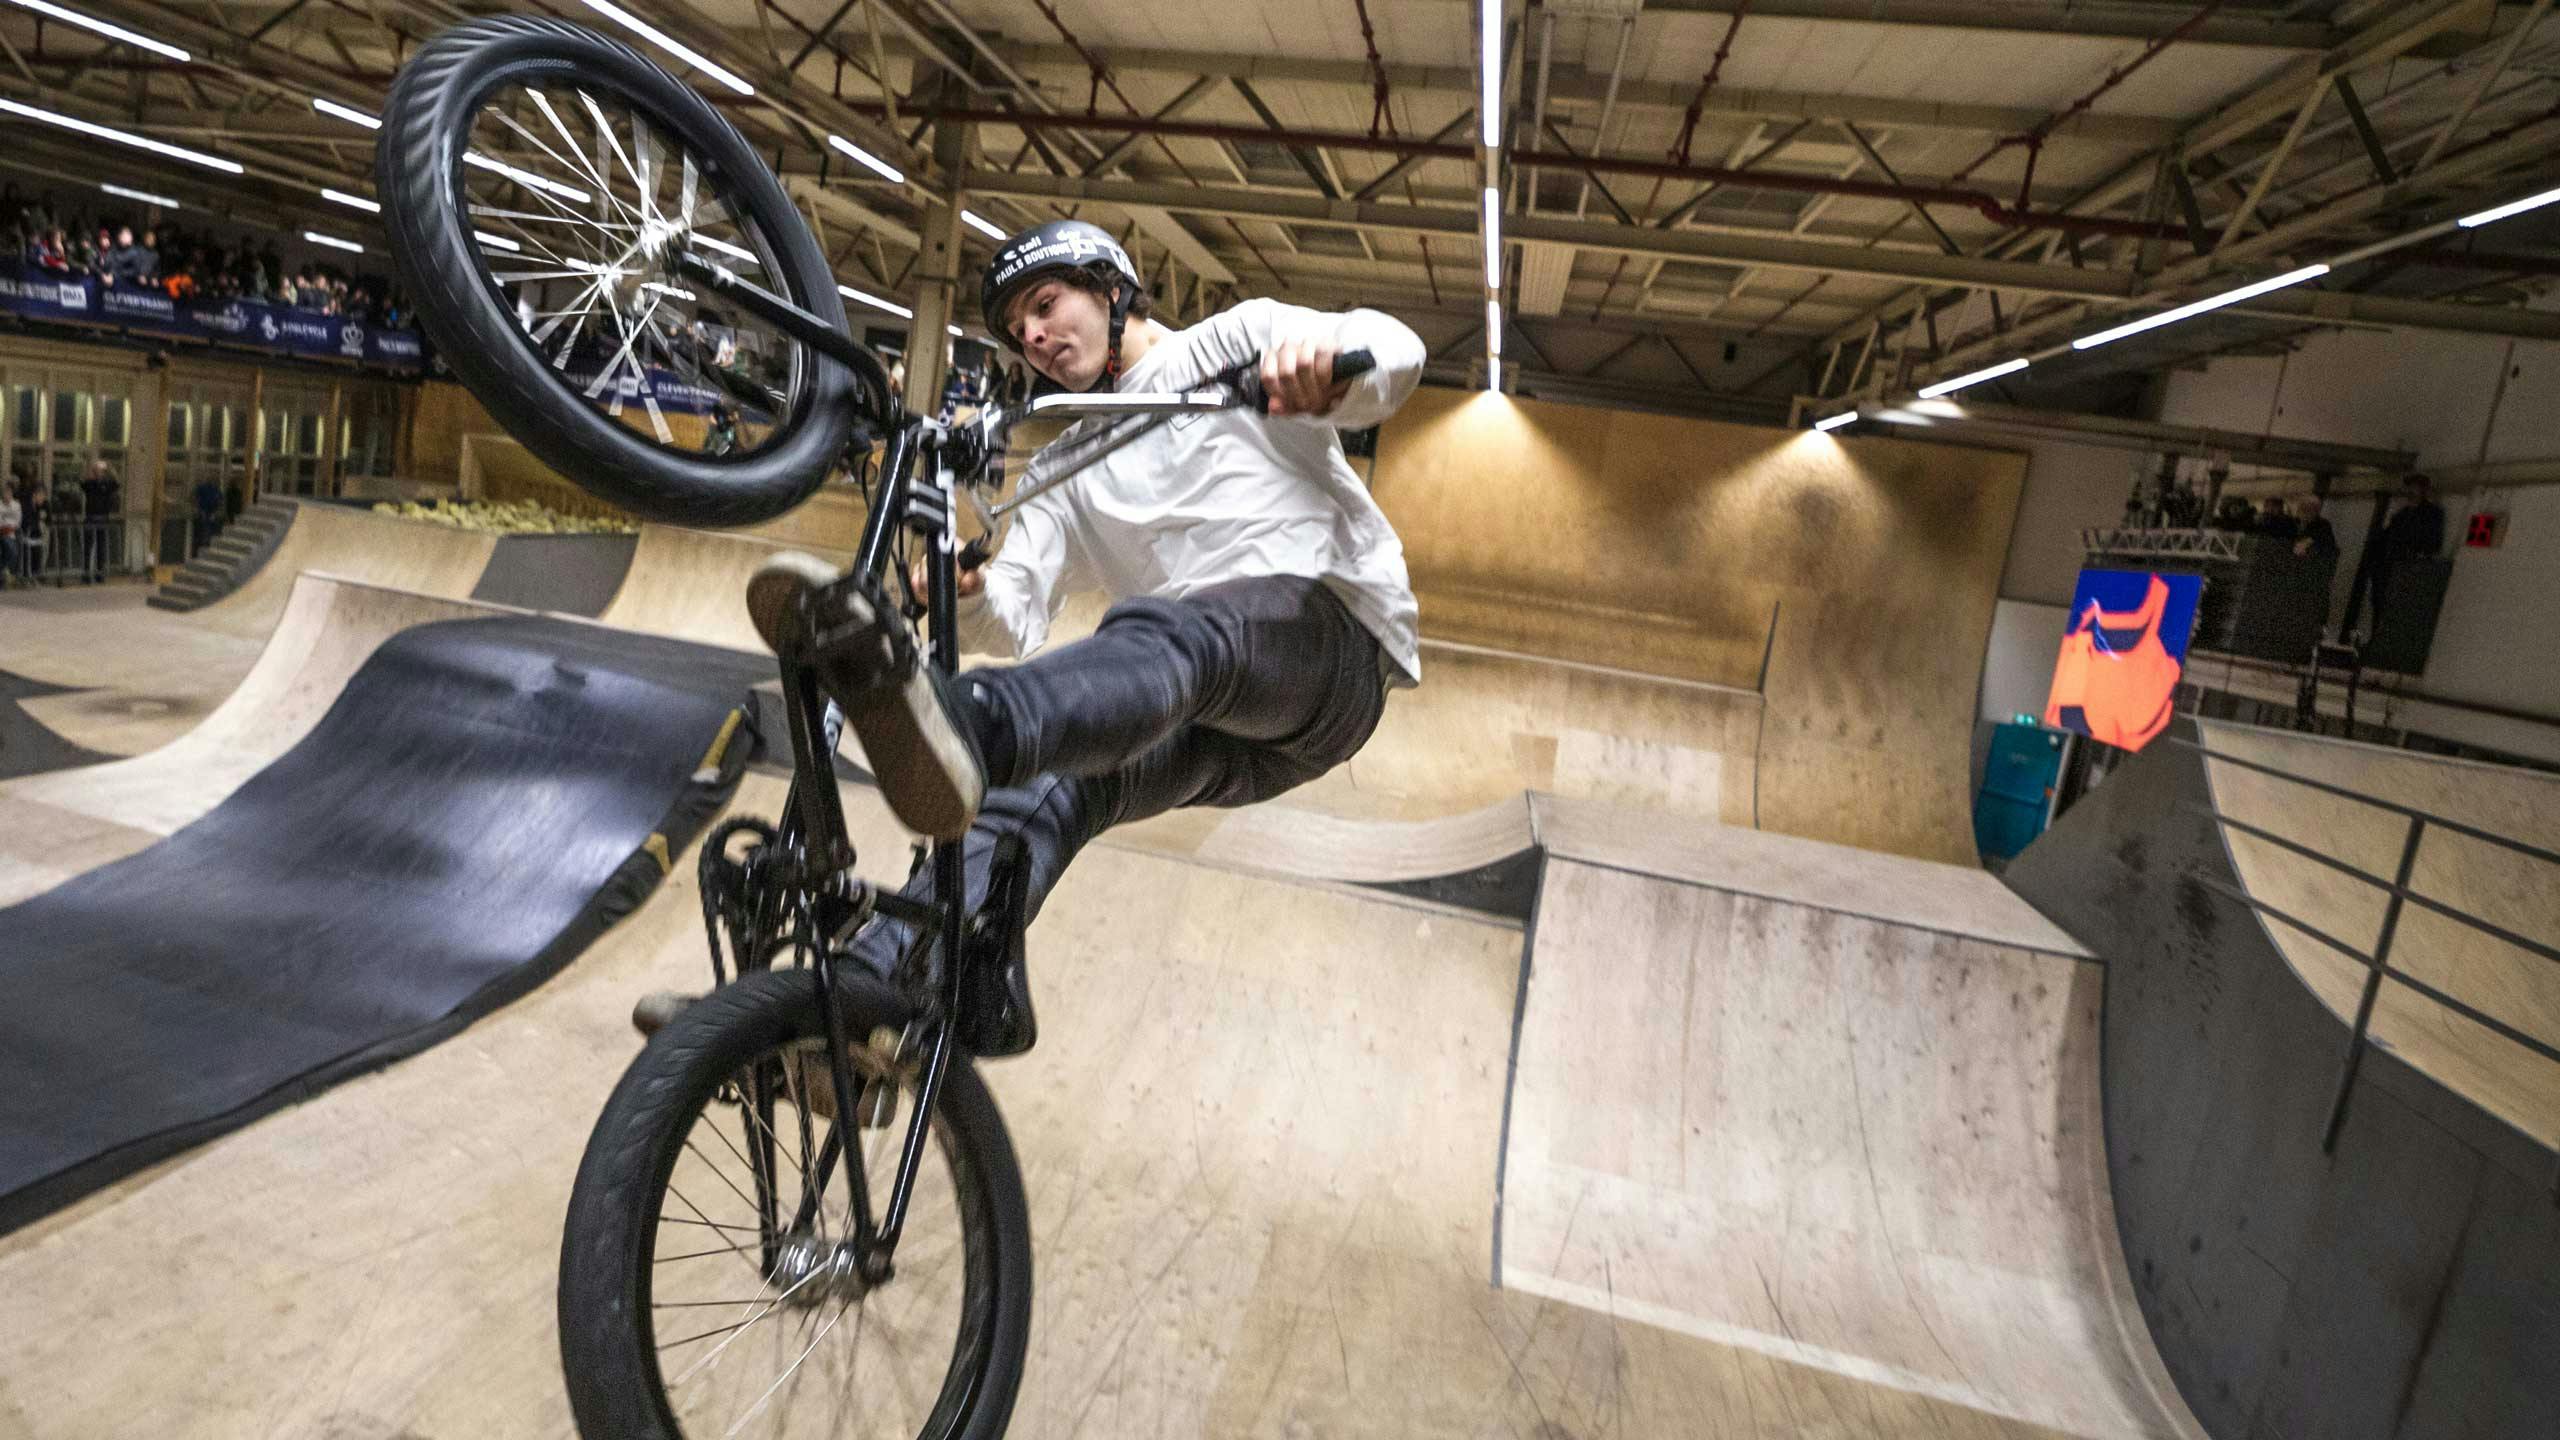
The Royal Dutch Cycling Federation (KNWU) wants to attract more people to the exciting, fascinating sport of Freestyle BMX.
They approached CLEVER°FRANKE with the idea to create a live visualization of their annual BMX free styling competition. Diving into the project, we determined there was an opportunity to provide more than just a visualization, but also a means for the athletes to gain better insights into their performance.
Value delivered
A new engaging experience for spectators, a tool for judges and riders to better judge the rider’s performance.
Background
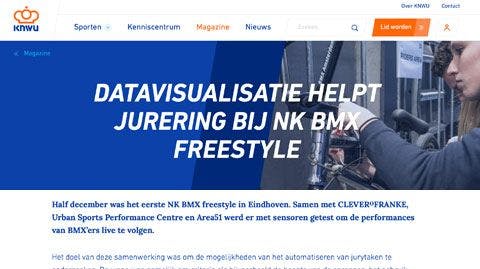
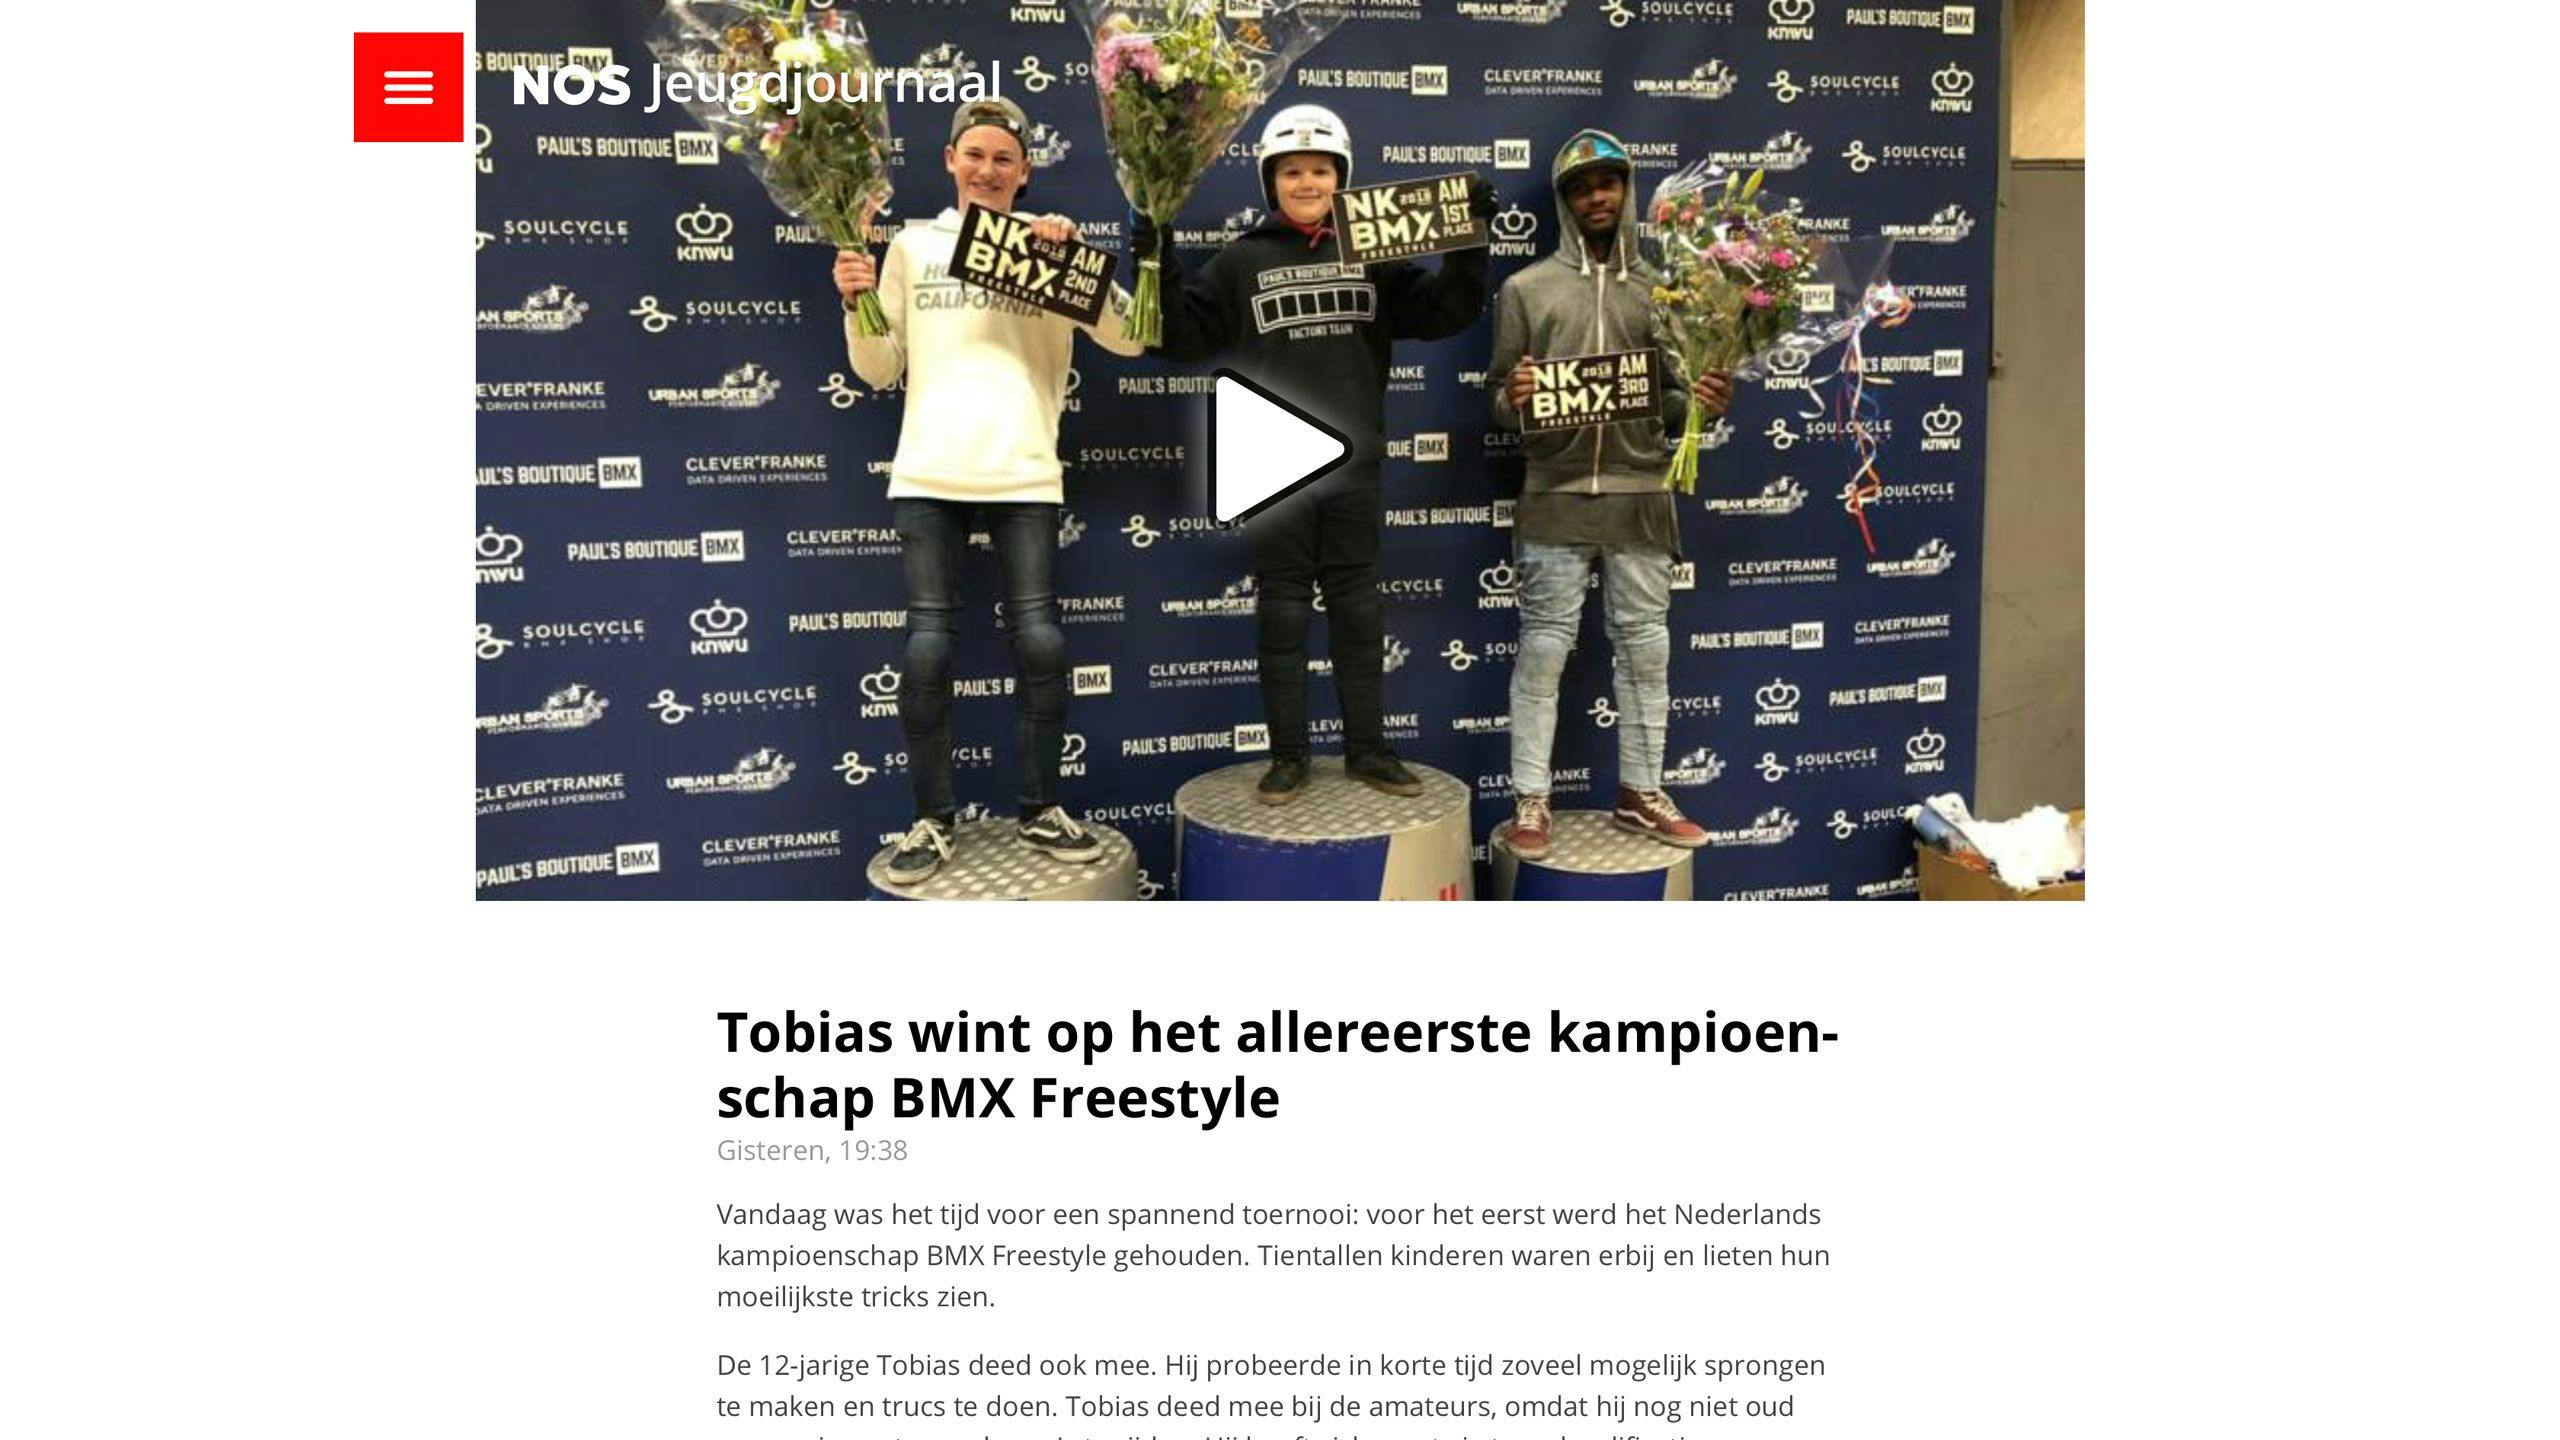
Since its promotion to being an Olympic sport, KNWU aims to increase participation at Freestyle BMX. While judges give the final scores for each ride, using sensor data creates the opportunity to quantify performance in various ways. Visualizing live BMX rider data presented a technical challenge to our team but also an opportunity to explore and reveal insights into rider performance.
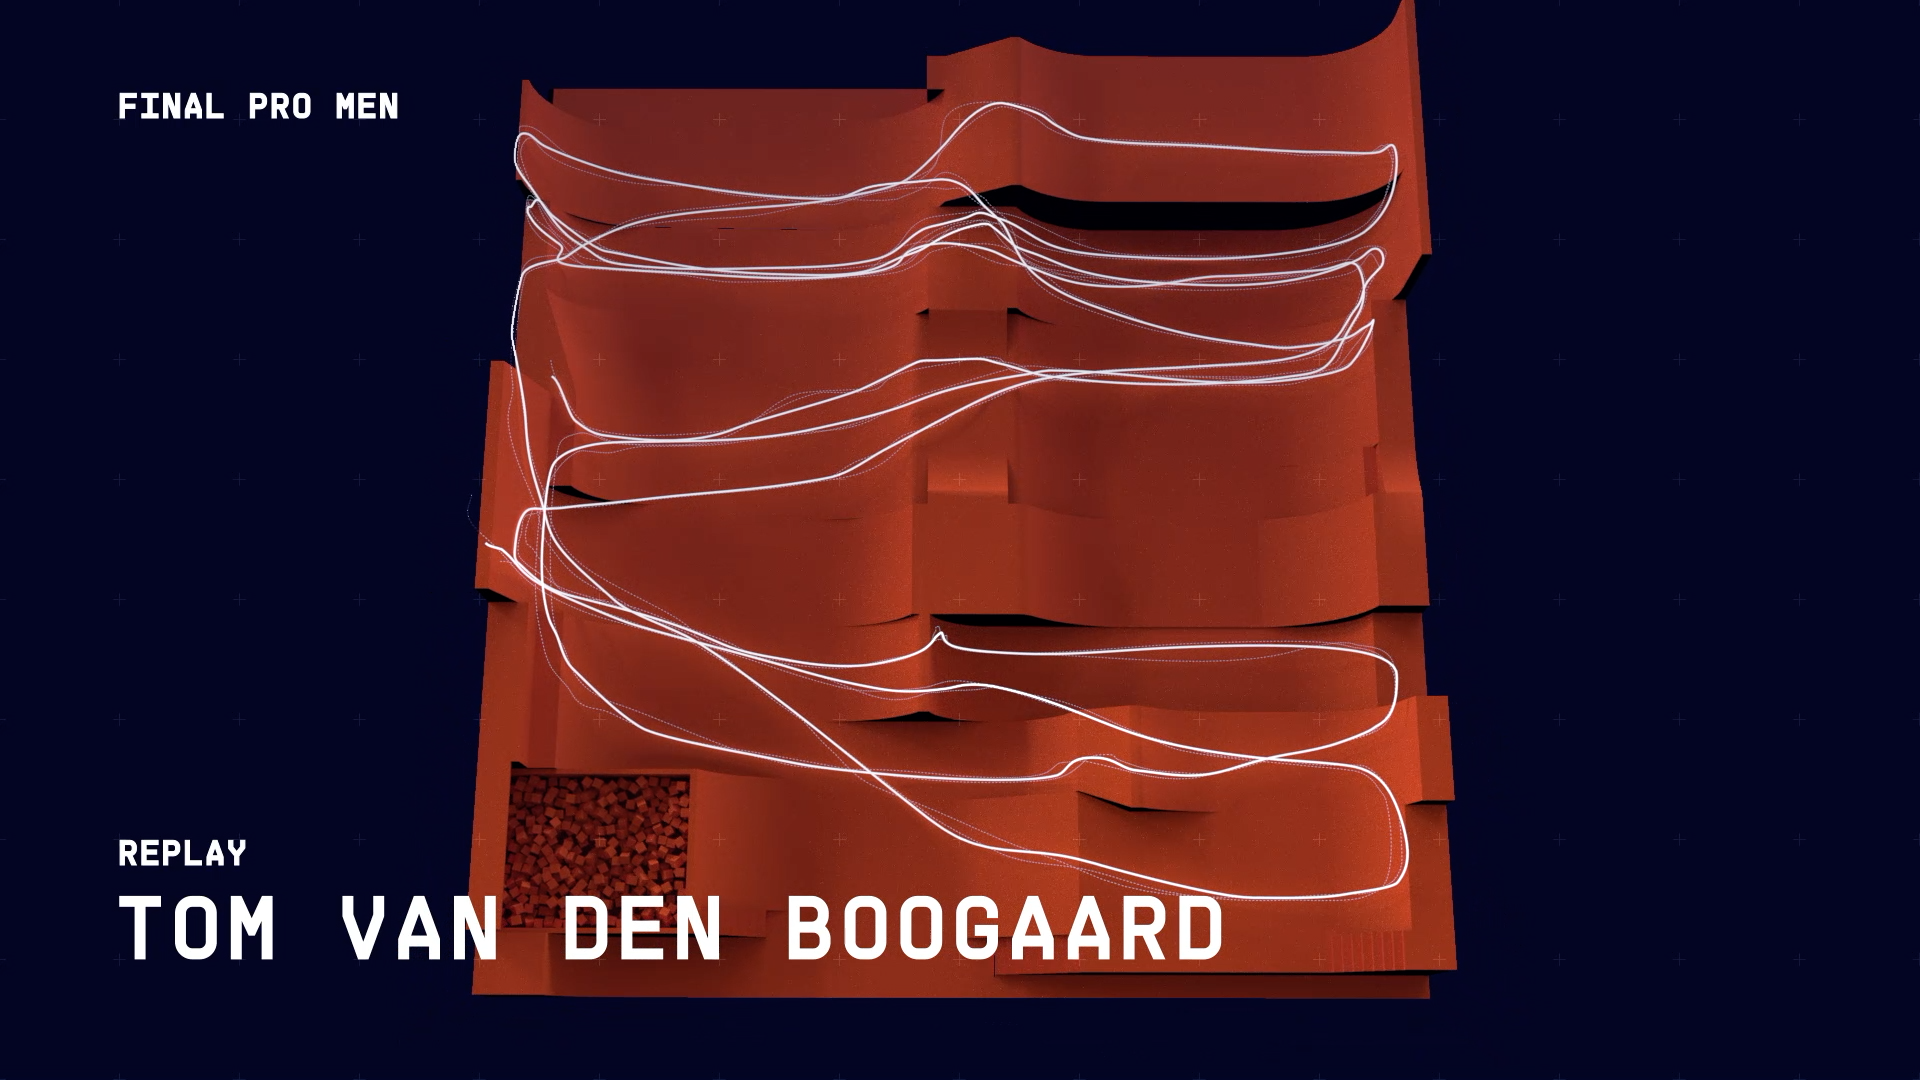
We identified the data needs for different audiences, and what insights would be interesting. Targeting live spectators, we created an engaging visualization that shows the rider's path throughout the skatepark complemented with various live datapoints, enhancing the overall event experience for the Dutch national championships. For jury members and riders, we created a dashboard showing aggregate statistics and replays of important moments and tricks. The same data can be used to amplify training sessions for the athletes.
Phases and toolkit items used
Technology
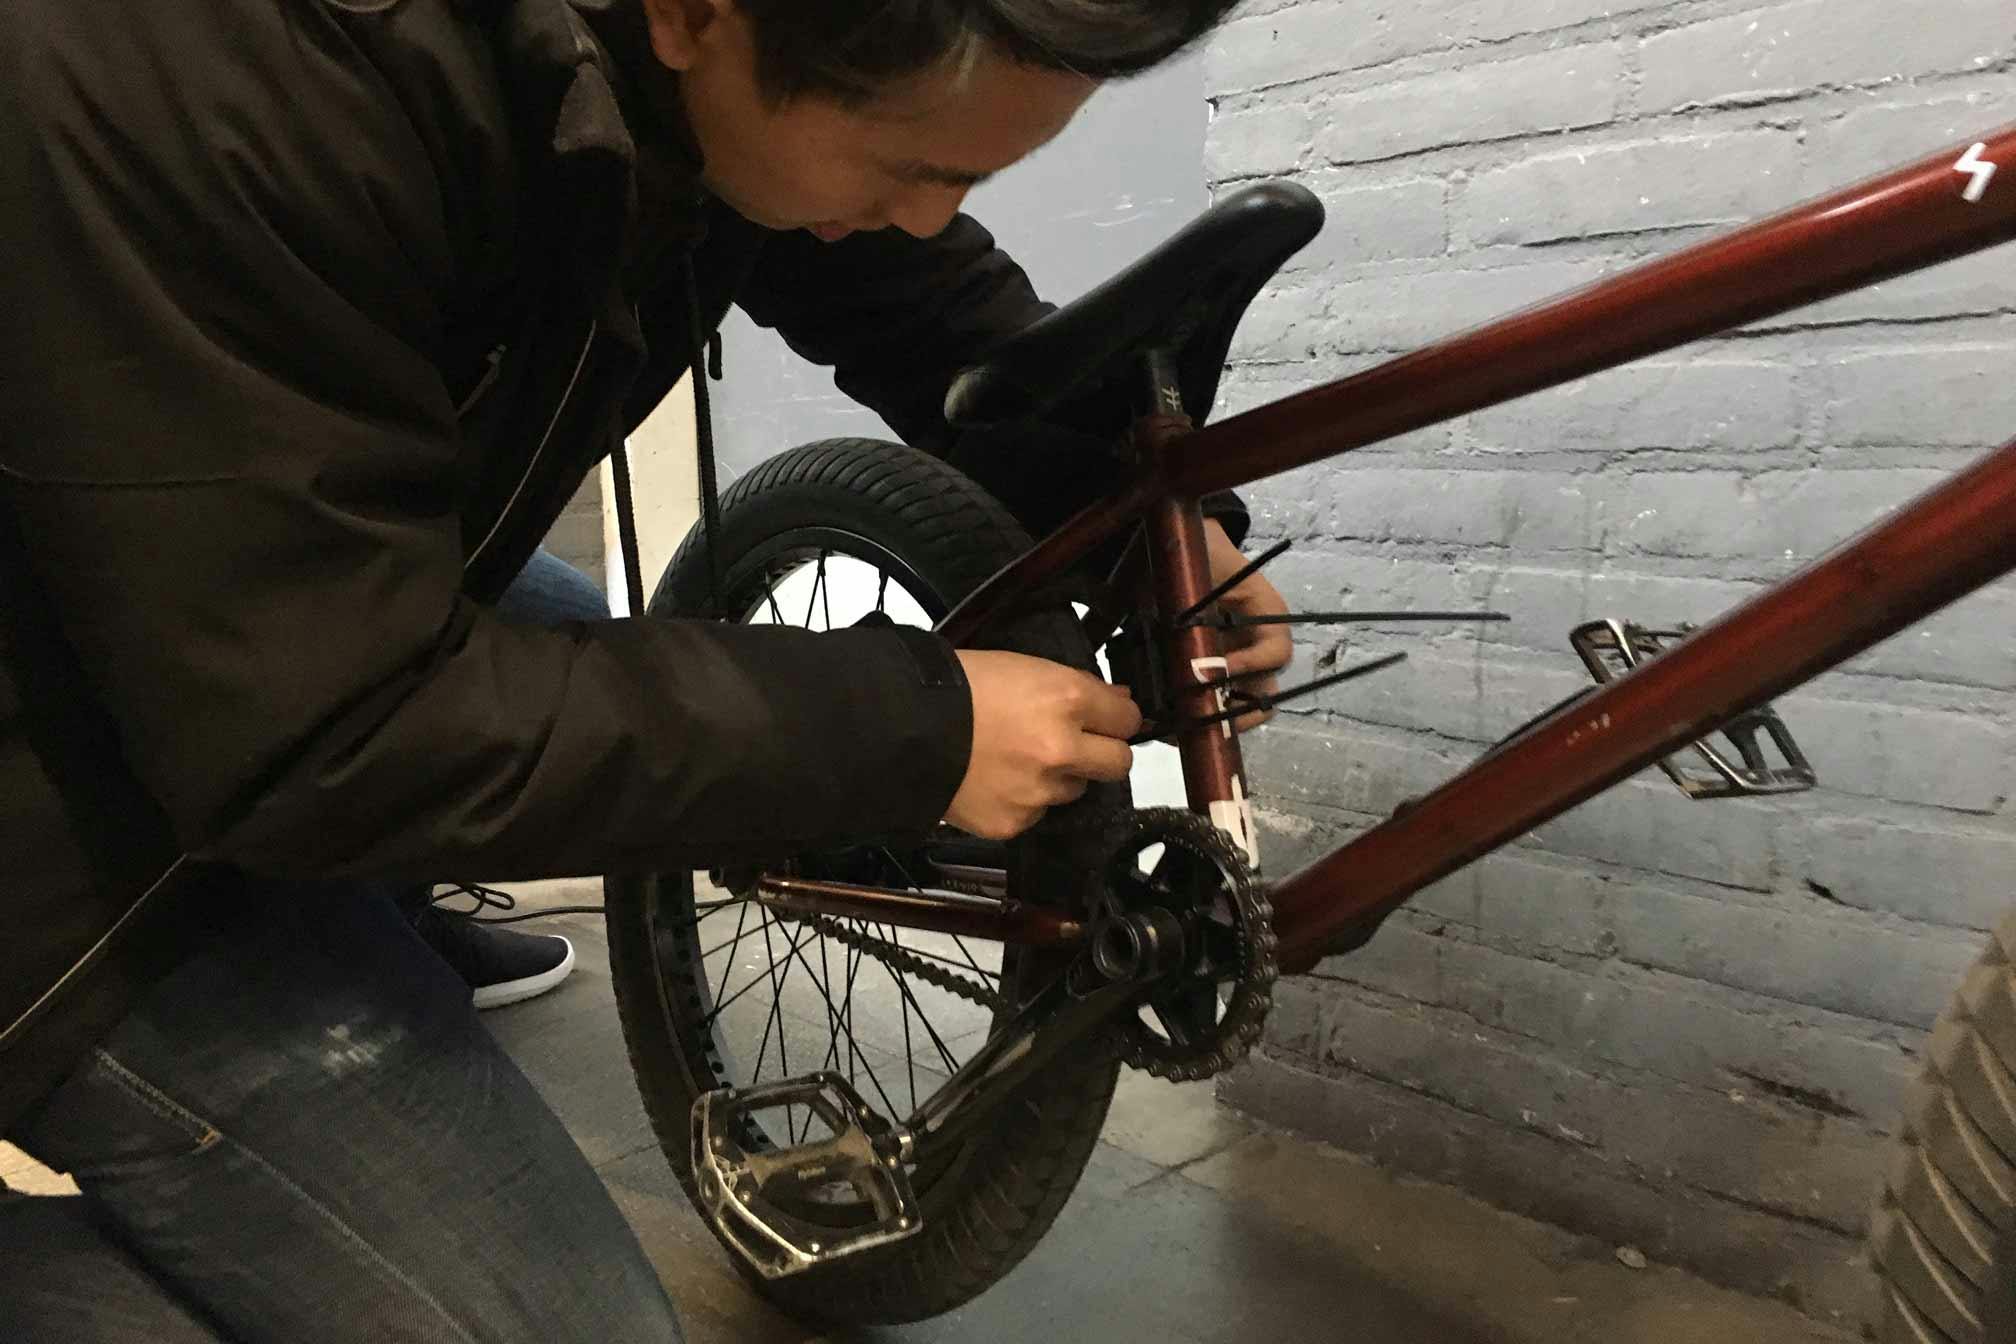
Sensors
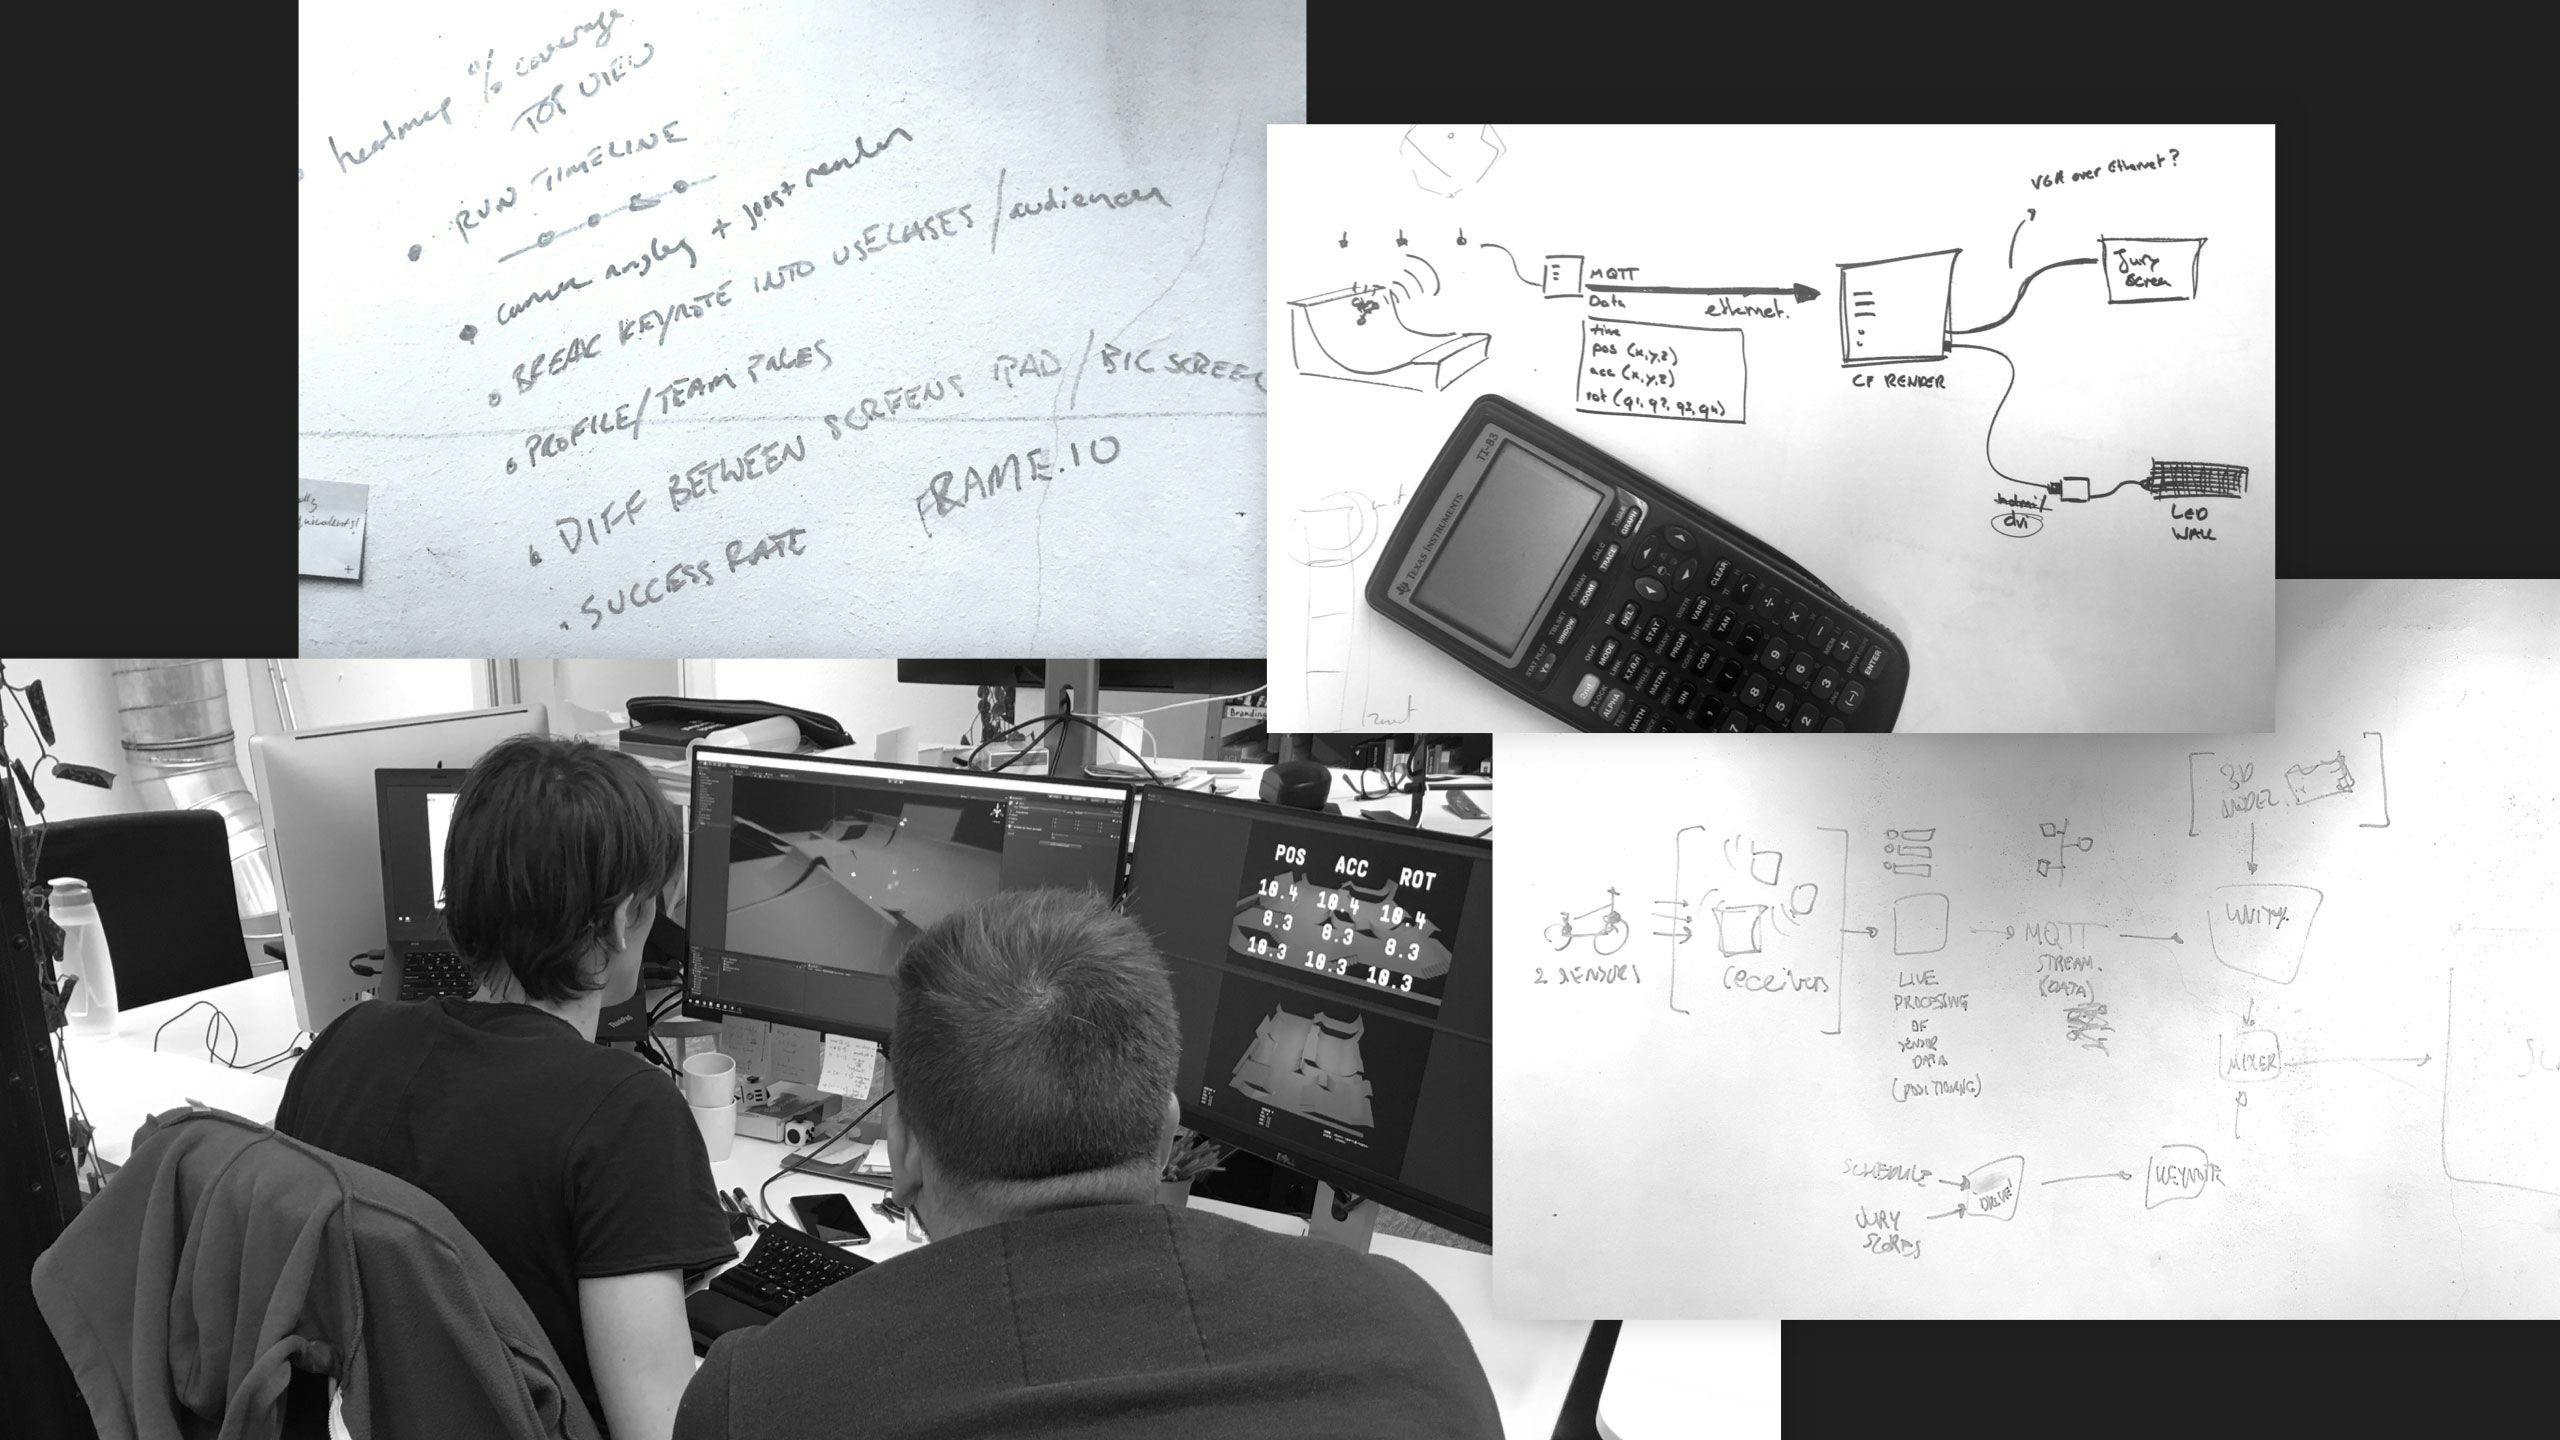
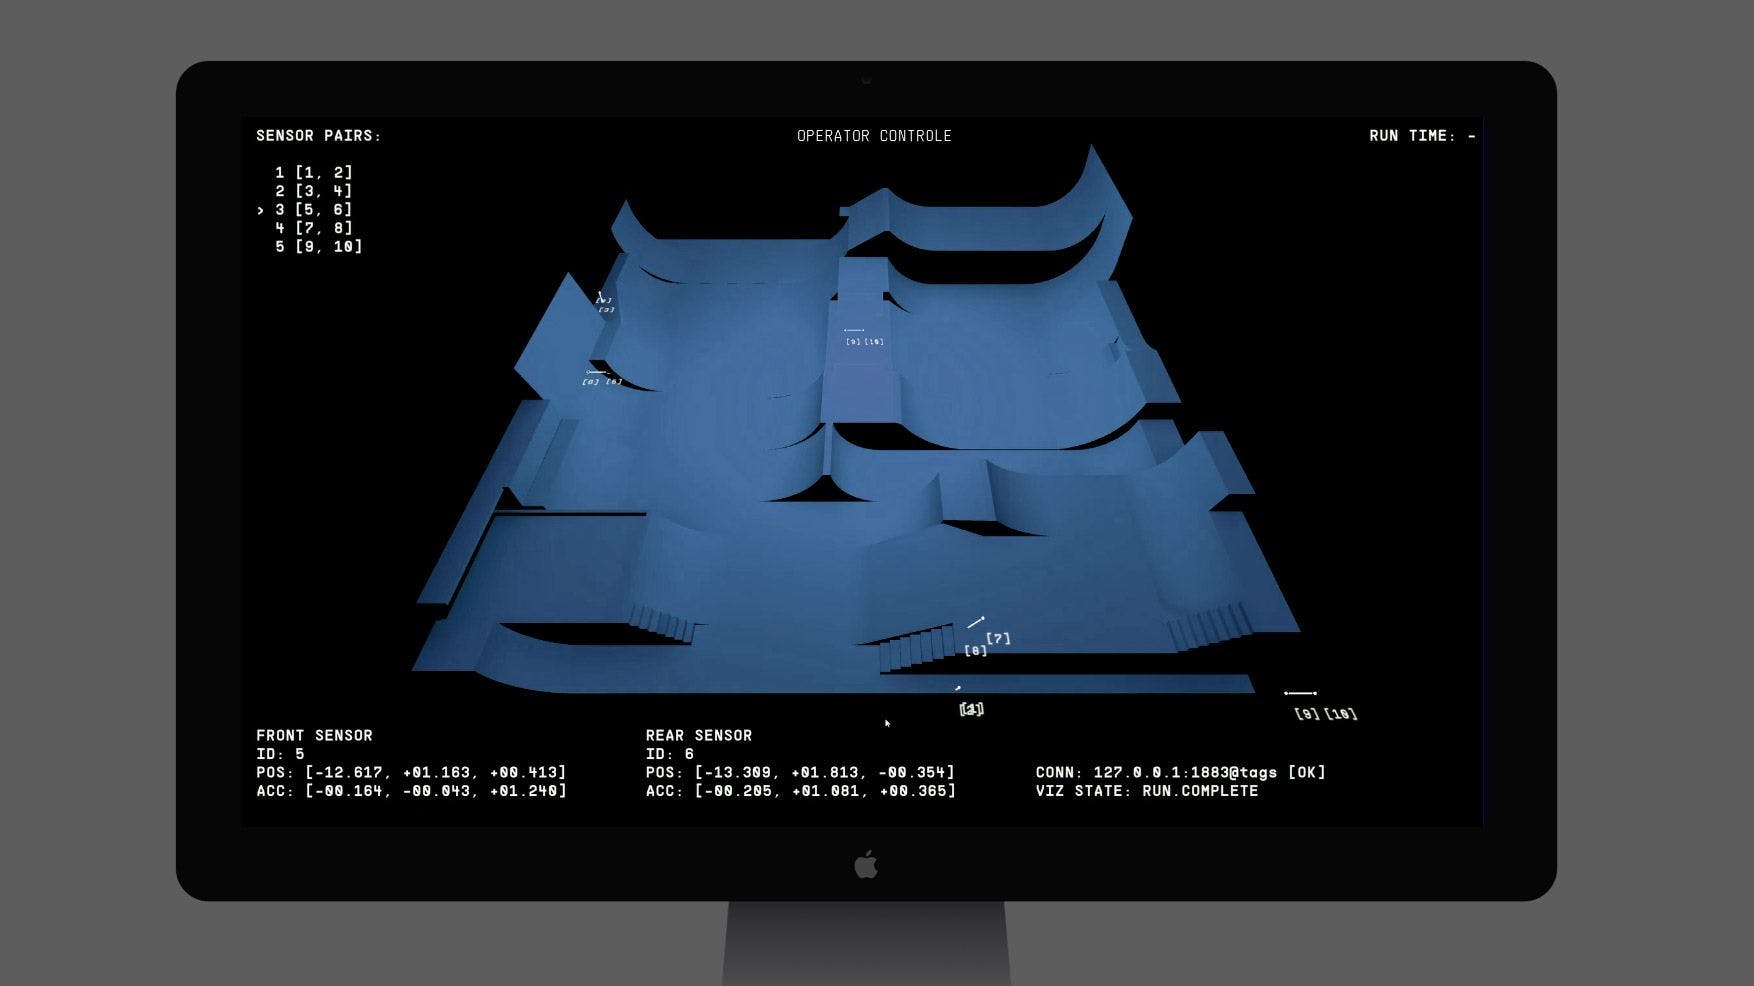
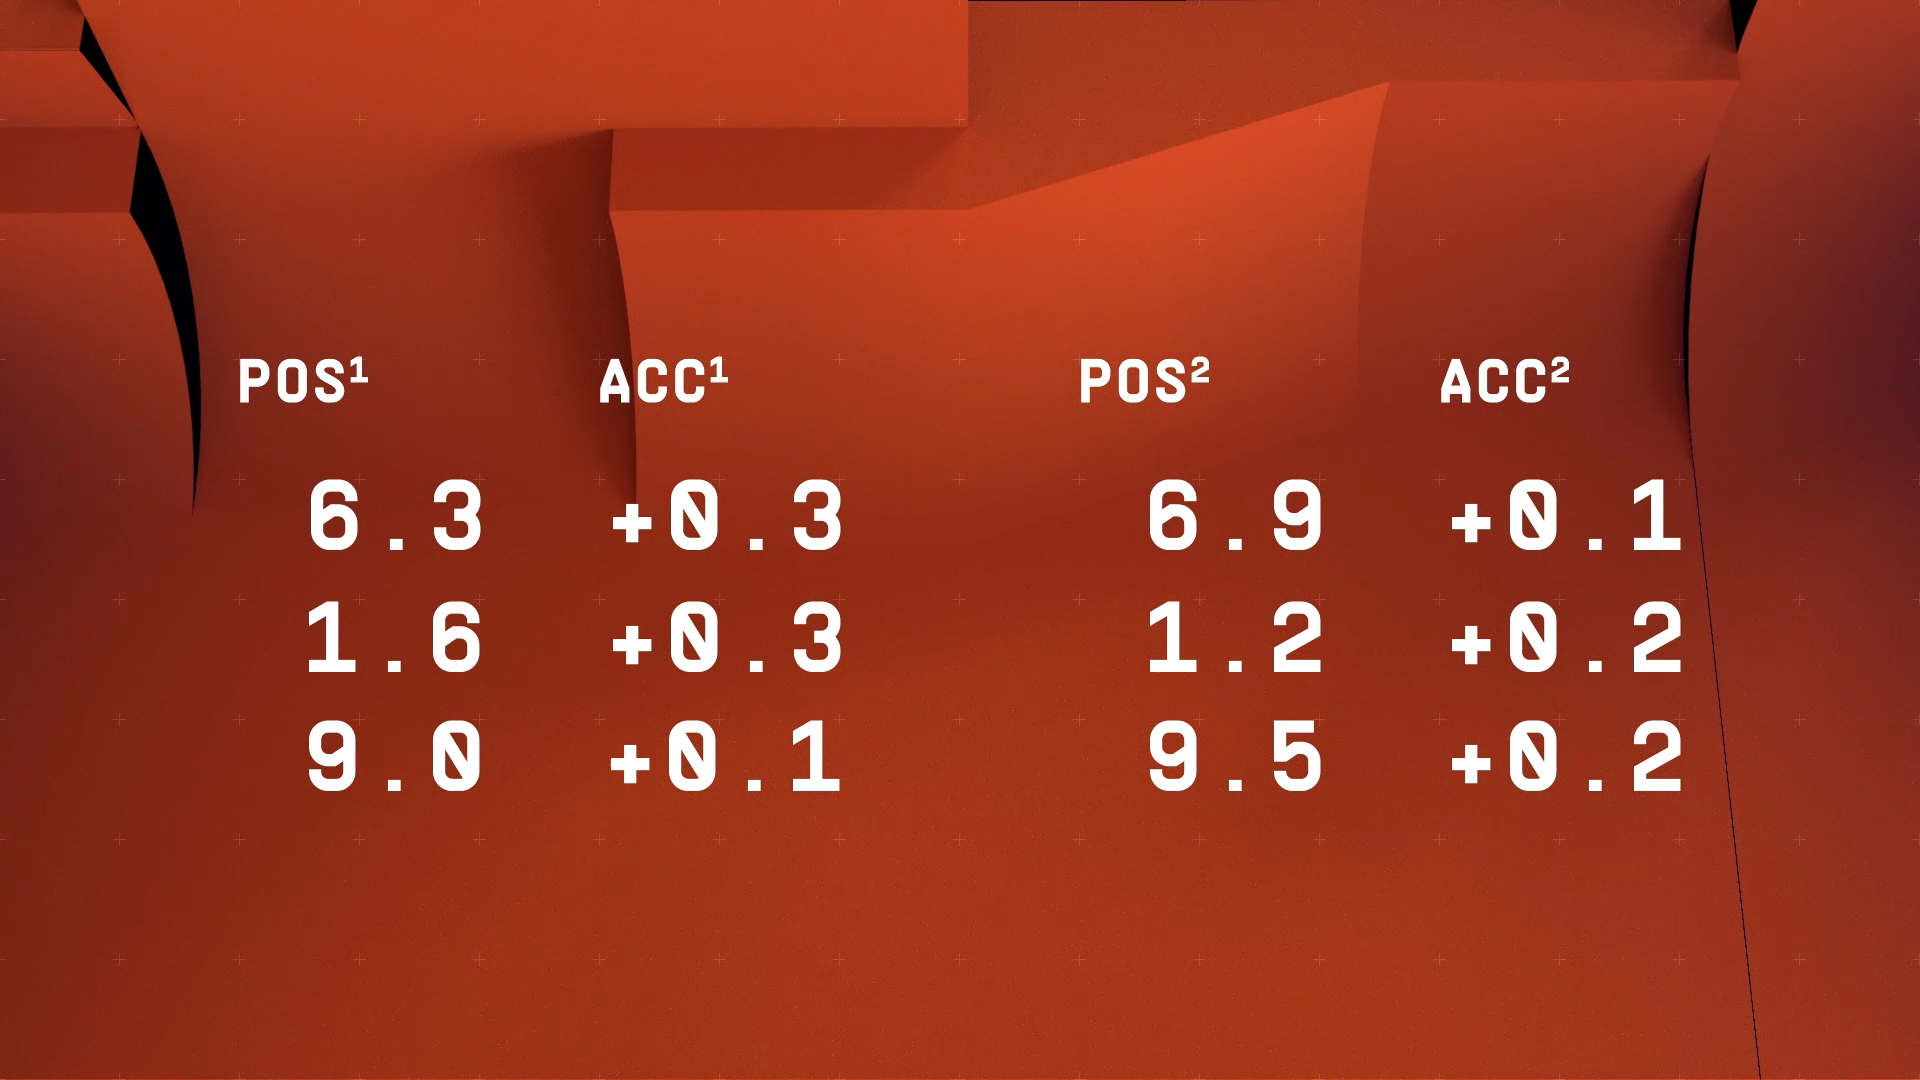
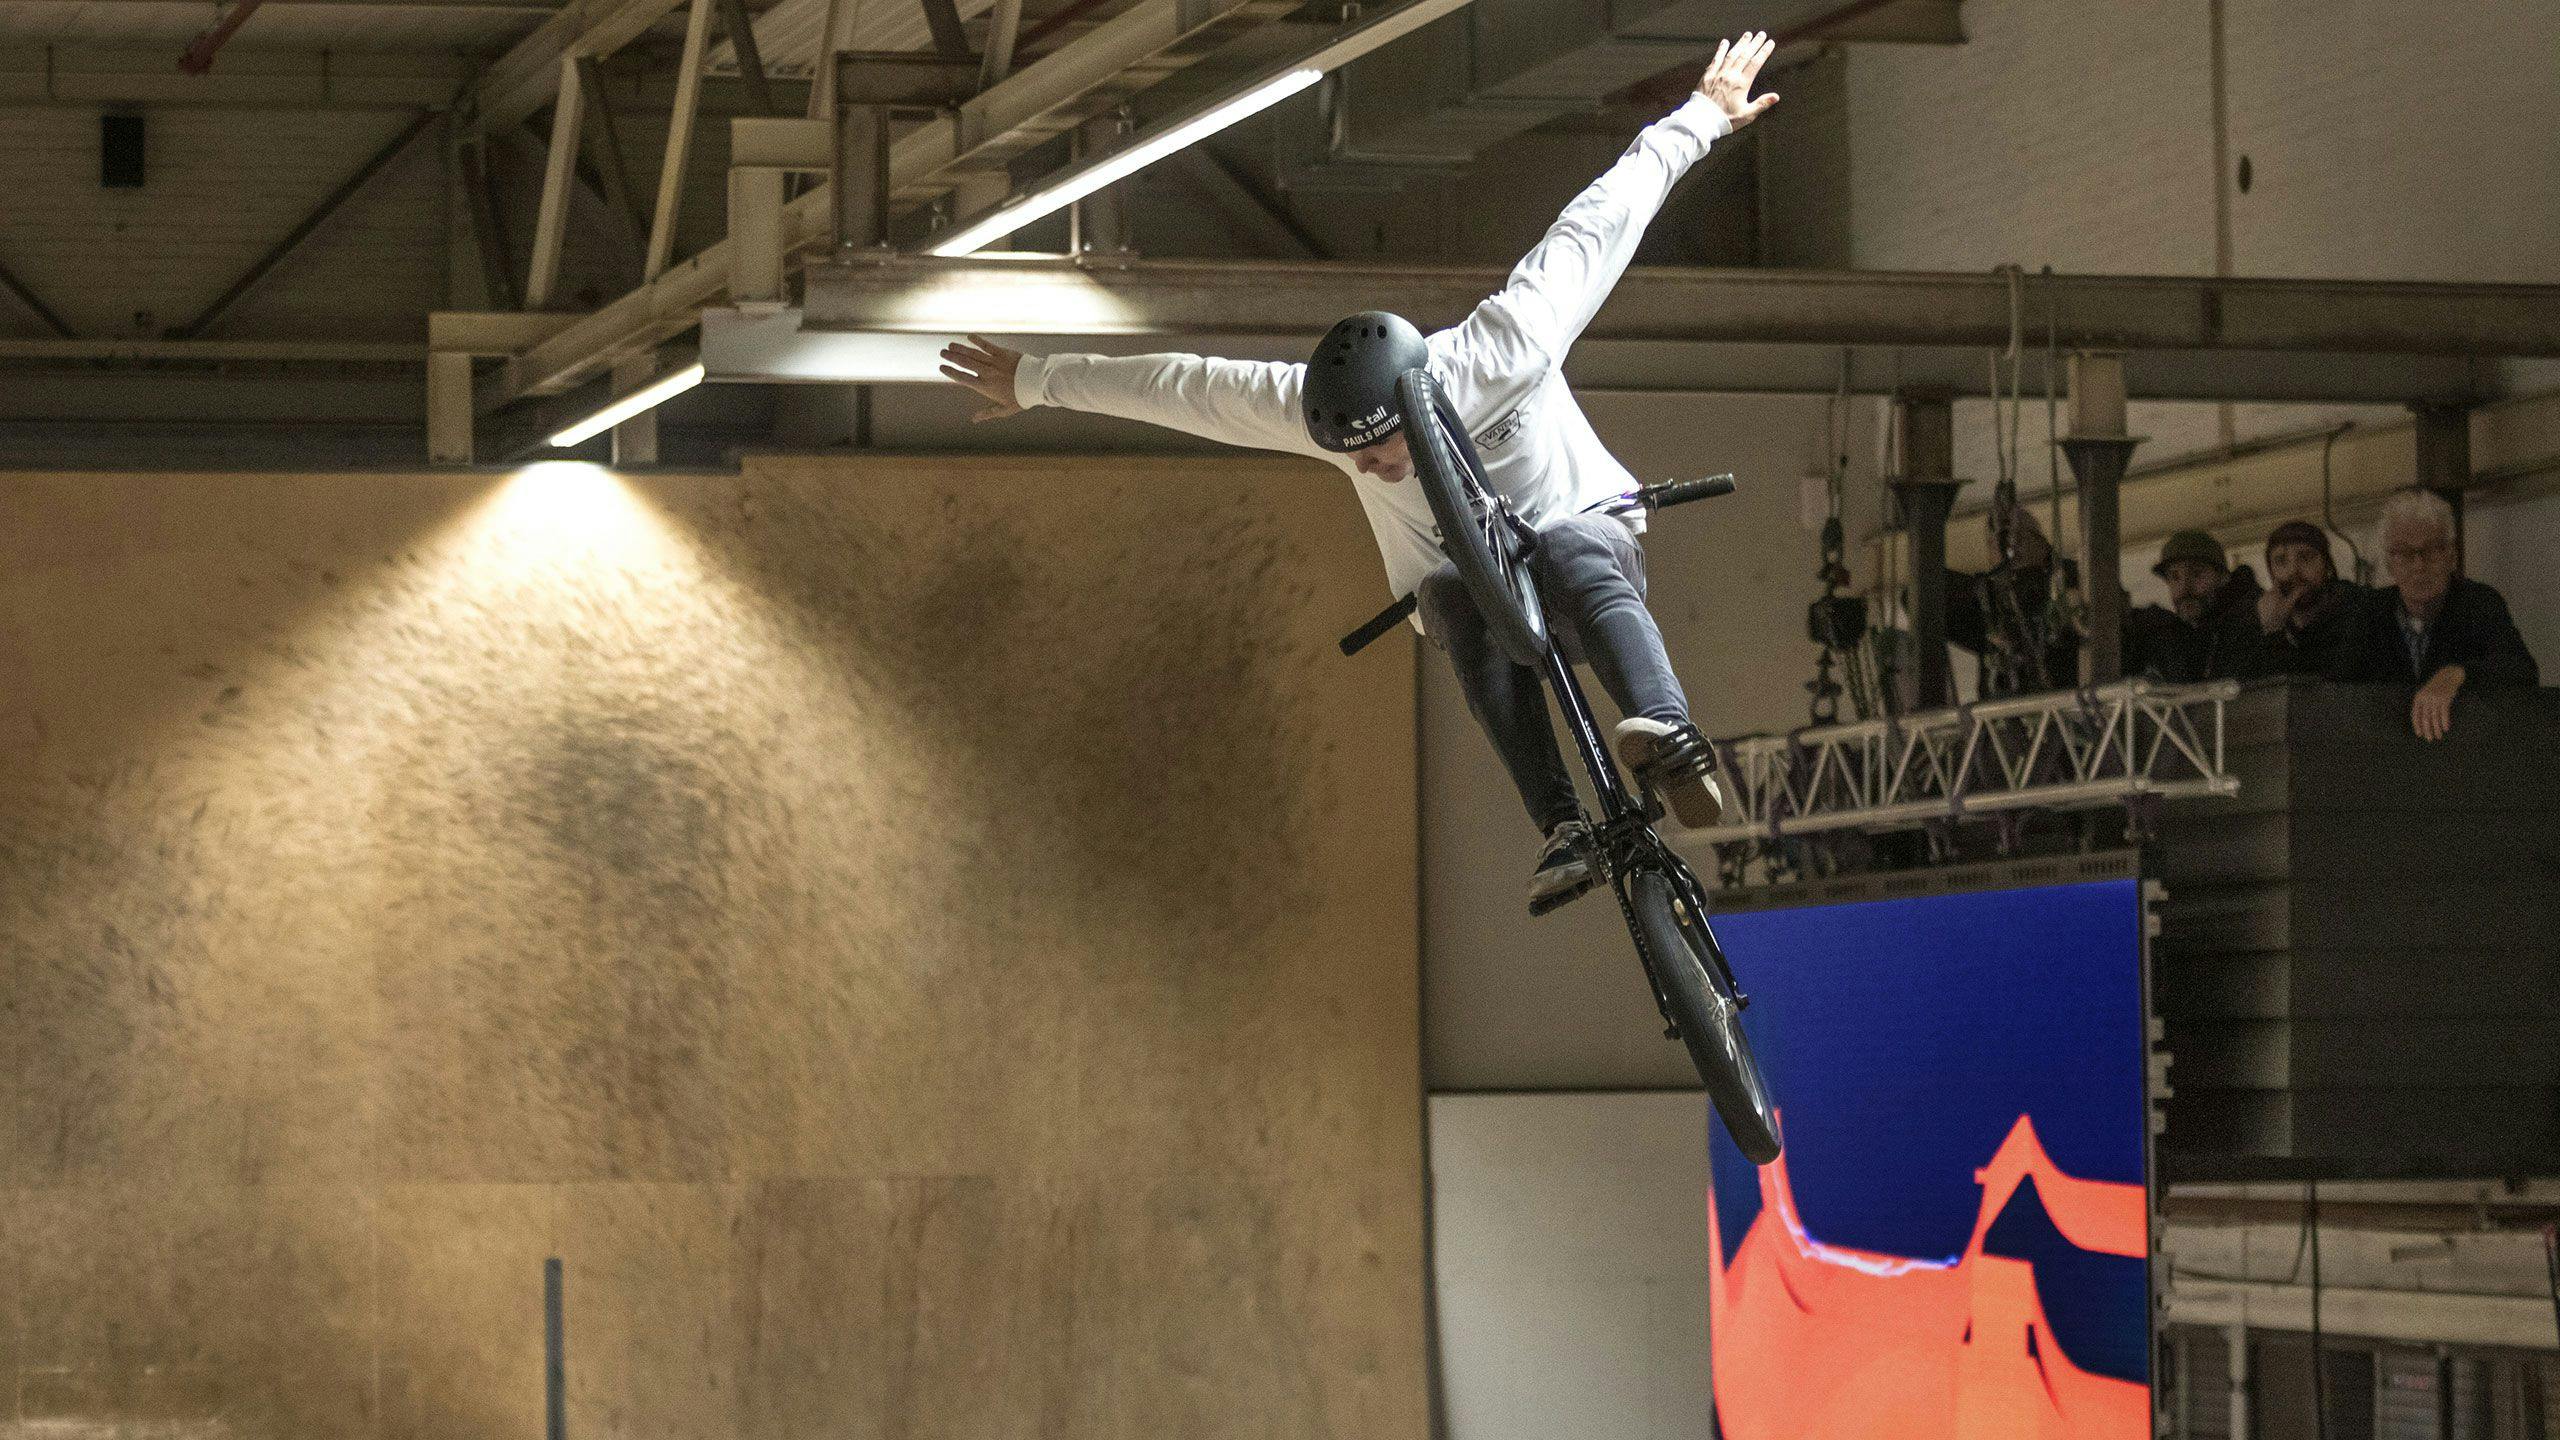
Using two sensors, one on the front of the bike and one on the back, we were able to capture the position, acceleration, height, and rotation of the rider. Using these multiple inputs we were able to visualize the full path of the rider, and deduct speed, rotation, height of jumps, usage of the park, and more.
Hardwaresetup
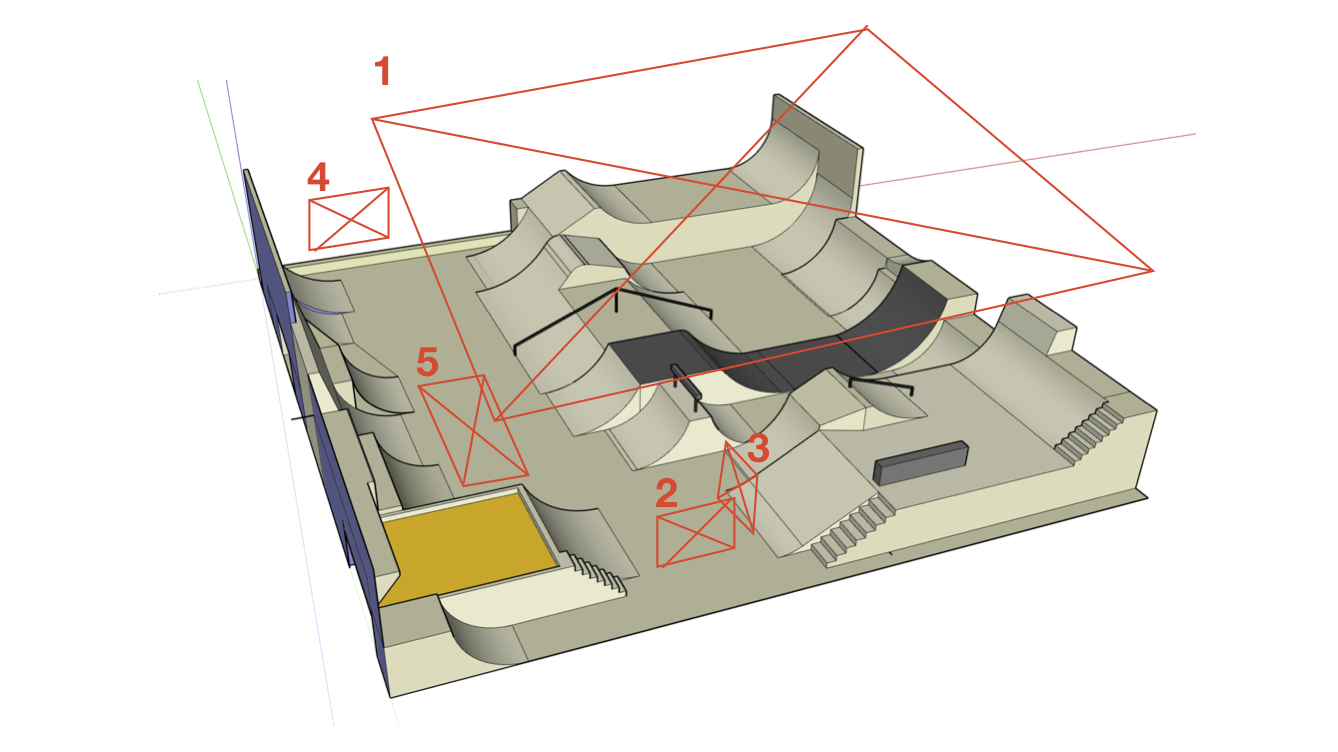
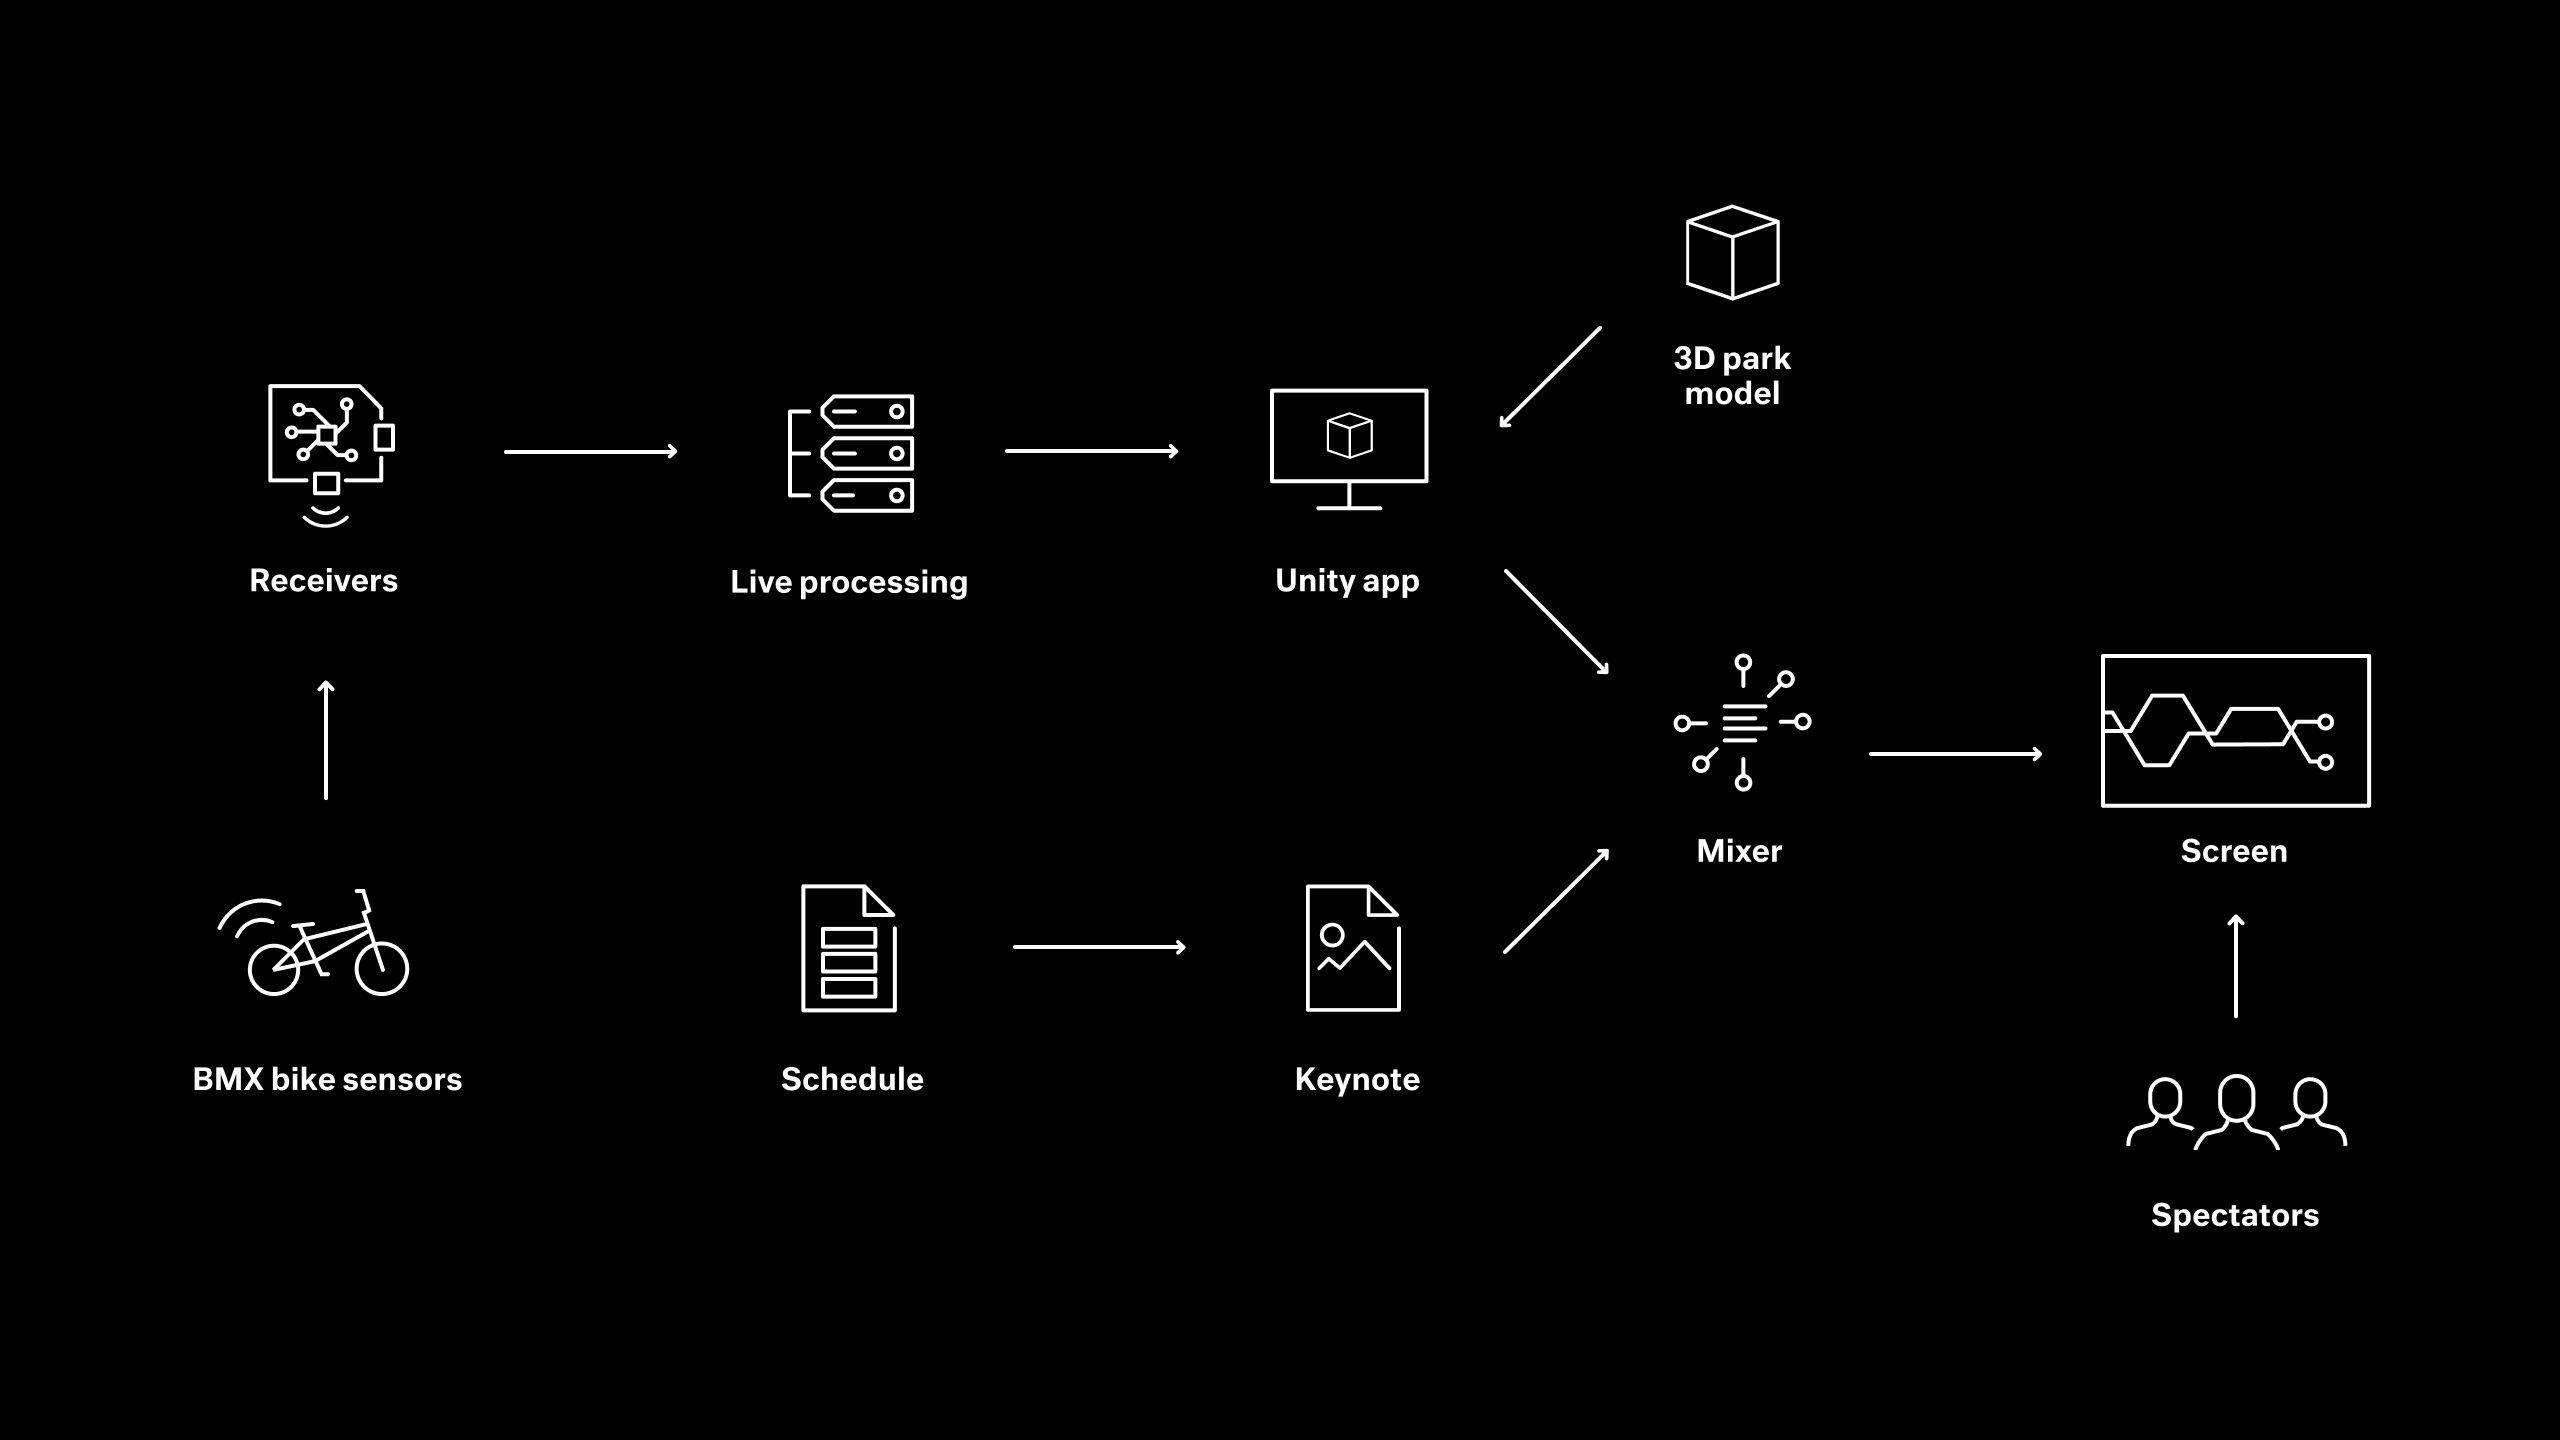
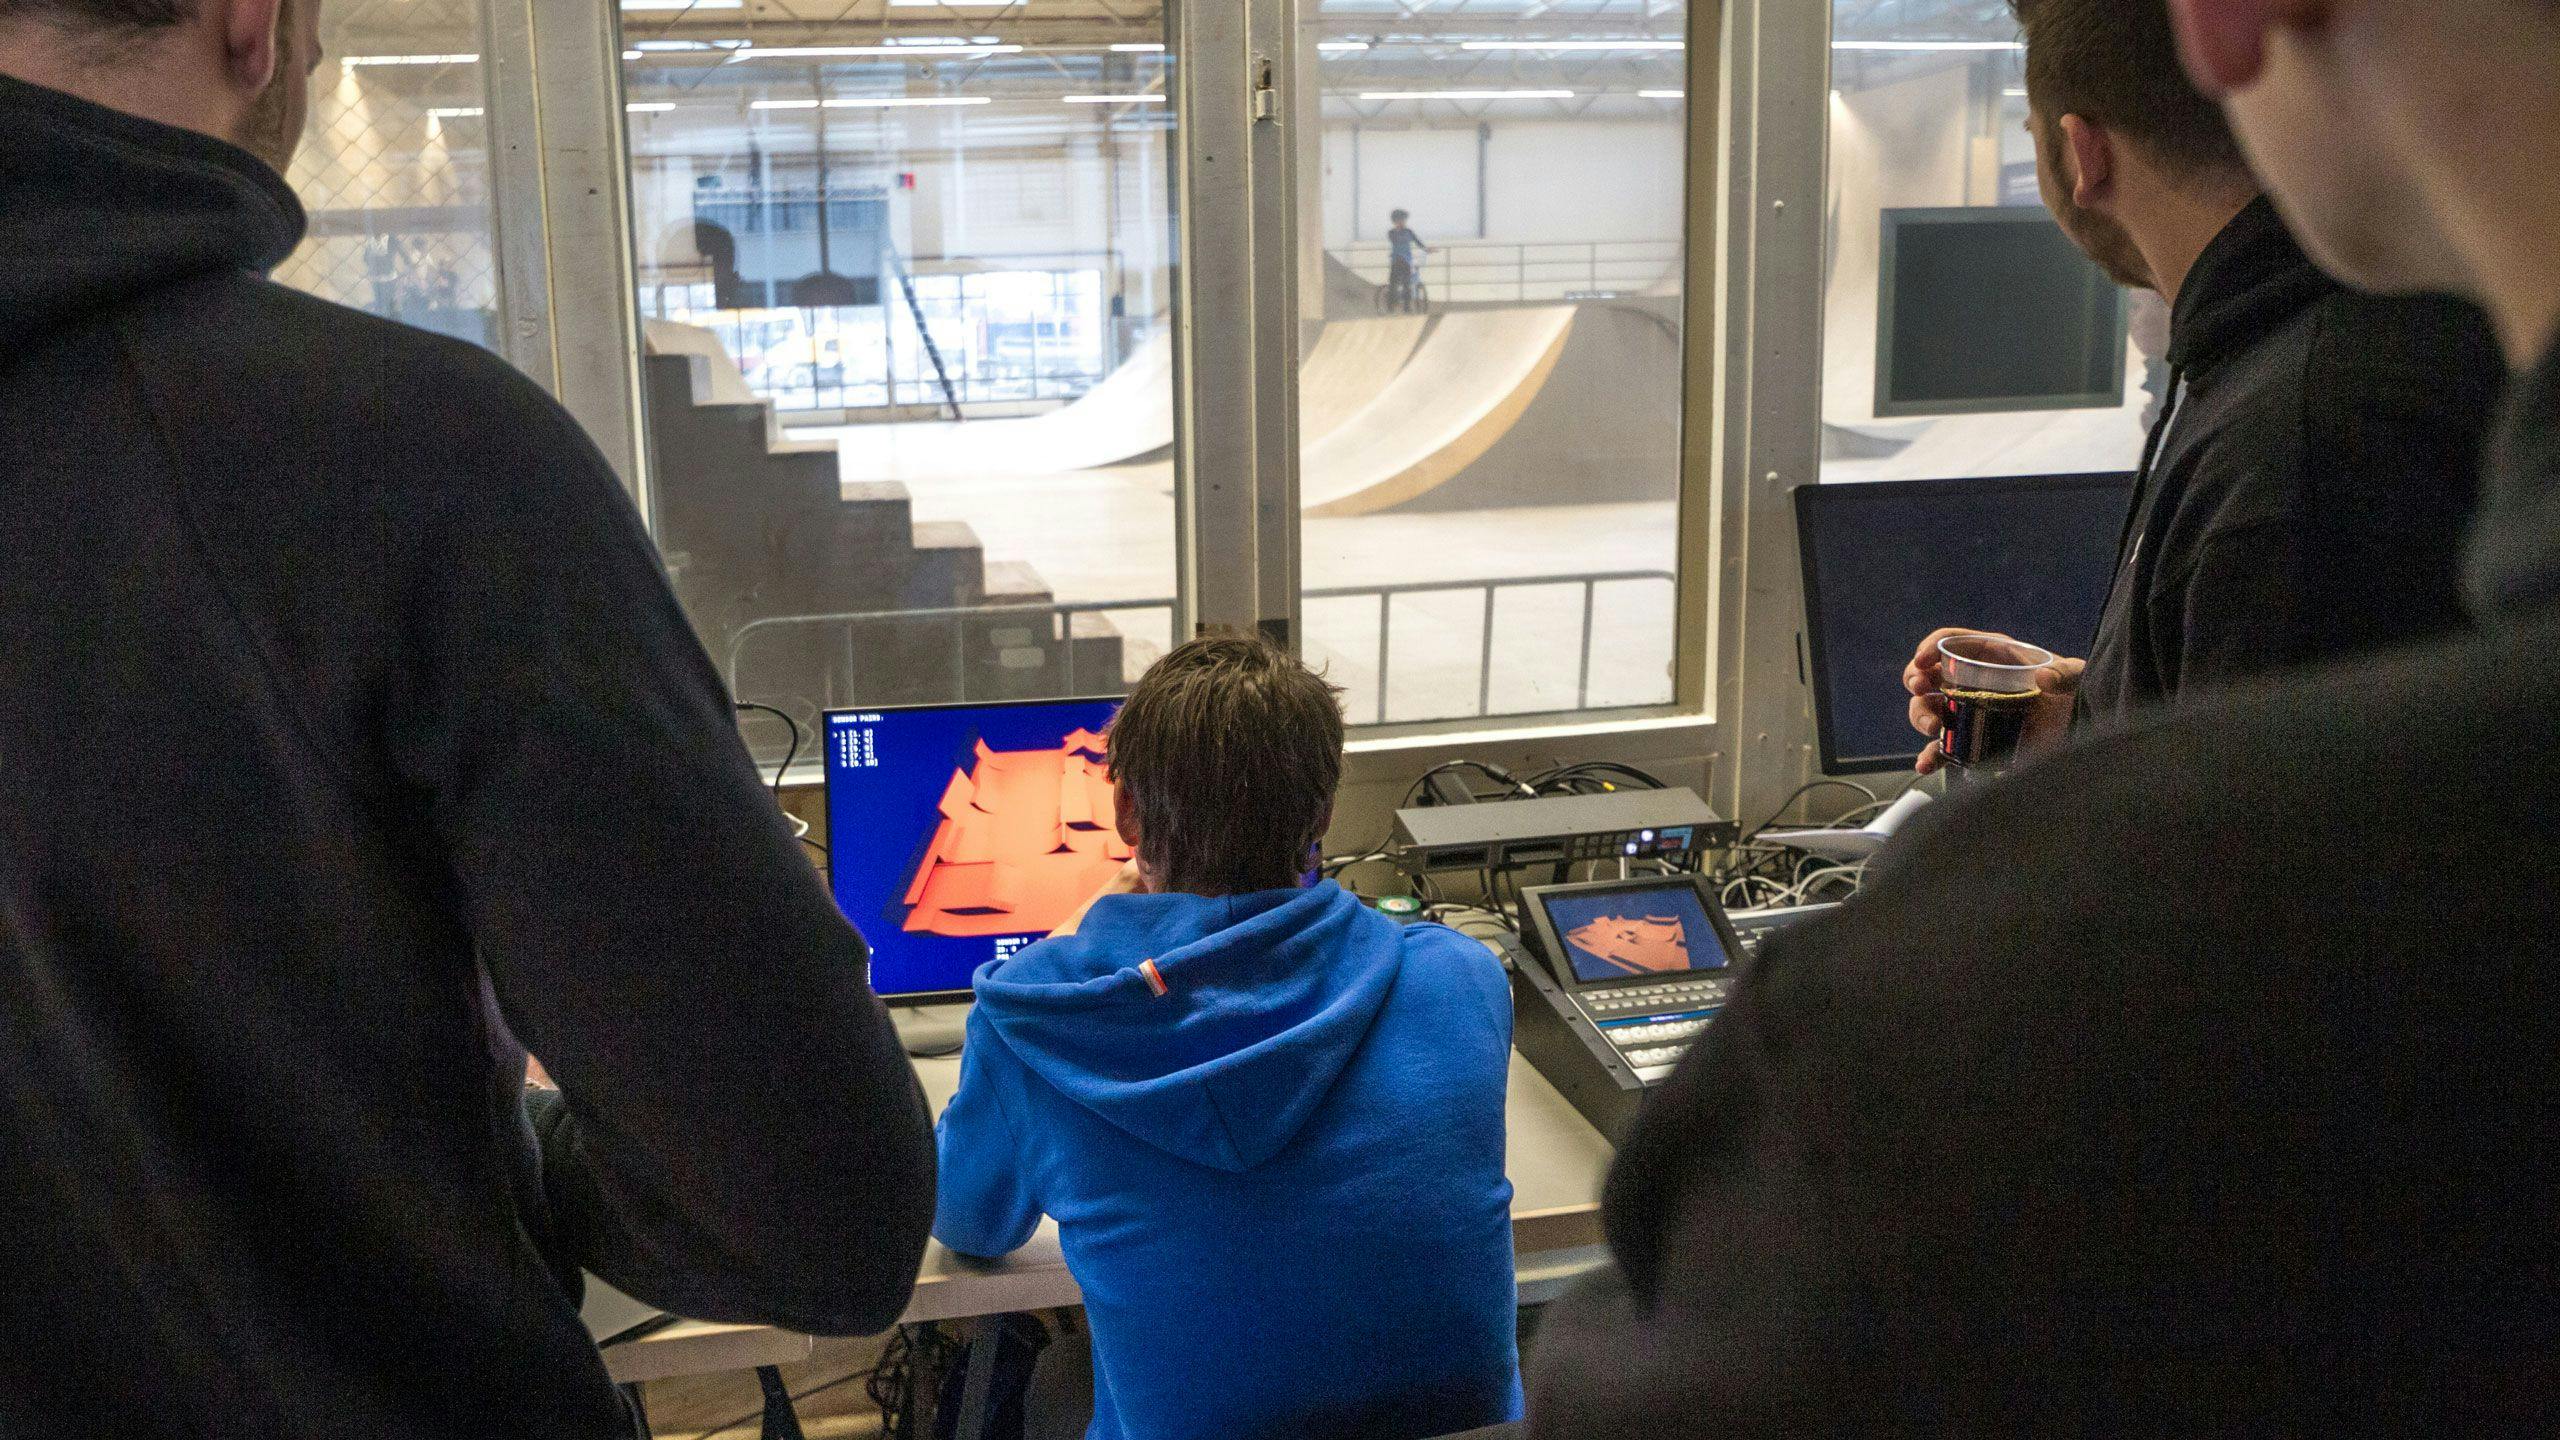
Urban Sports Performance Center used two Pozyx ultra-wideband transmitters (sensors) on the bike that communicated to nine indoor anchors that were placed around and above the BMX park.
That position data was processed into near real-time and together with the sensor readings published via MQTT to the render application for visualization.
Because we wanted a highly graphical fidelity and high performance 3D, we chose Unity3D as our rendering framework. We also wanted to display rider announcements and rankings to the audience. For that, we used Keynote and keyed that onto the live visual with a video mixer.
Design
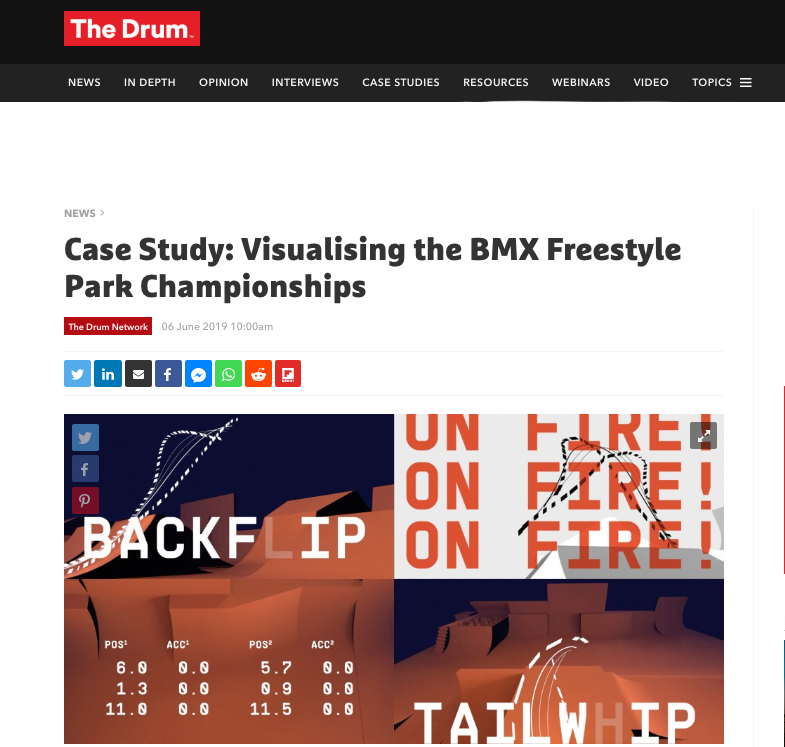
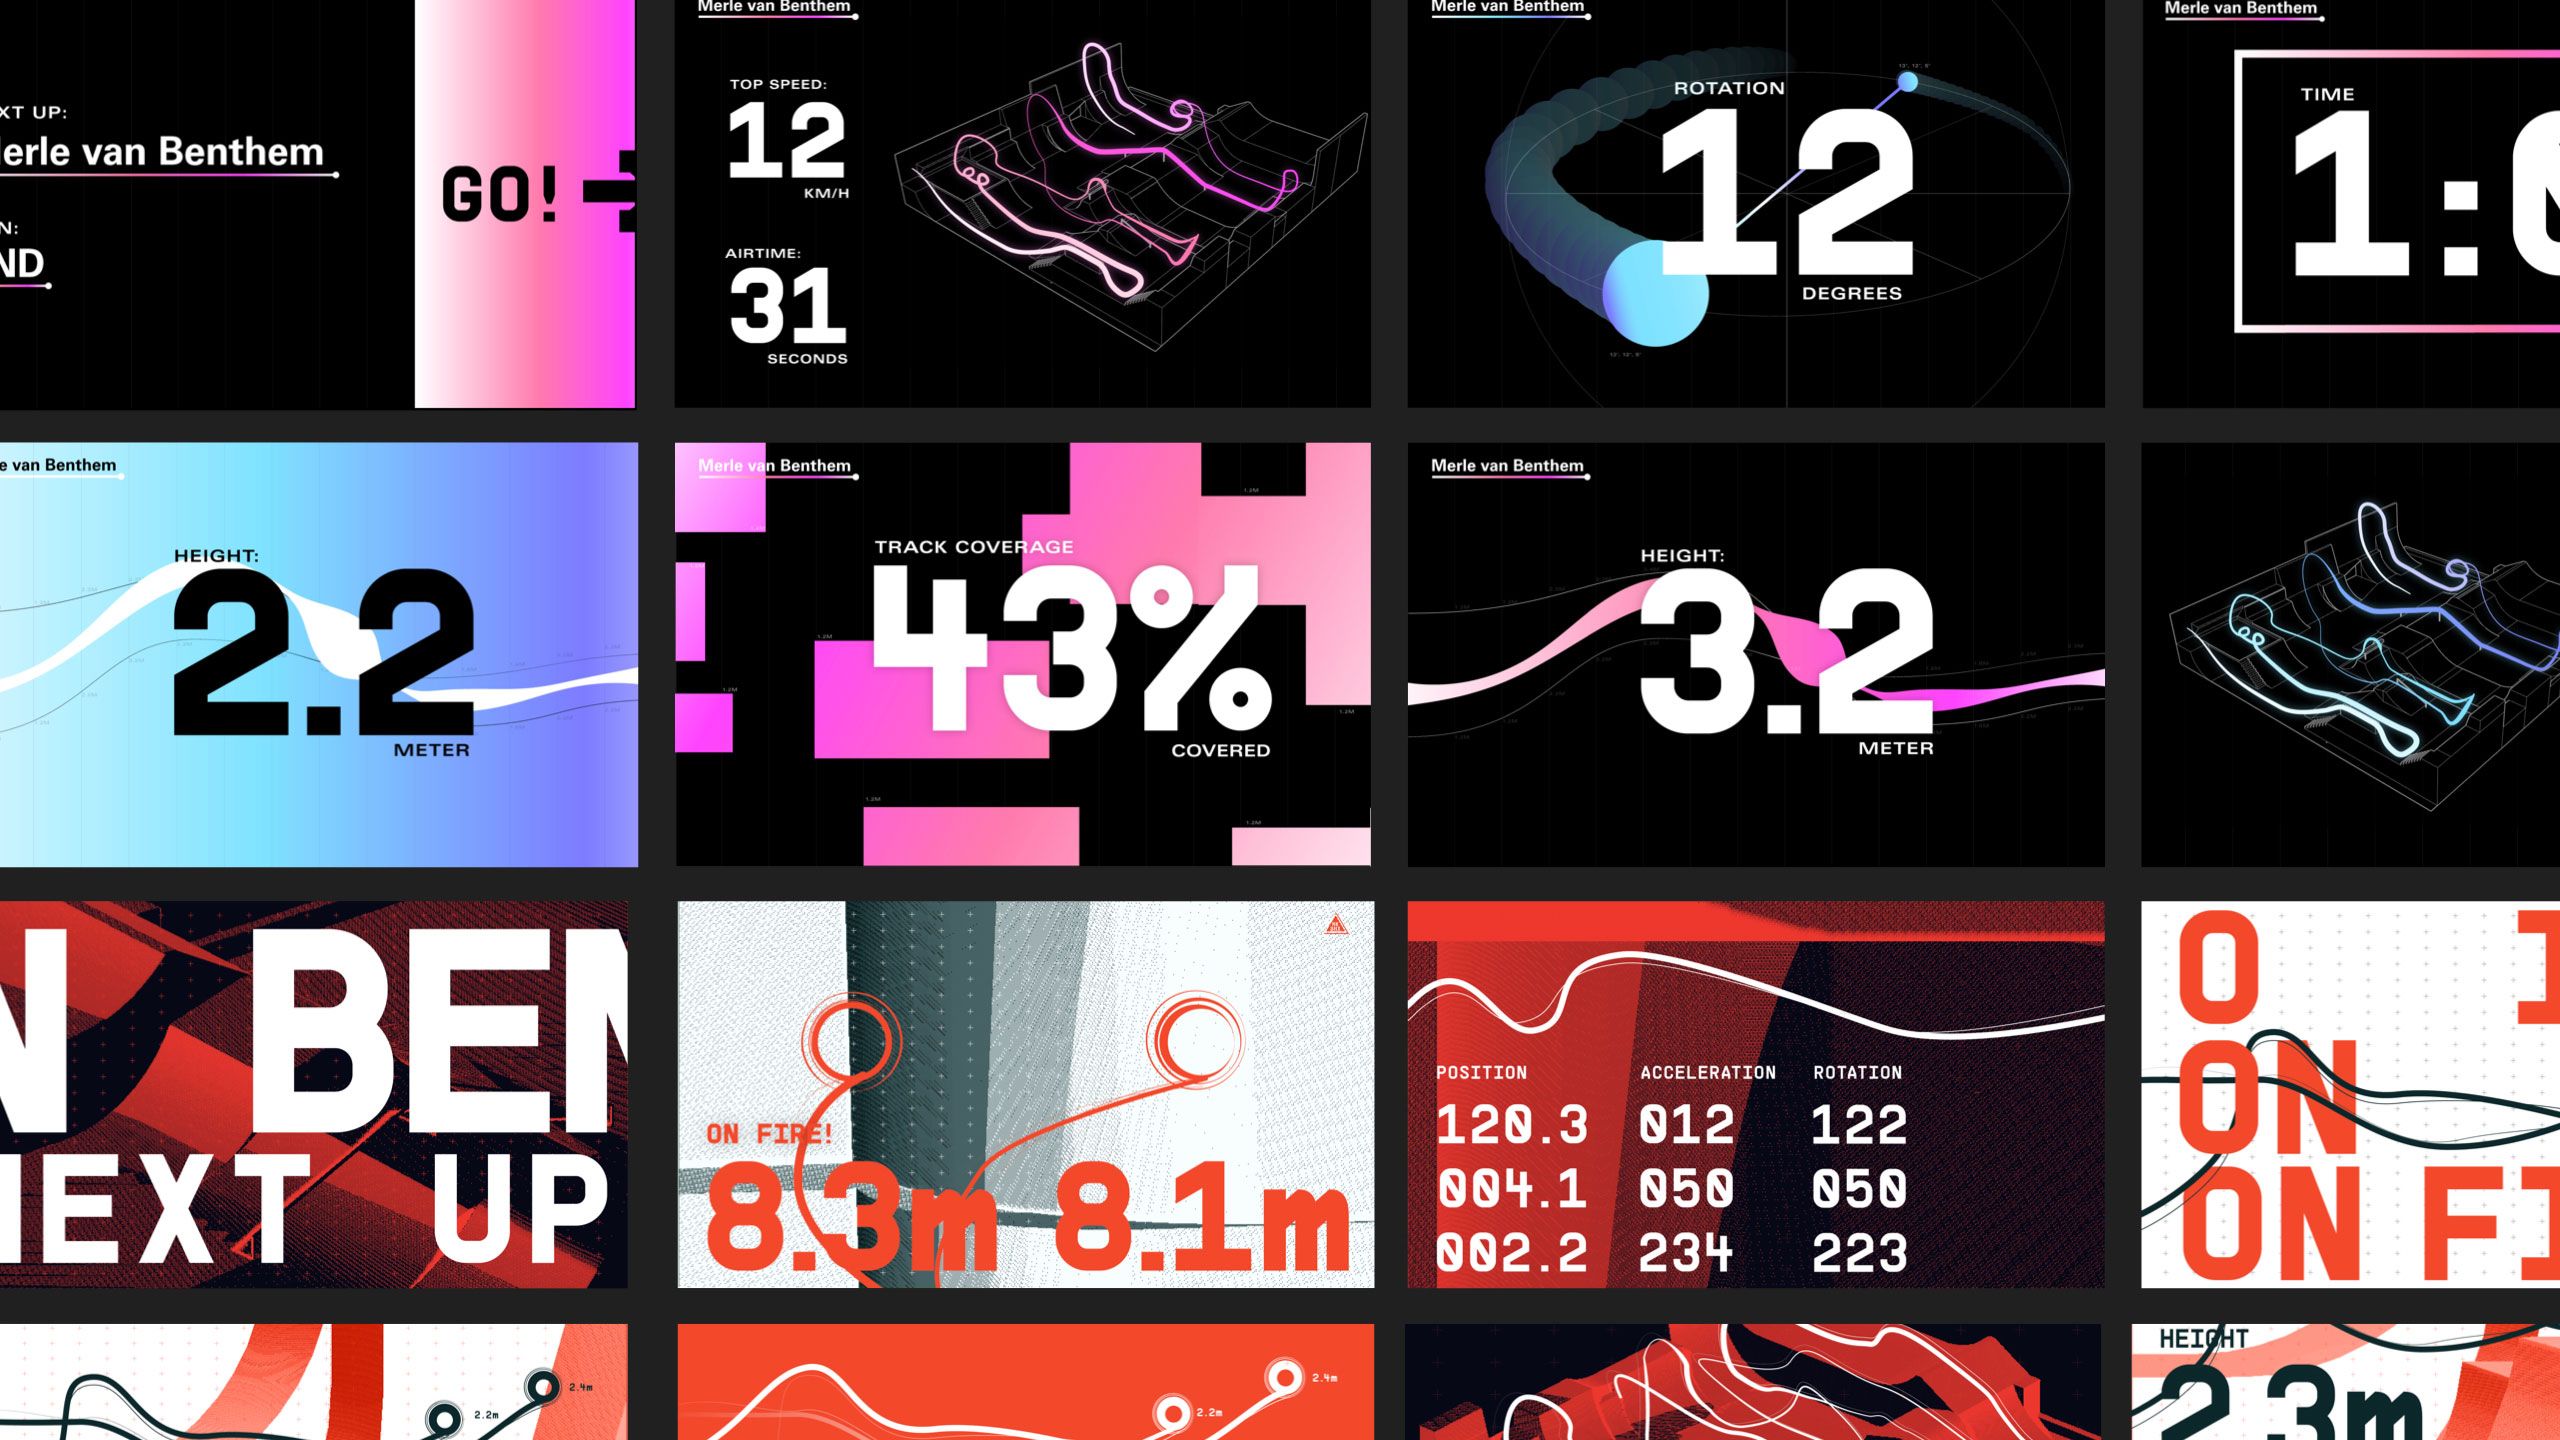
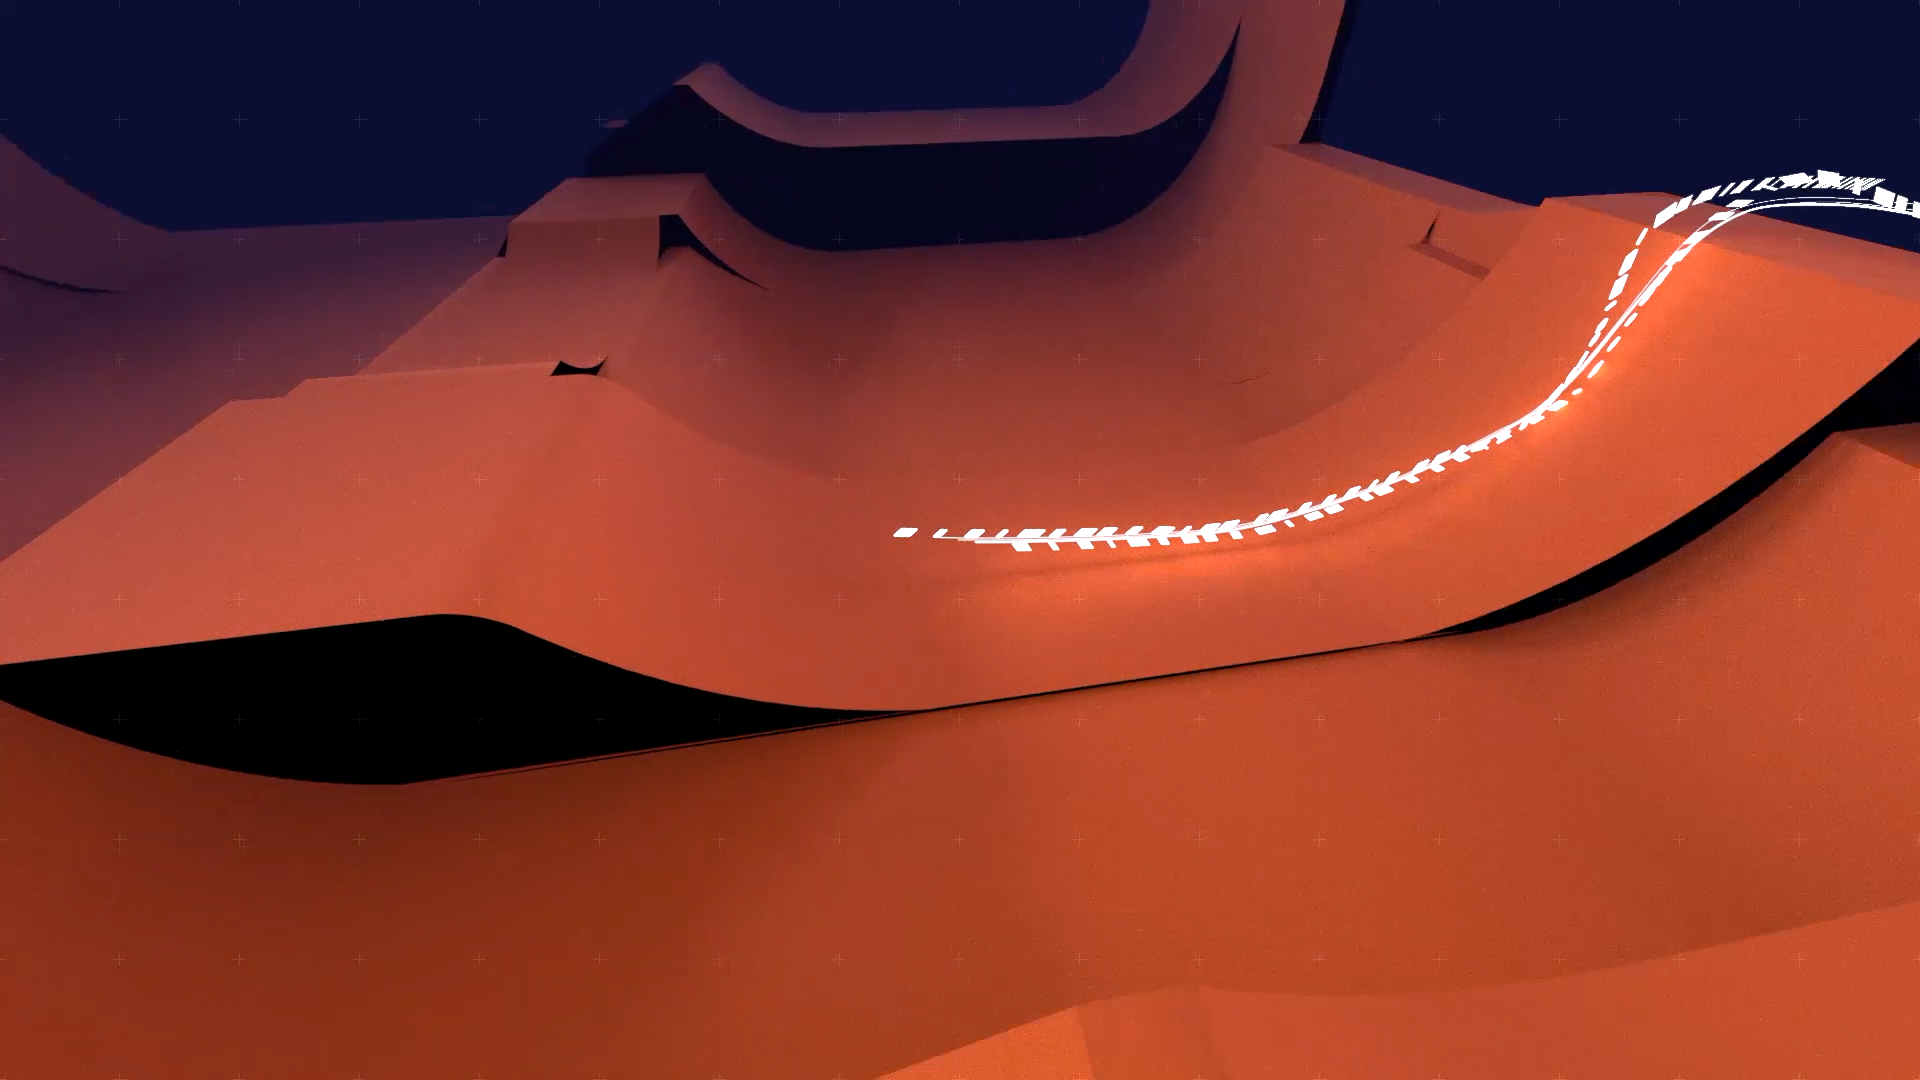
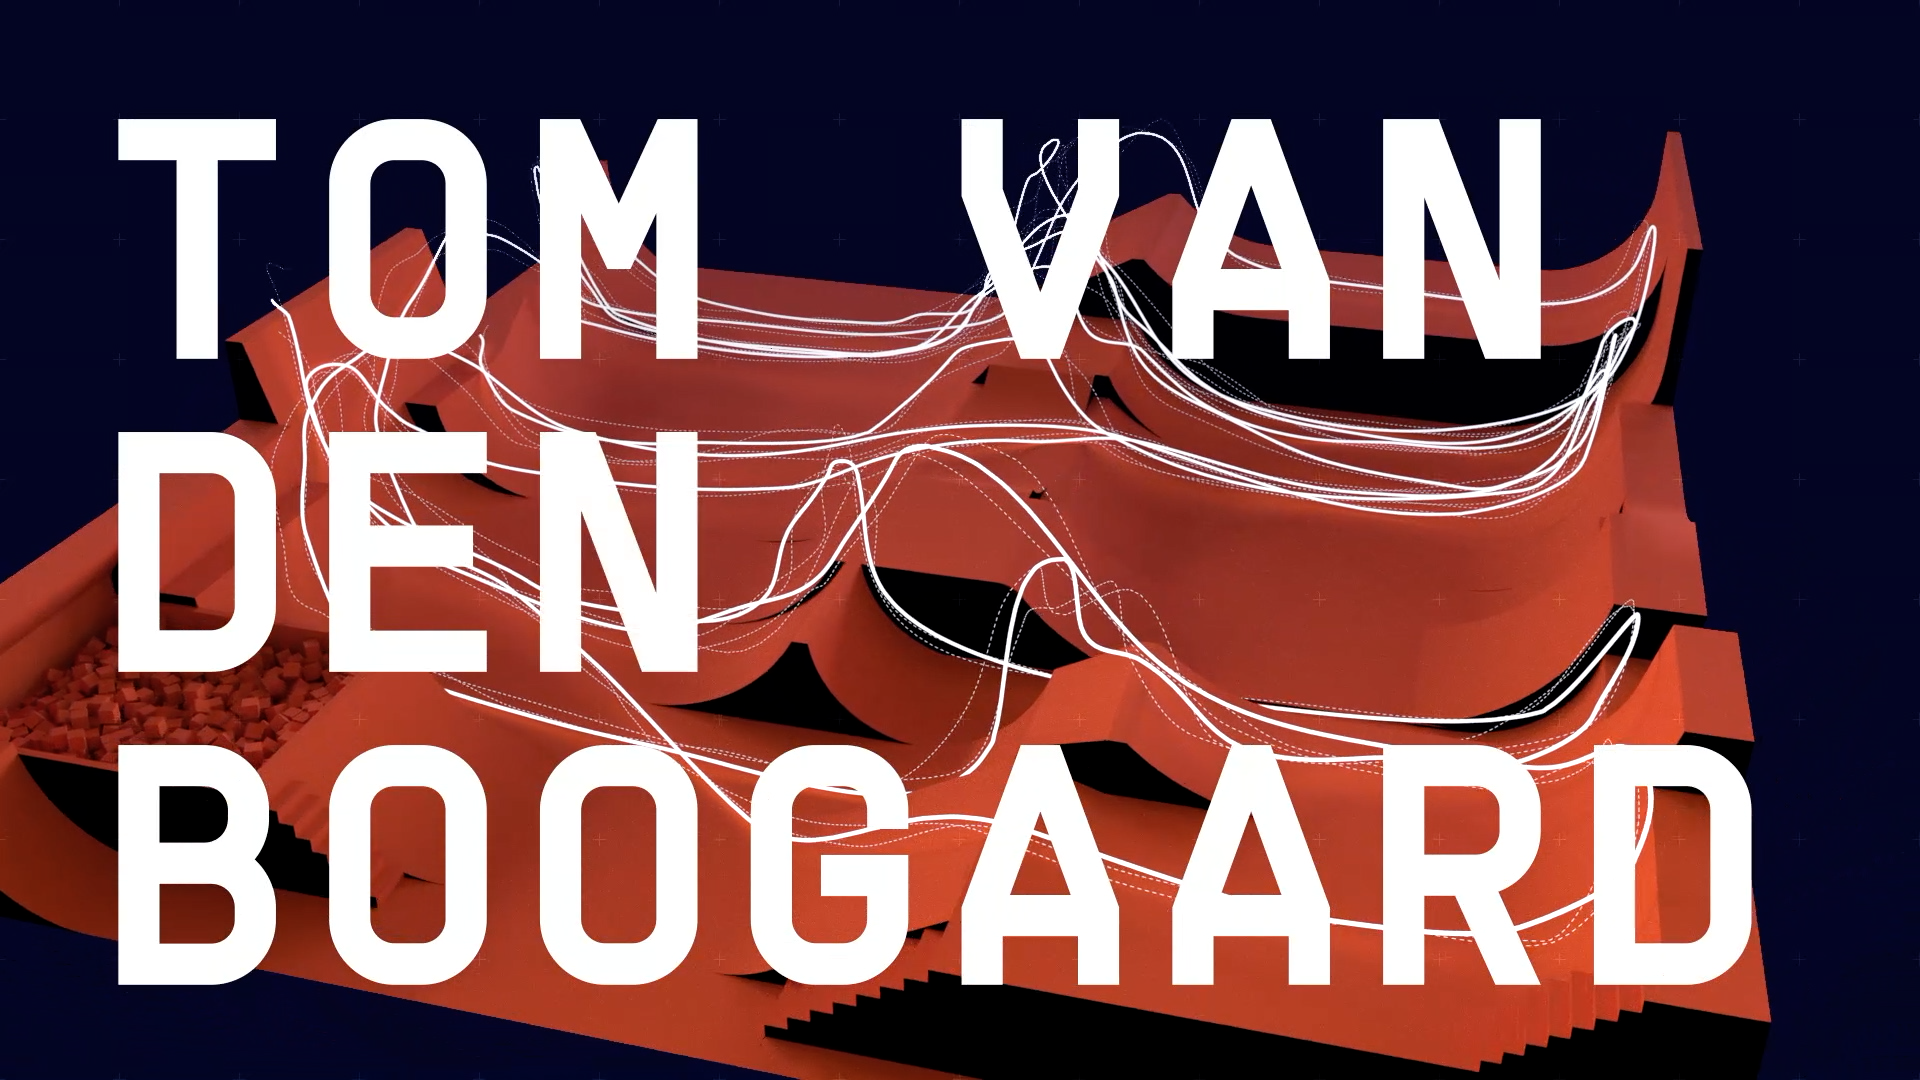
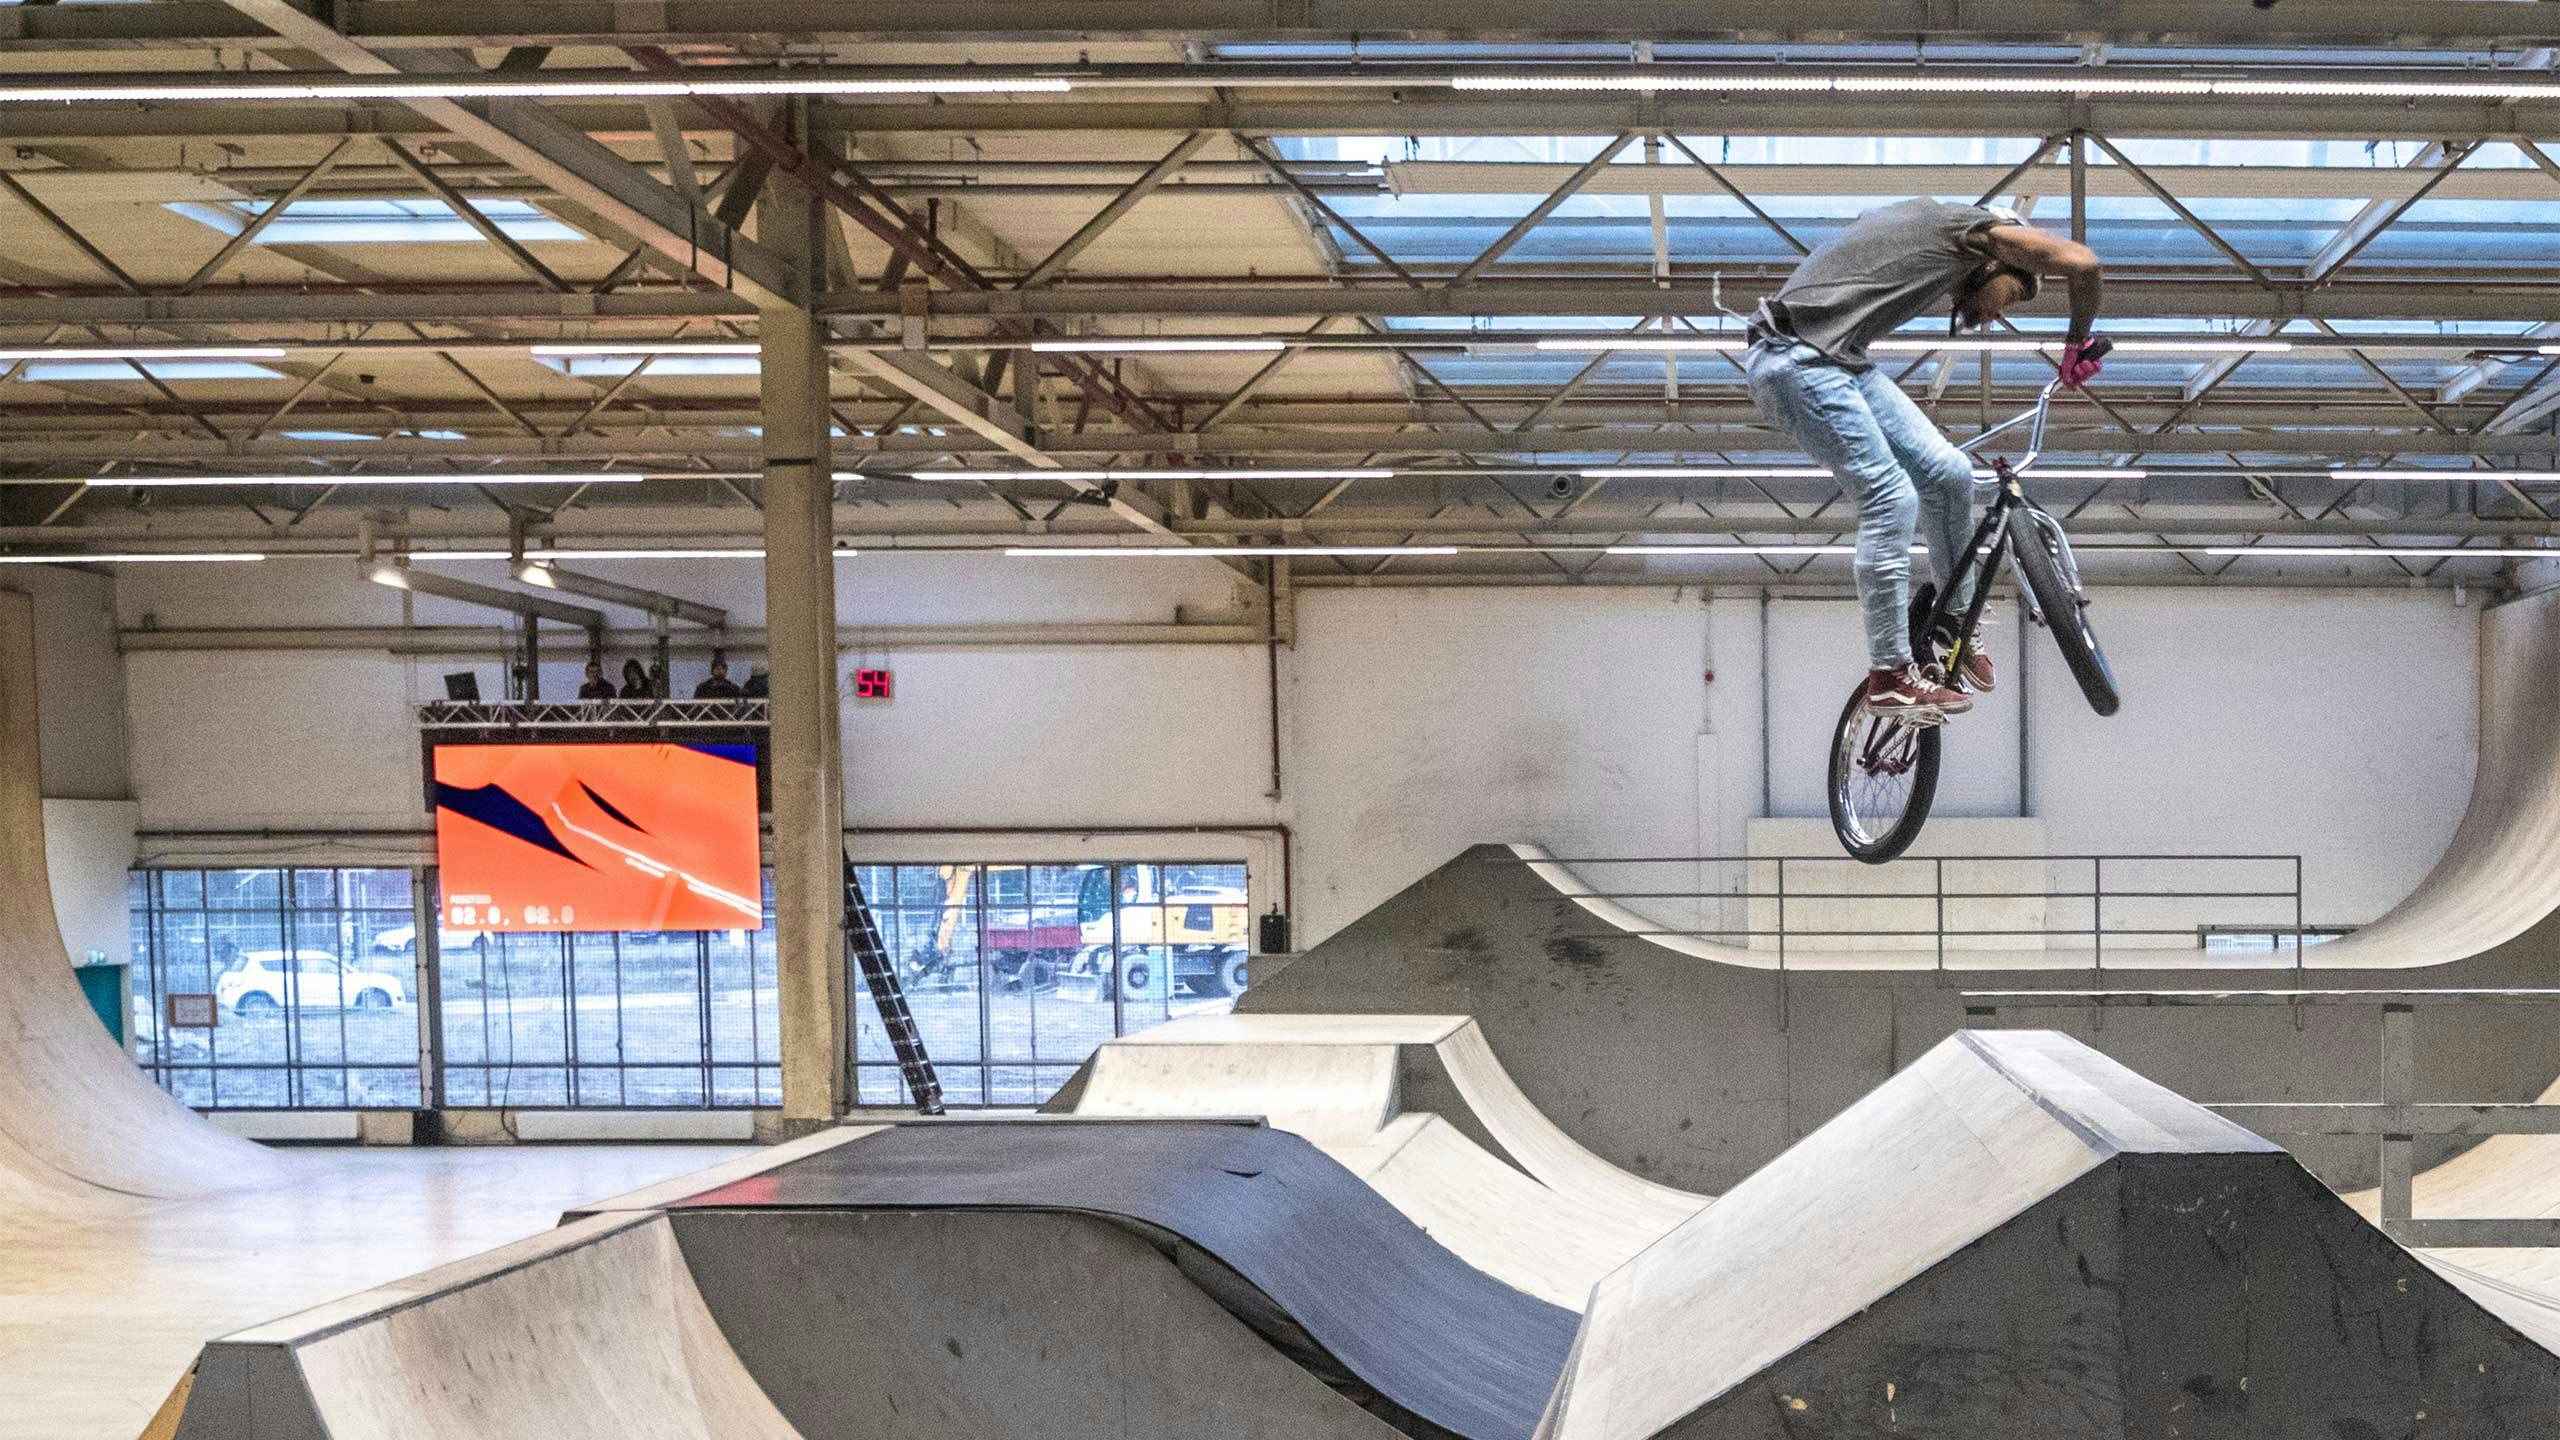
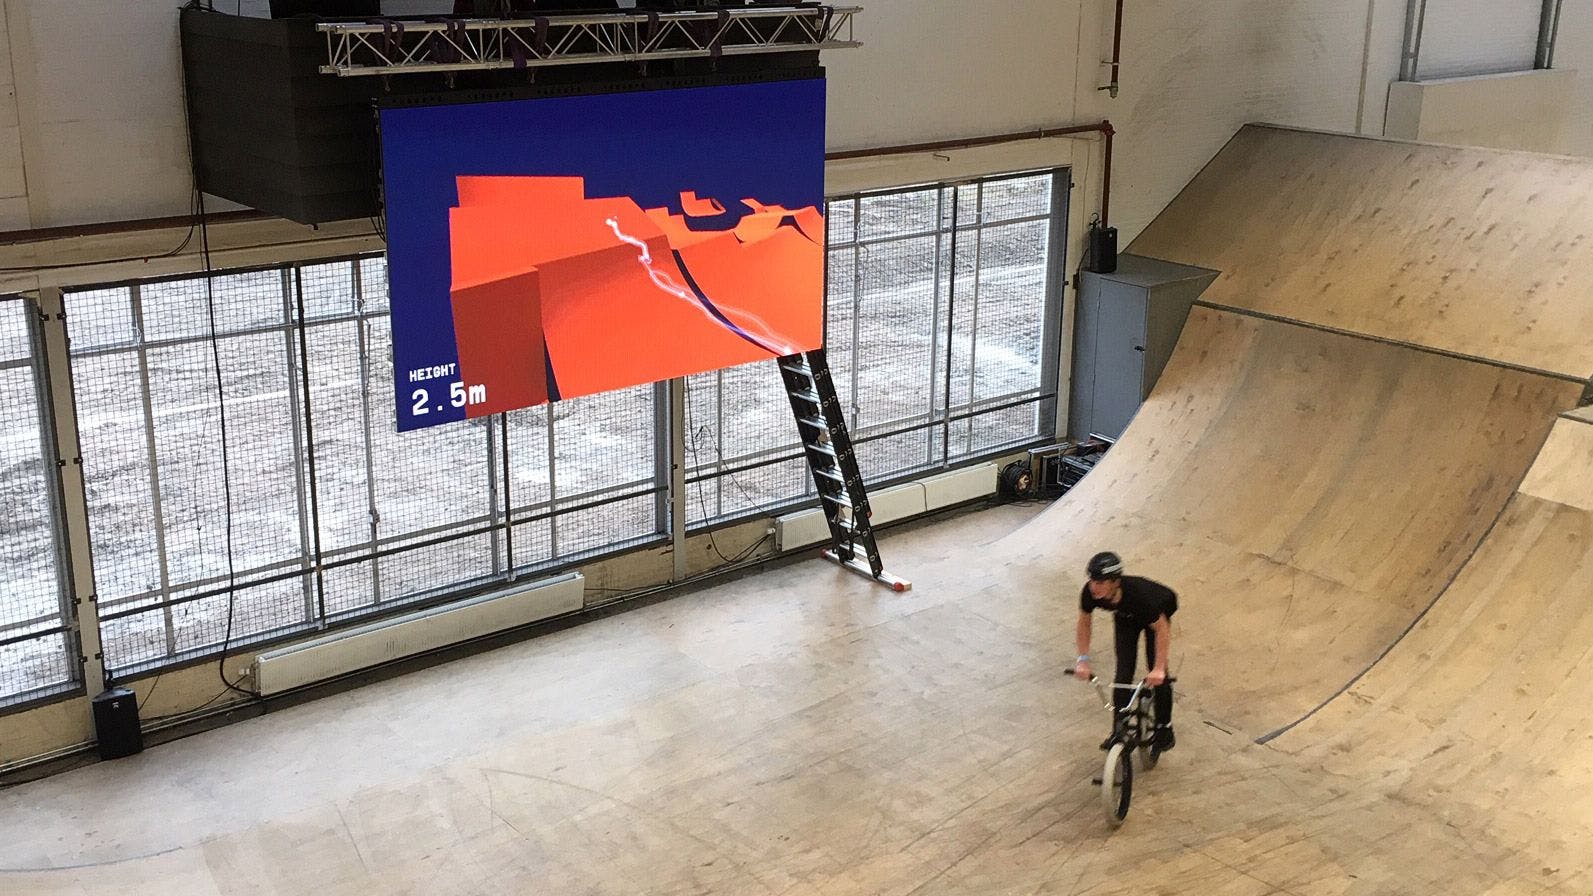
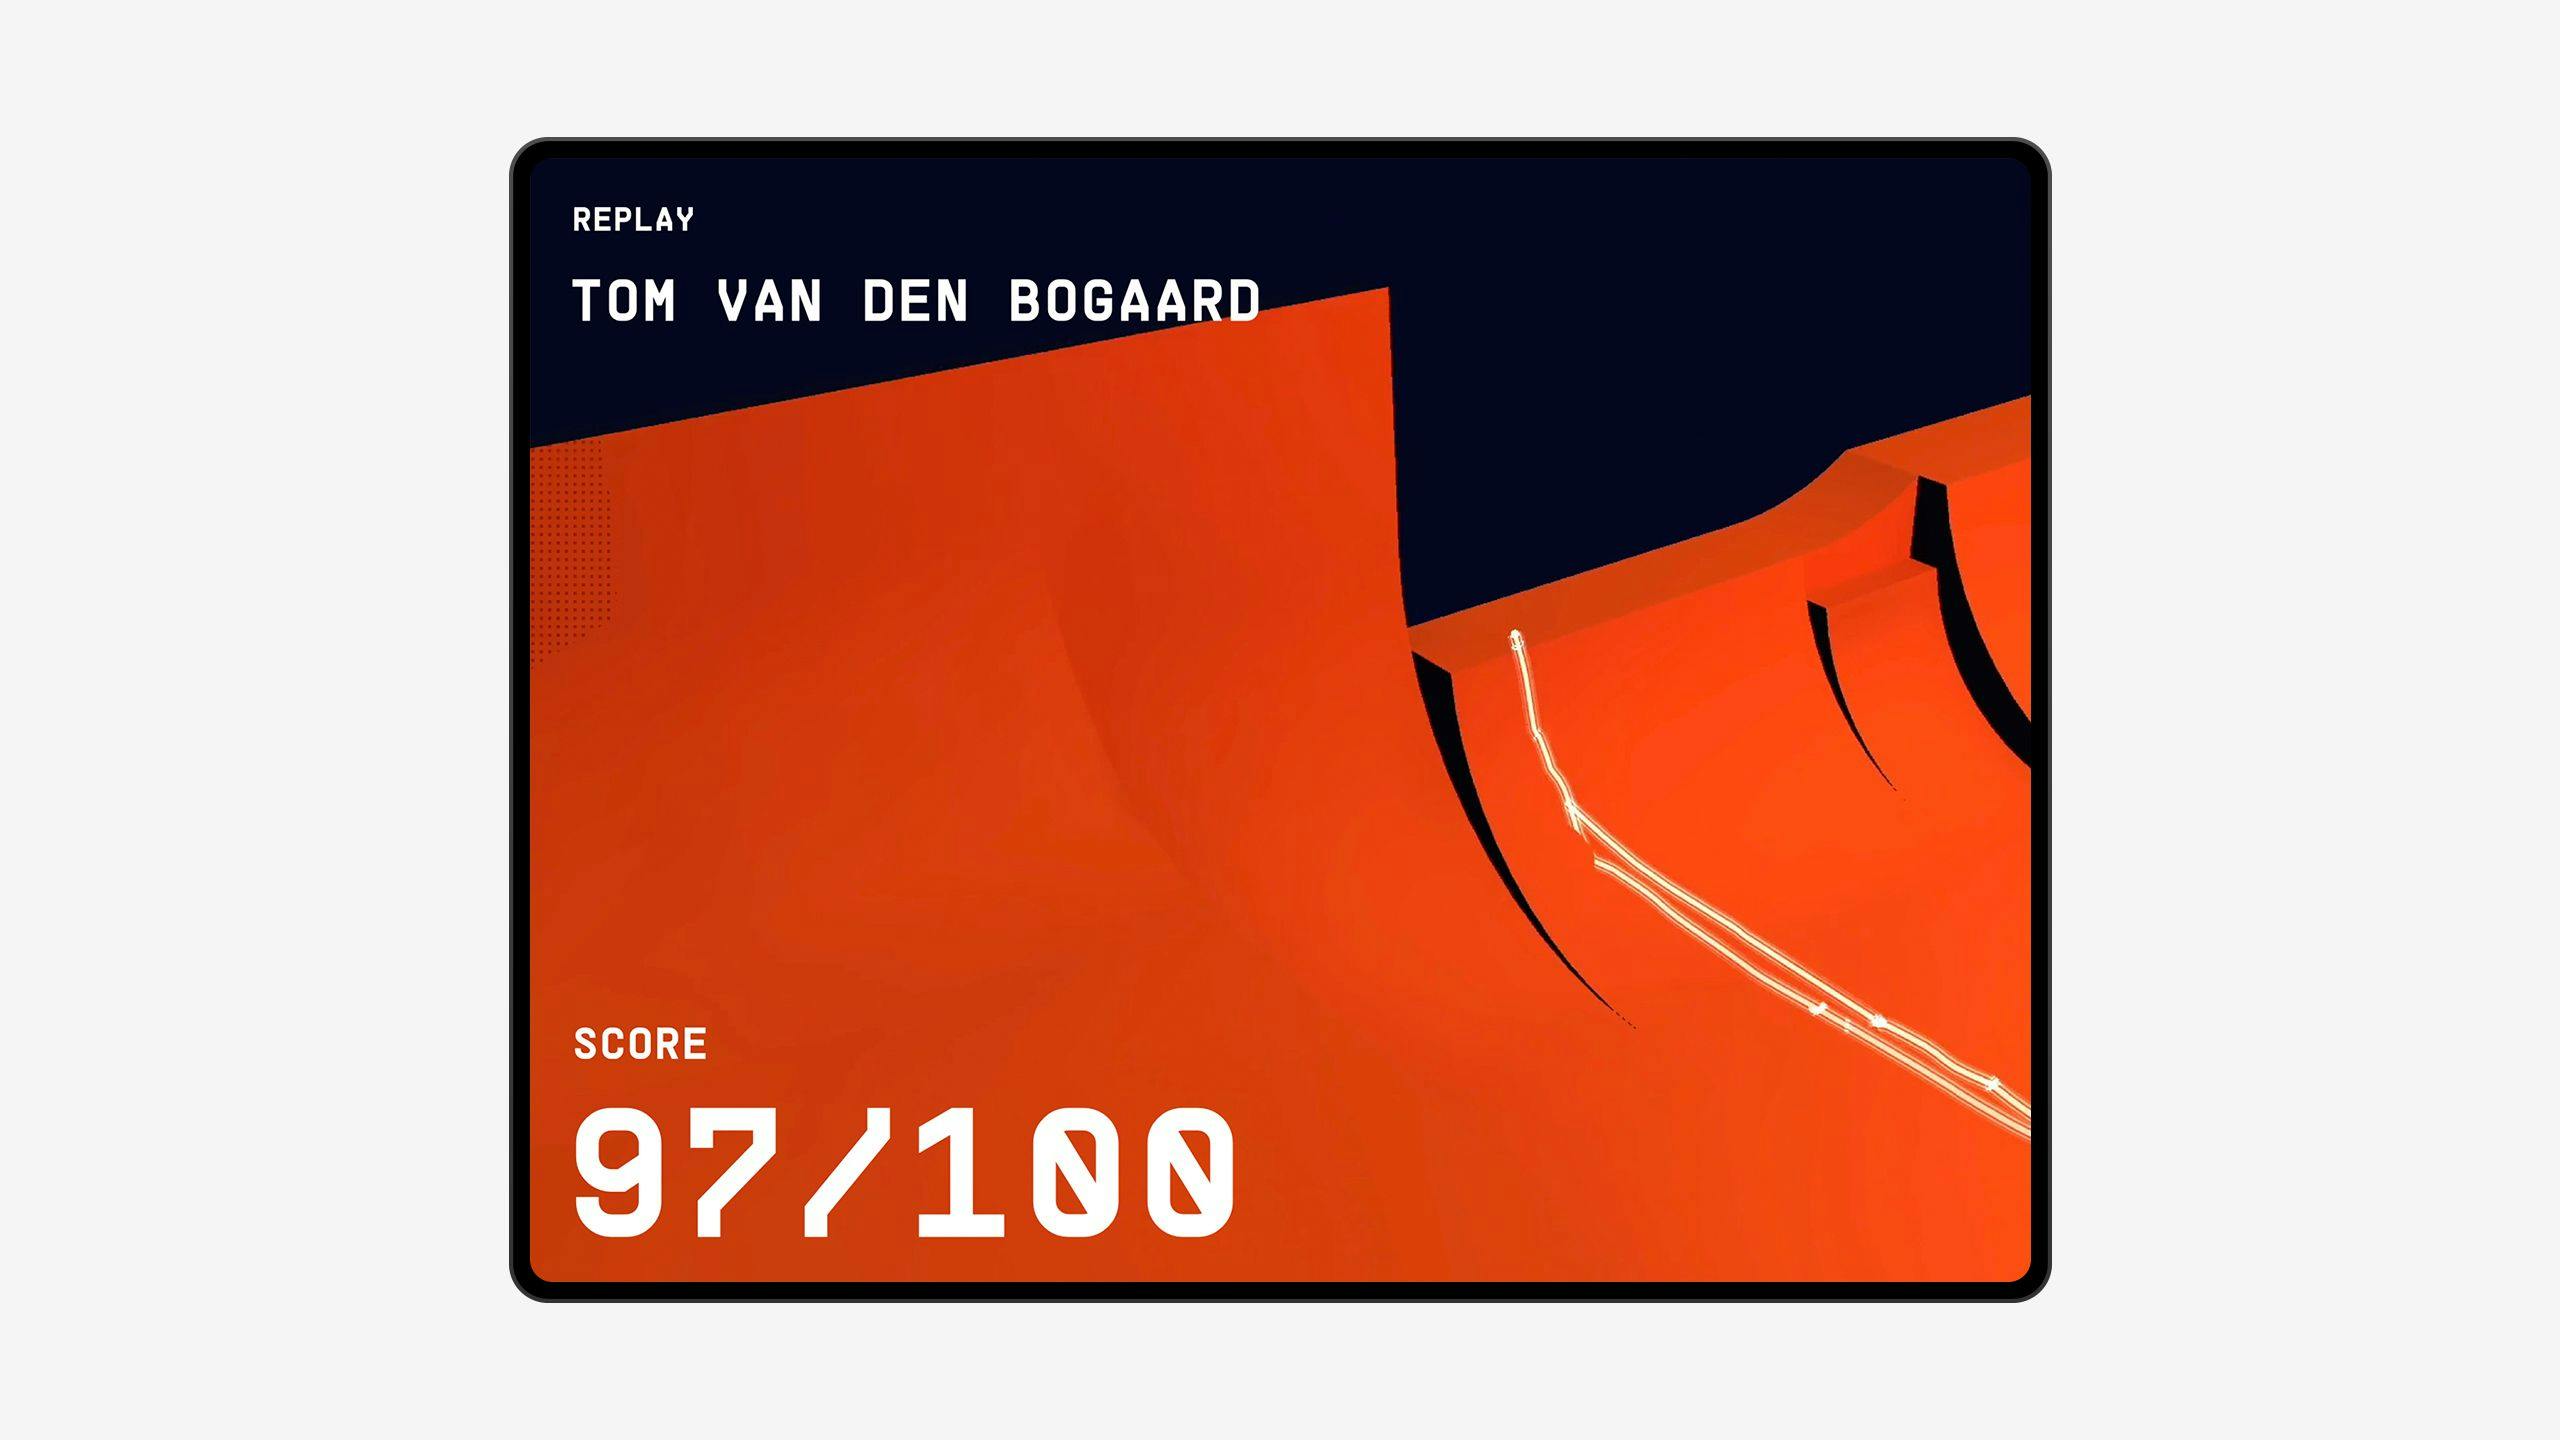
Because this was the Dutch National Championships we used orange as a key color. Orange is the national color of The Netherlands and is also the corporate color of the KNWU. We combined the orange with a dark grungy blue atmosphere, on top of which we presented the data in bright white, highlighting the additional data layer.
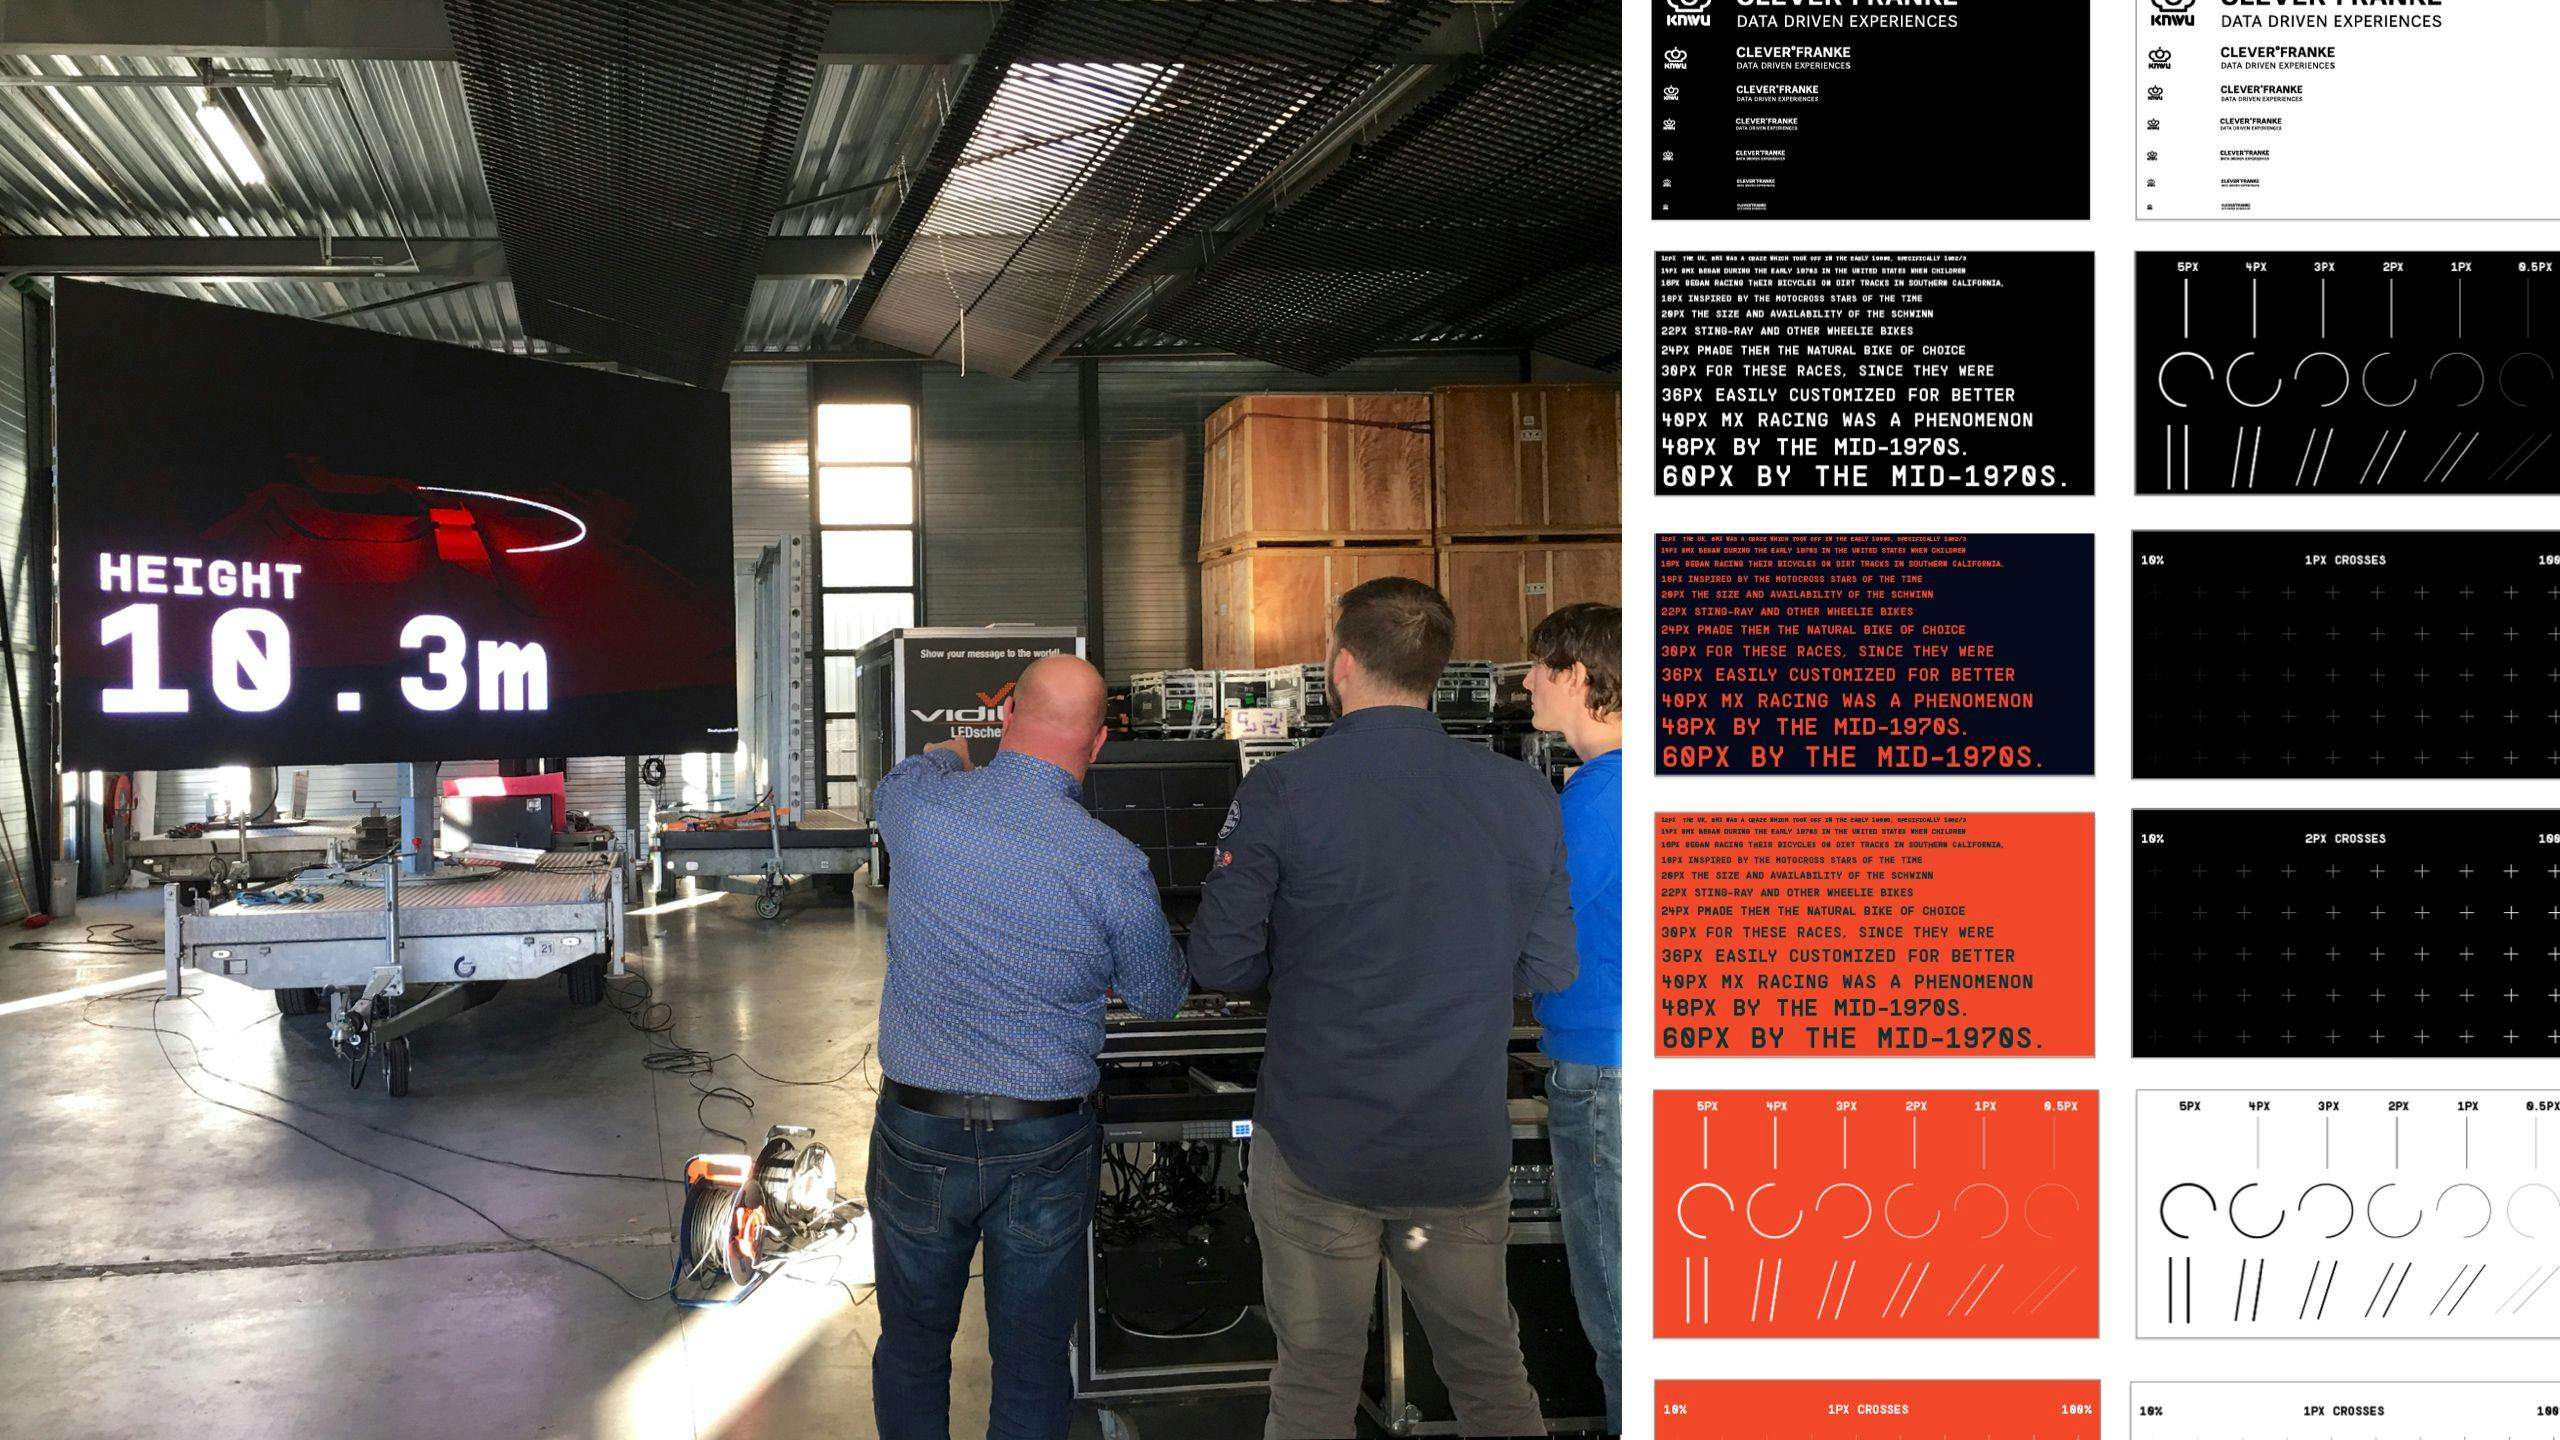
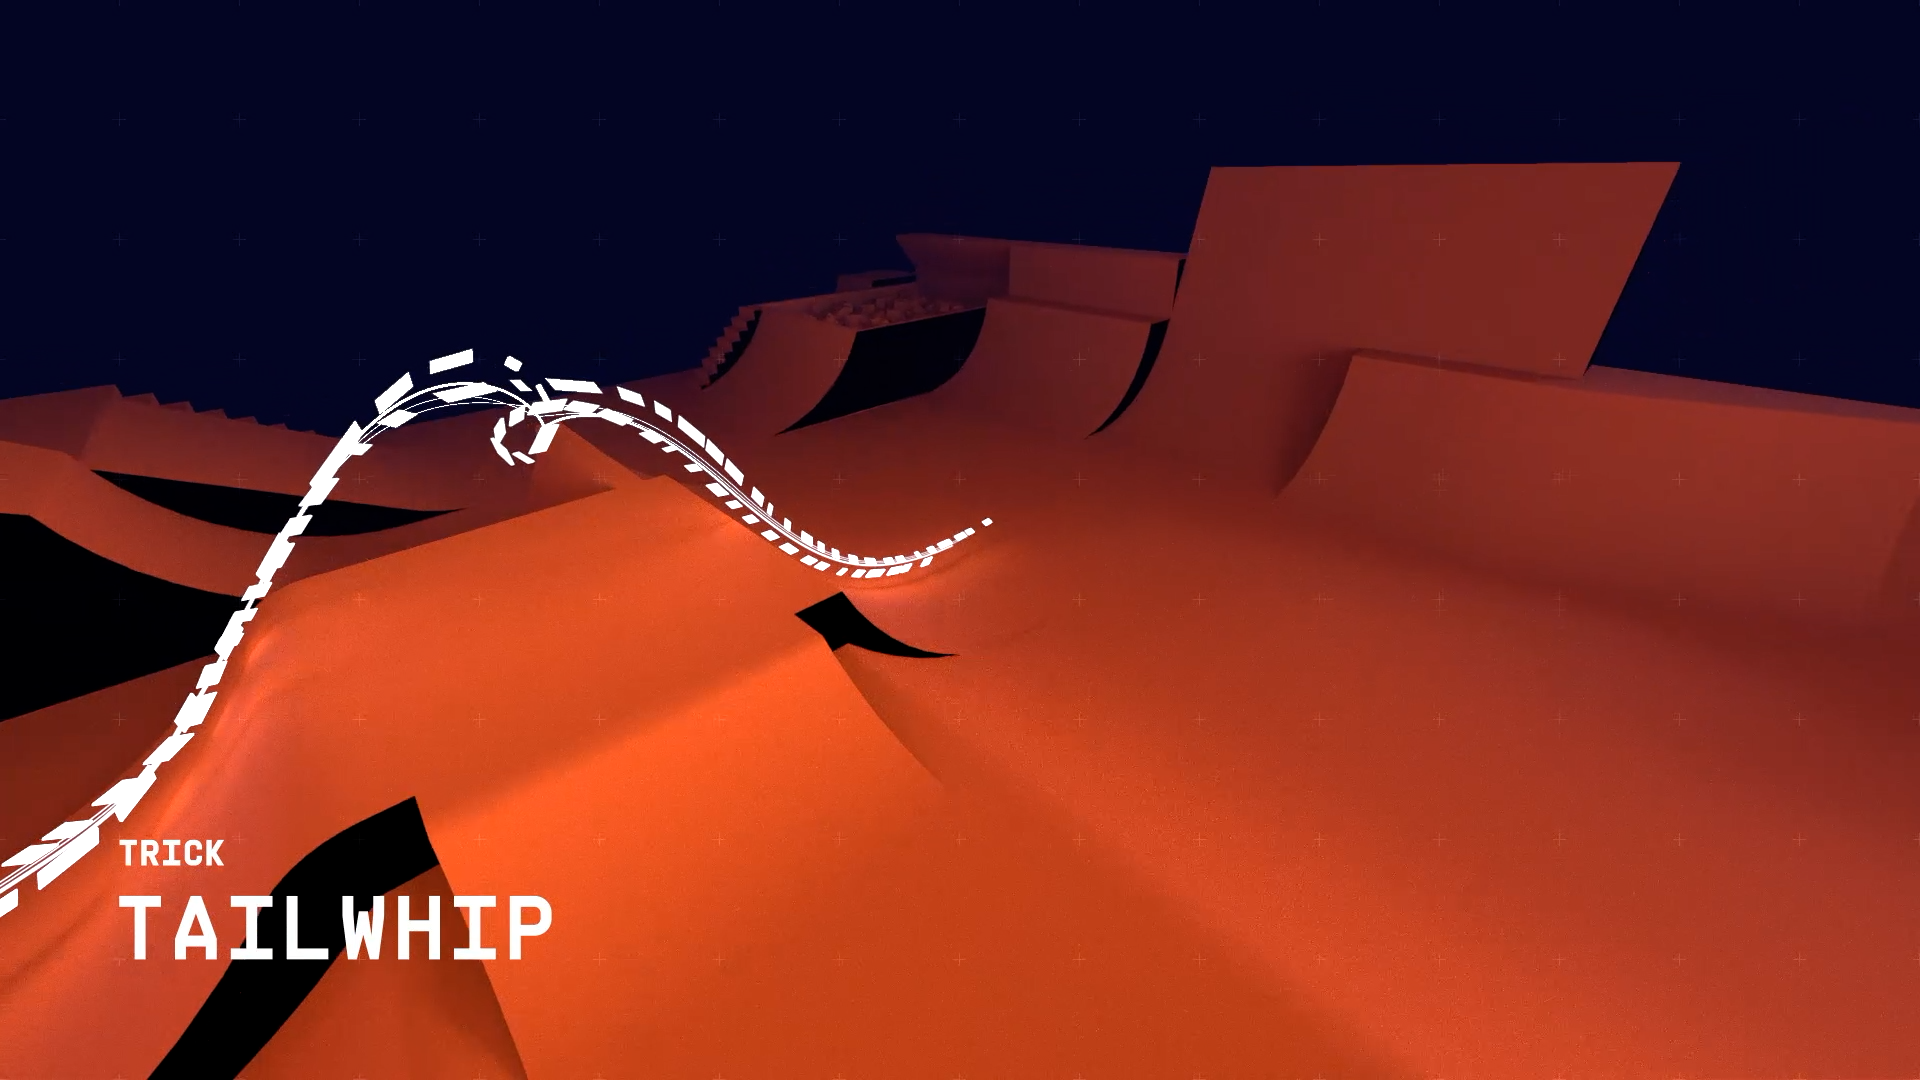
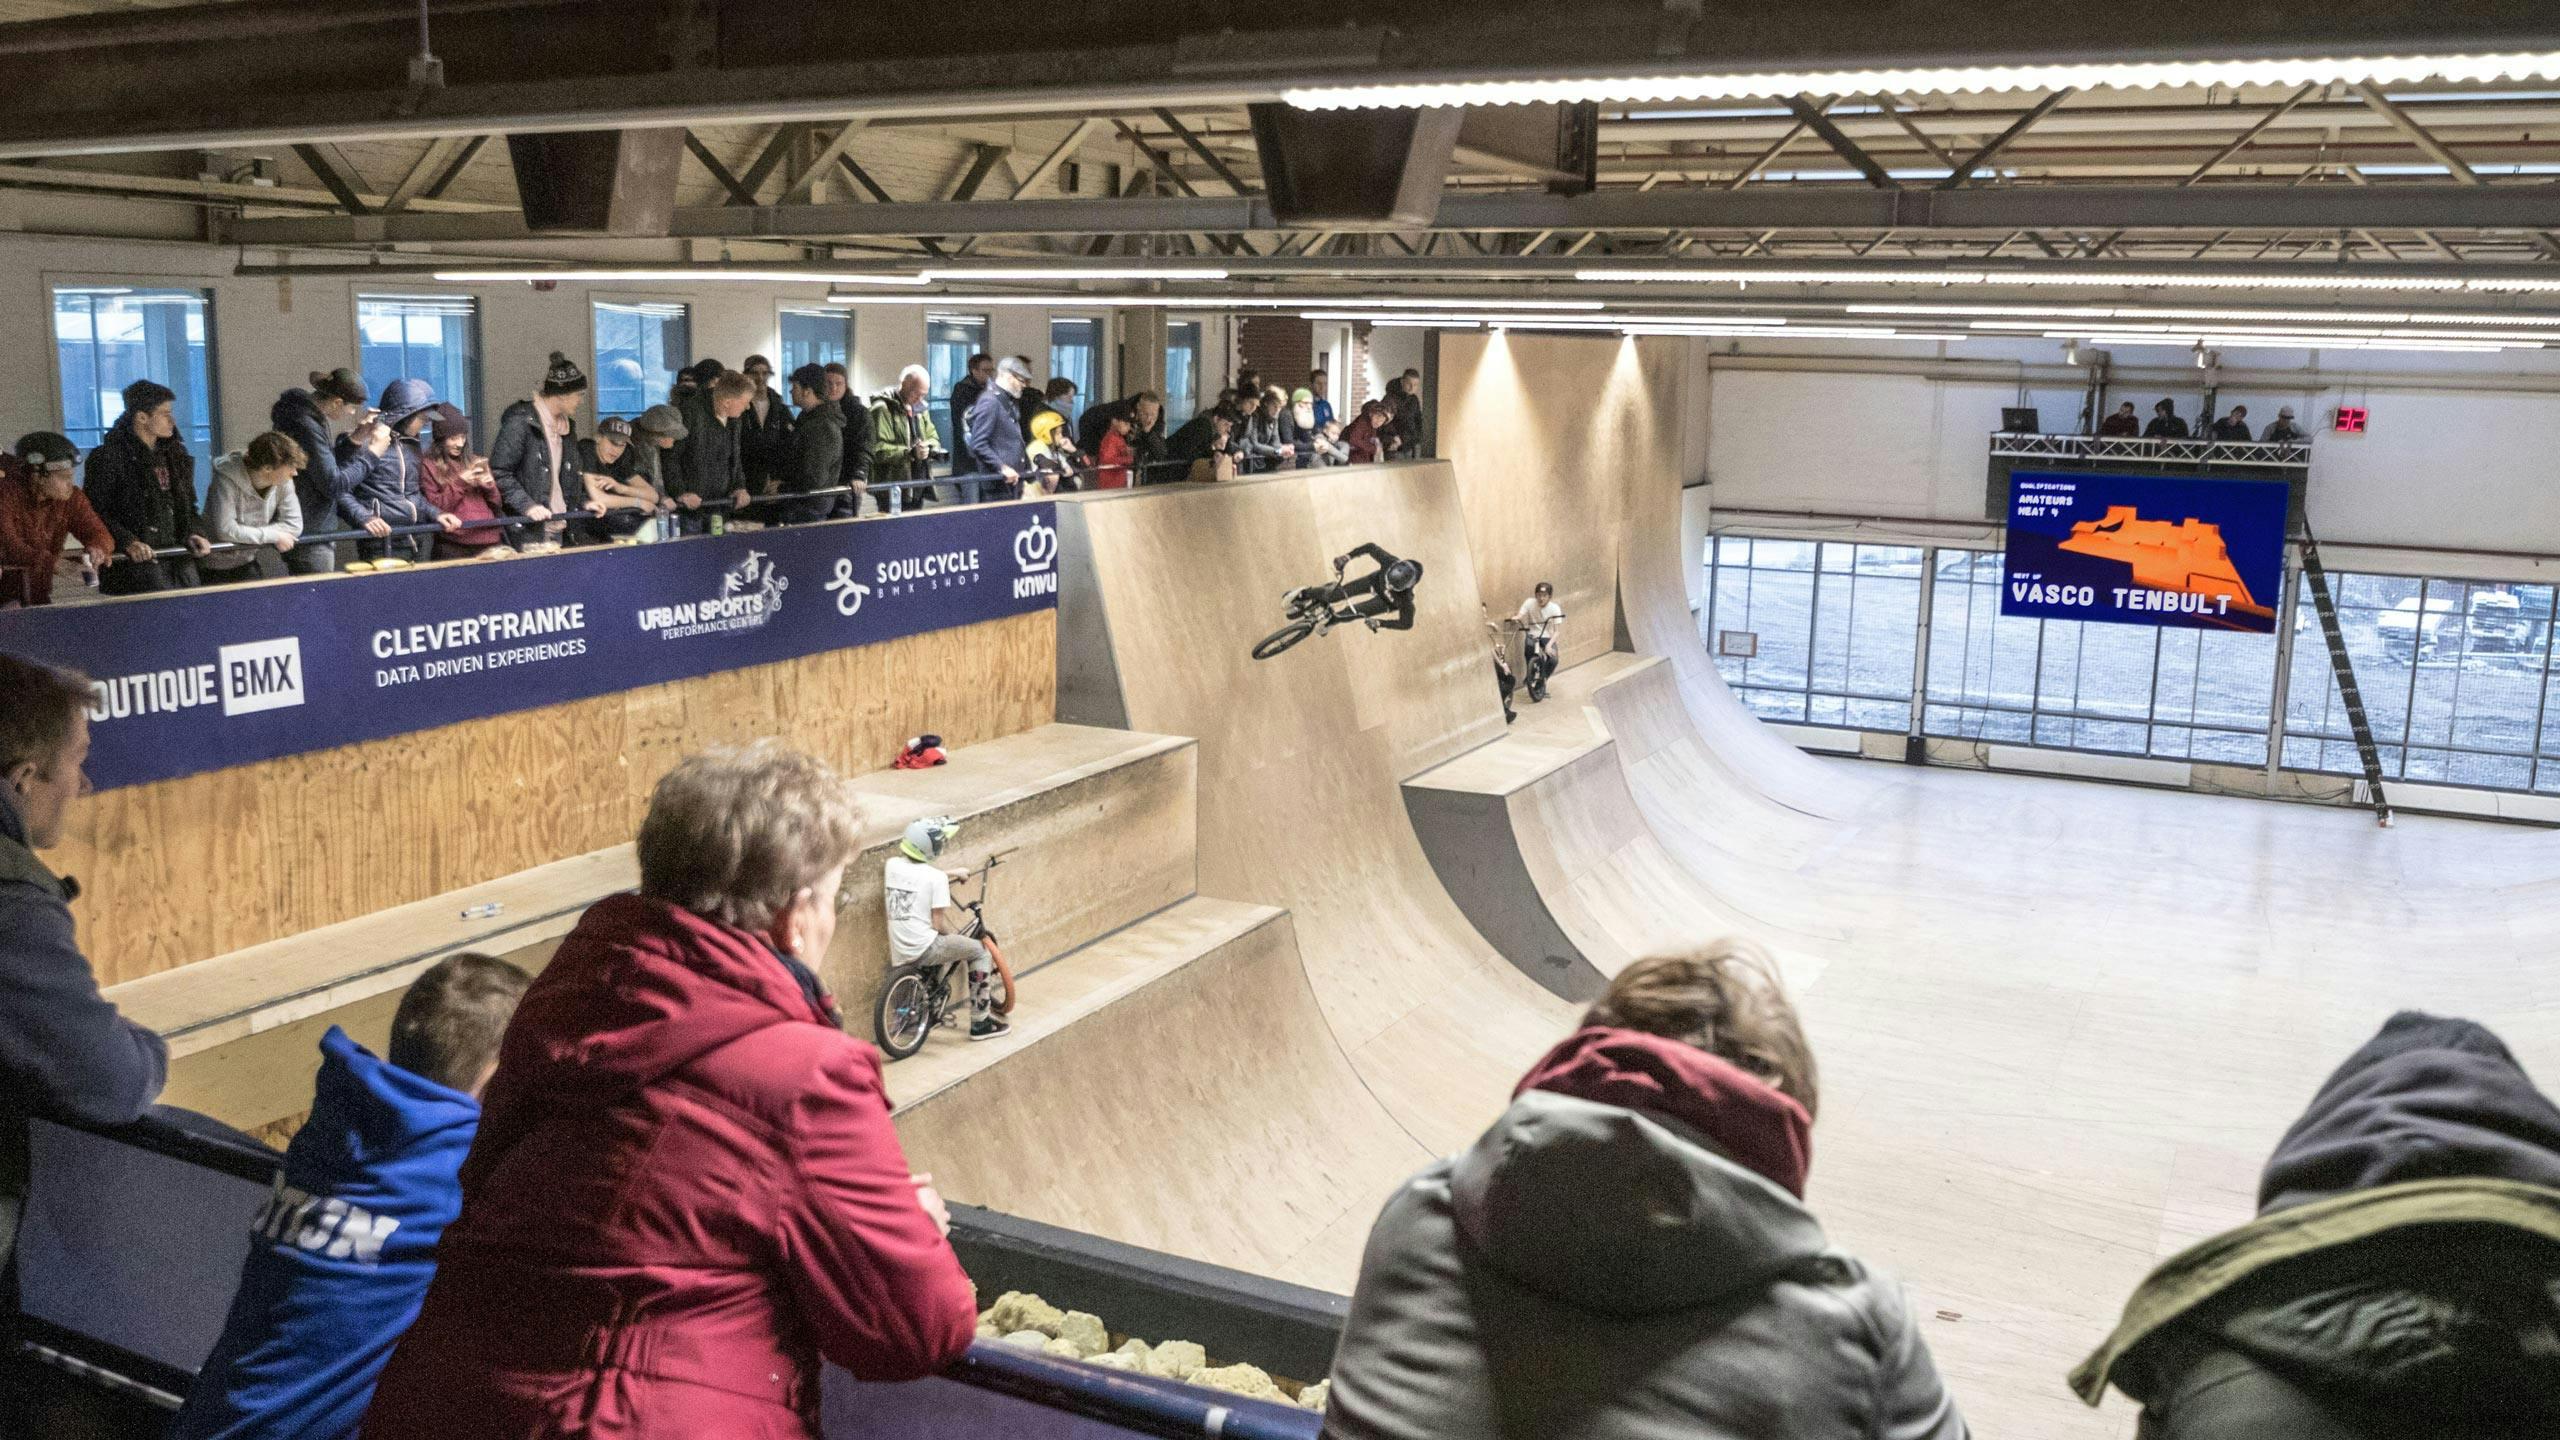
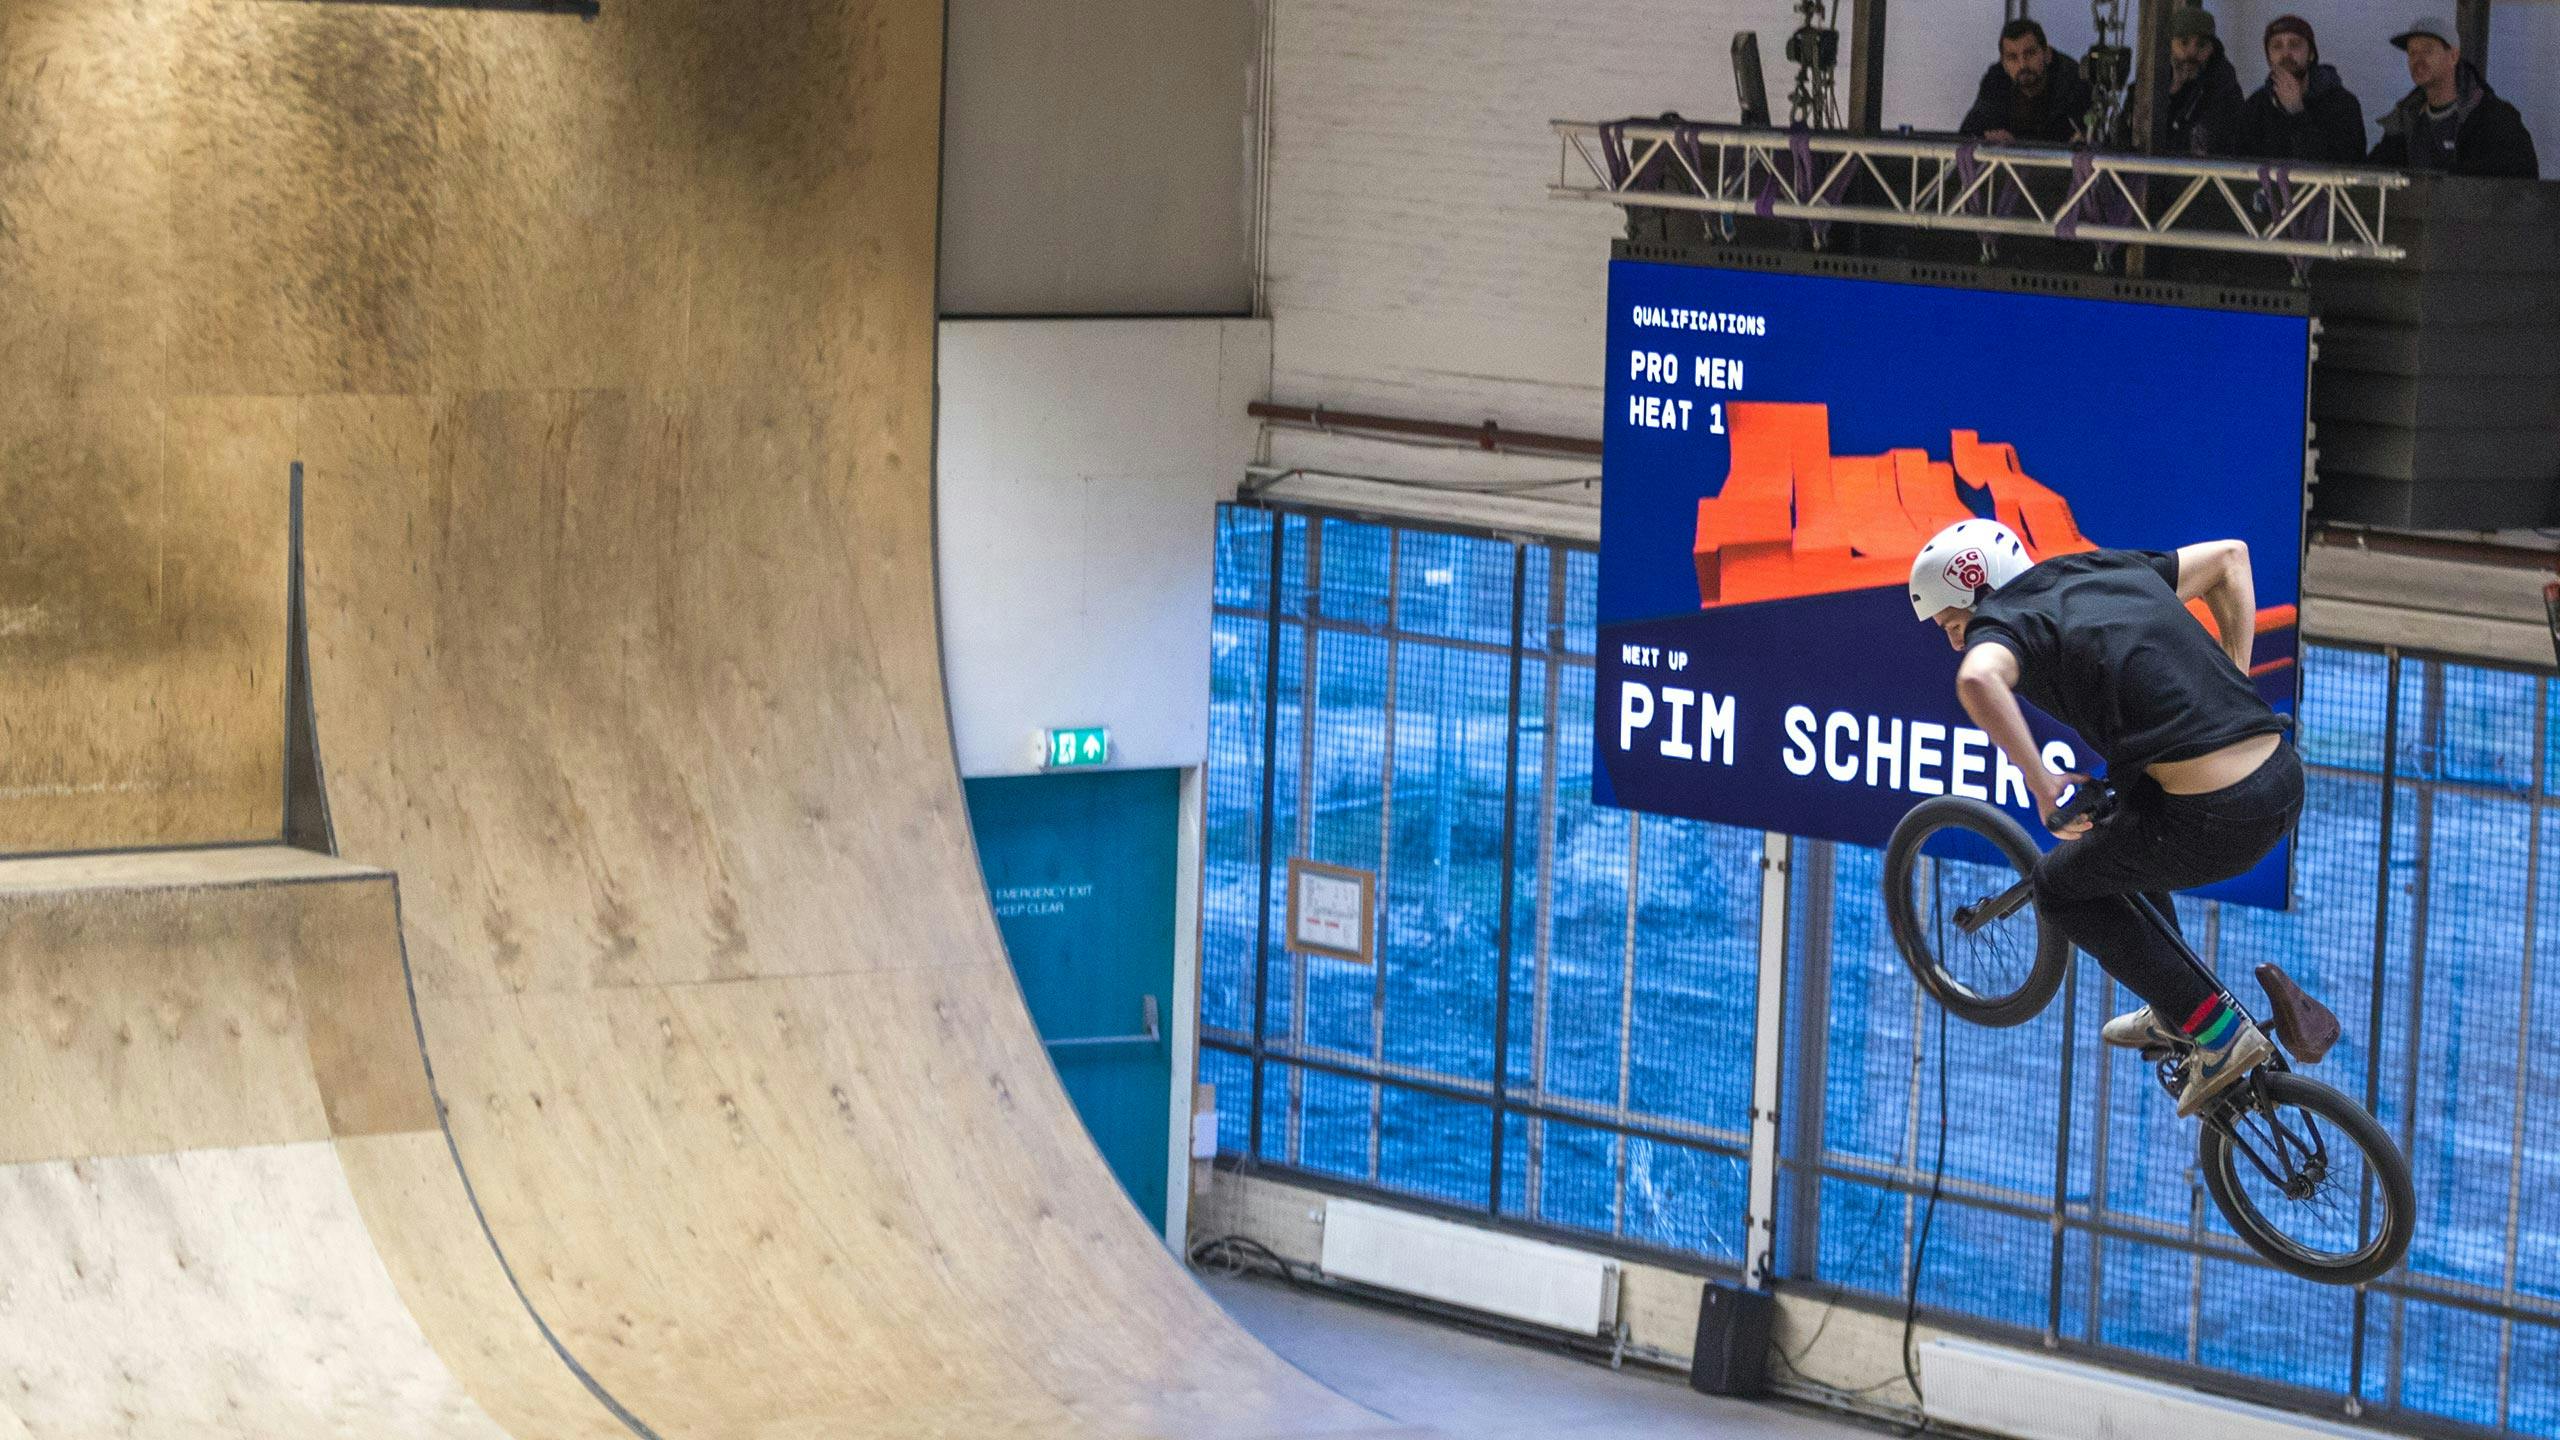
The rider data is traced on the screen using a tire track print as a metaphor and depending on the rider speed has closer or wider dash patterns. The design has a sturdy rugged aesthetic, in line with the whole BMX atmosphere. The rough low-density LED screen at the event further amplified this idea.


During the event, the visuals were shown in a continuous cycle on a large LED display to provide additional perspectives on how well the riders were performing. It also informed spectators about the lineup of the heats, event sponsors, and the score and rank of the riders.
The very precise visuals of the skatepark model, detailed track and datapoints are contrasted with large typography. An information flow was defined by various camera angles showing different perspectives on the ride, and continuously changing to rider data, the event schedule, and other information.
Statistics
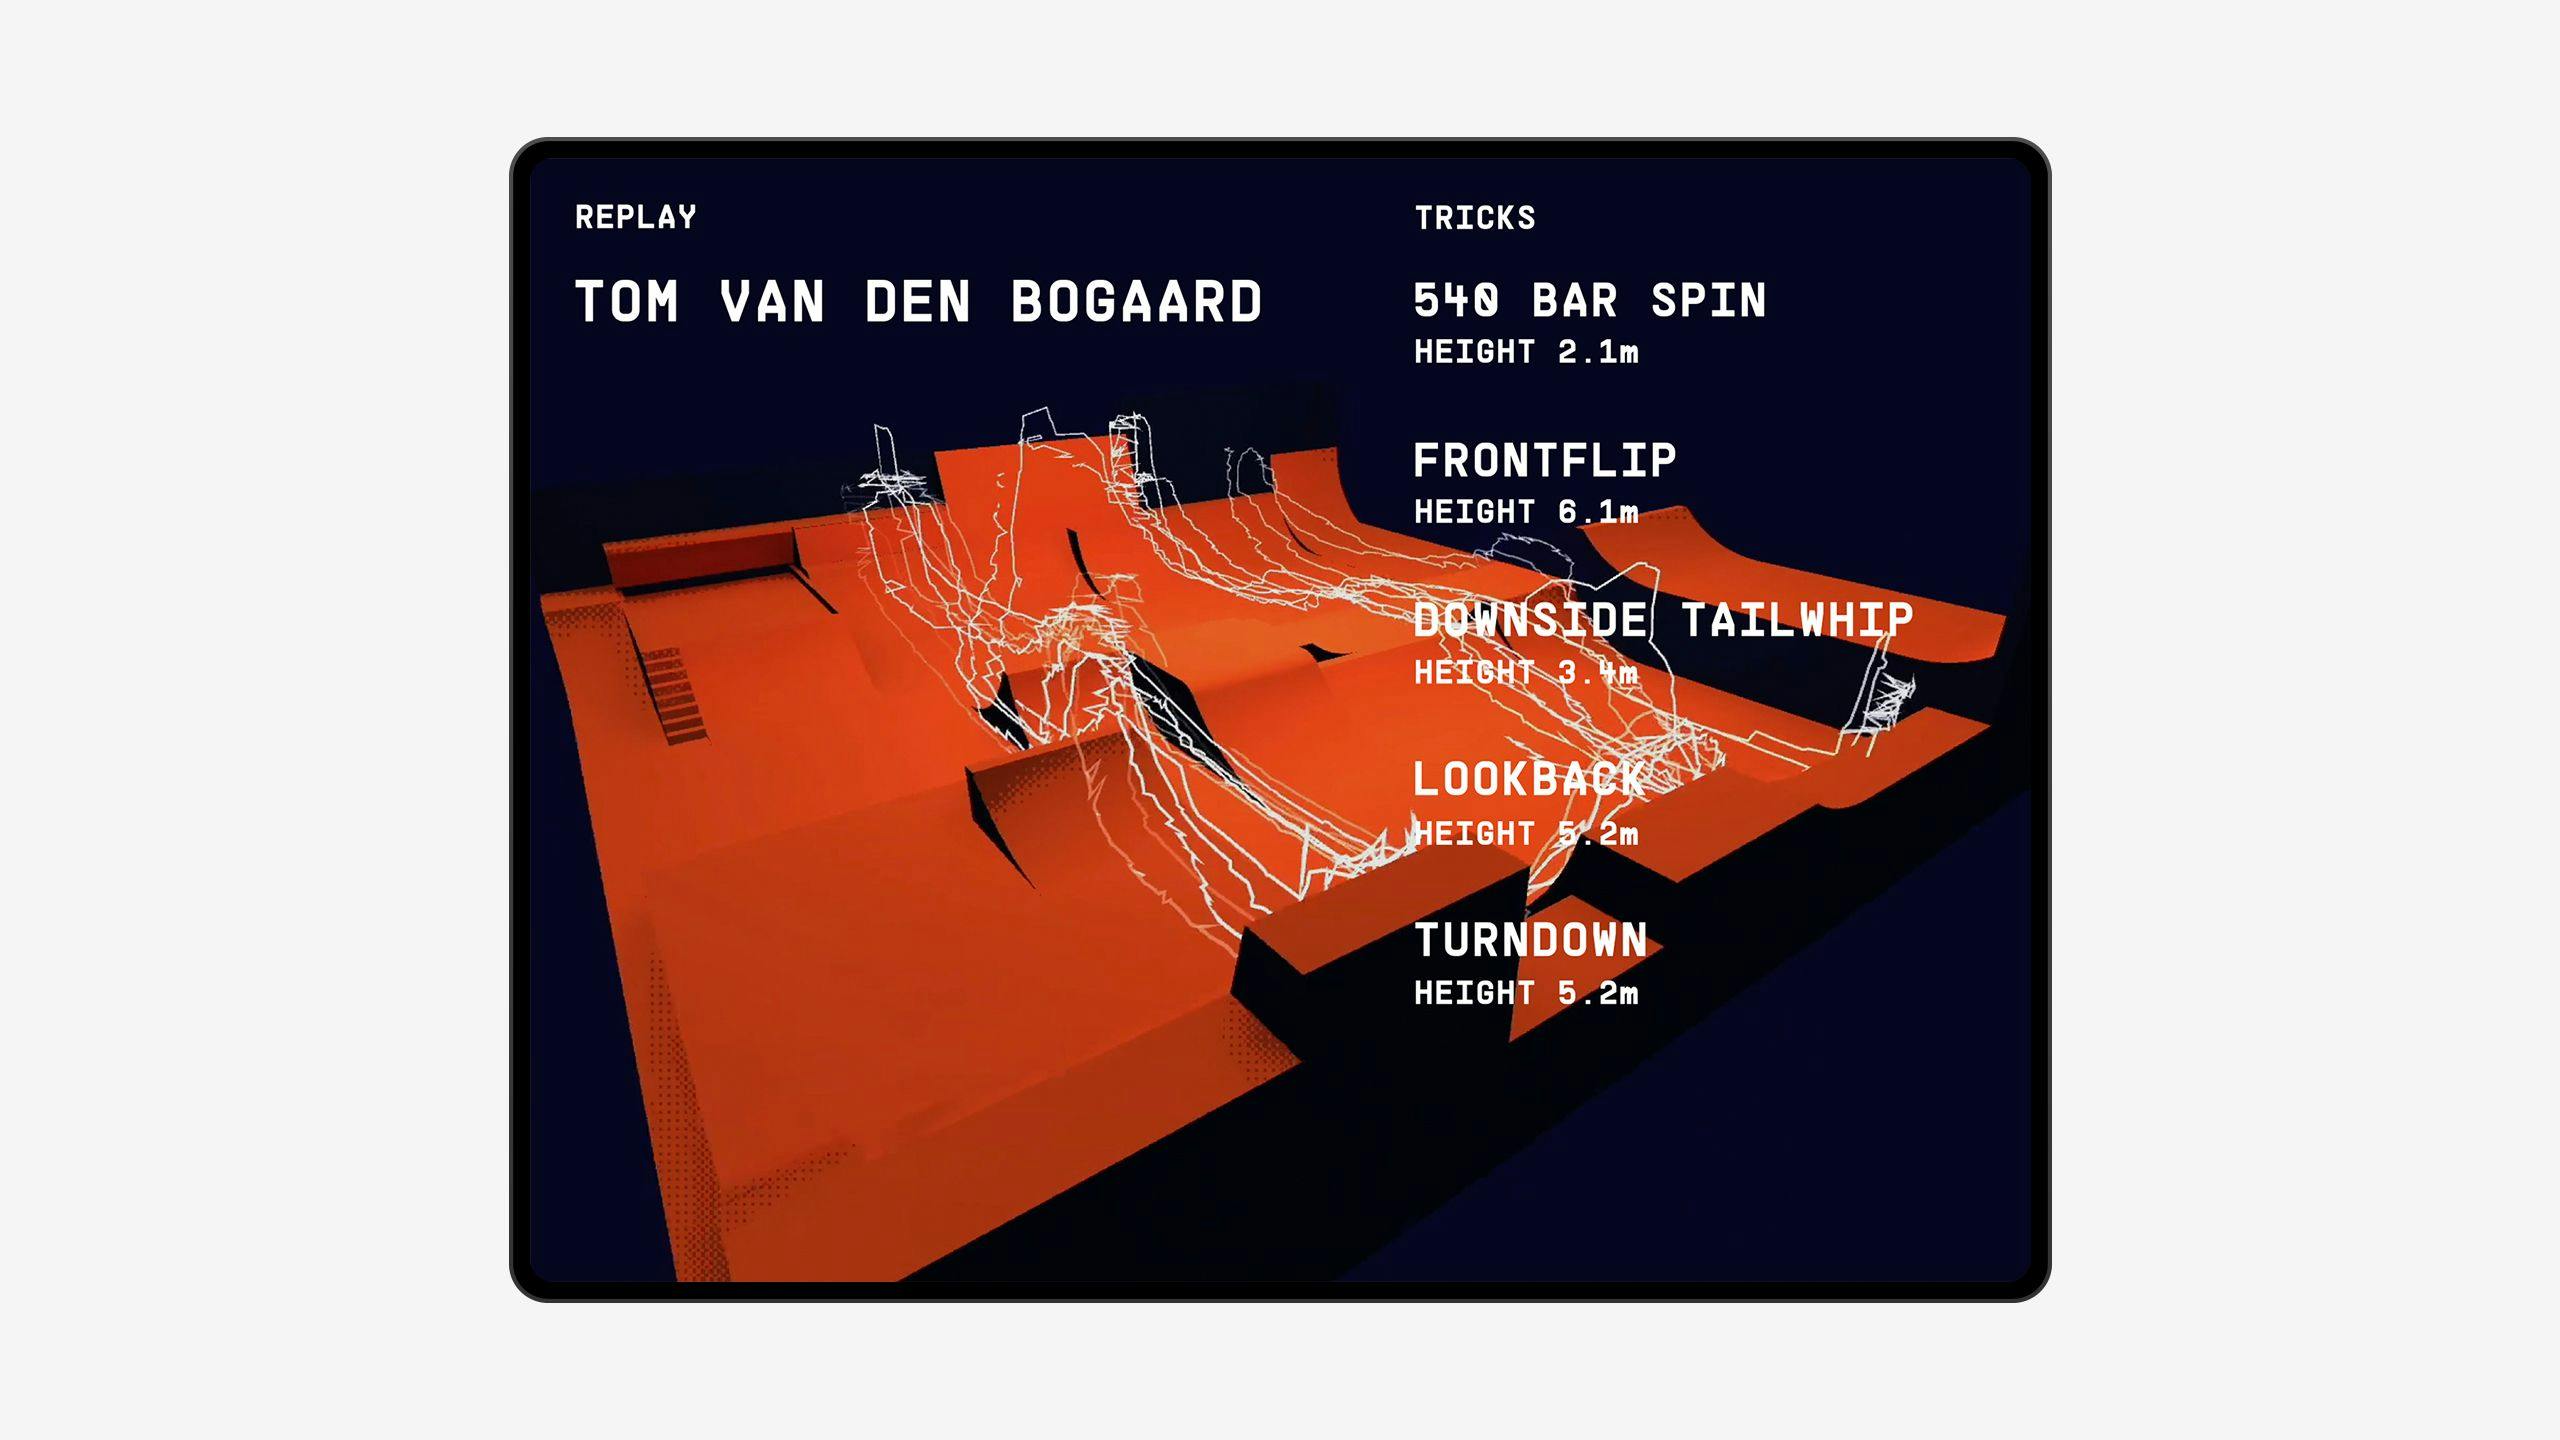
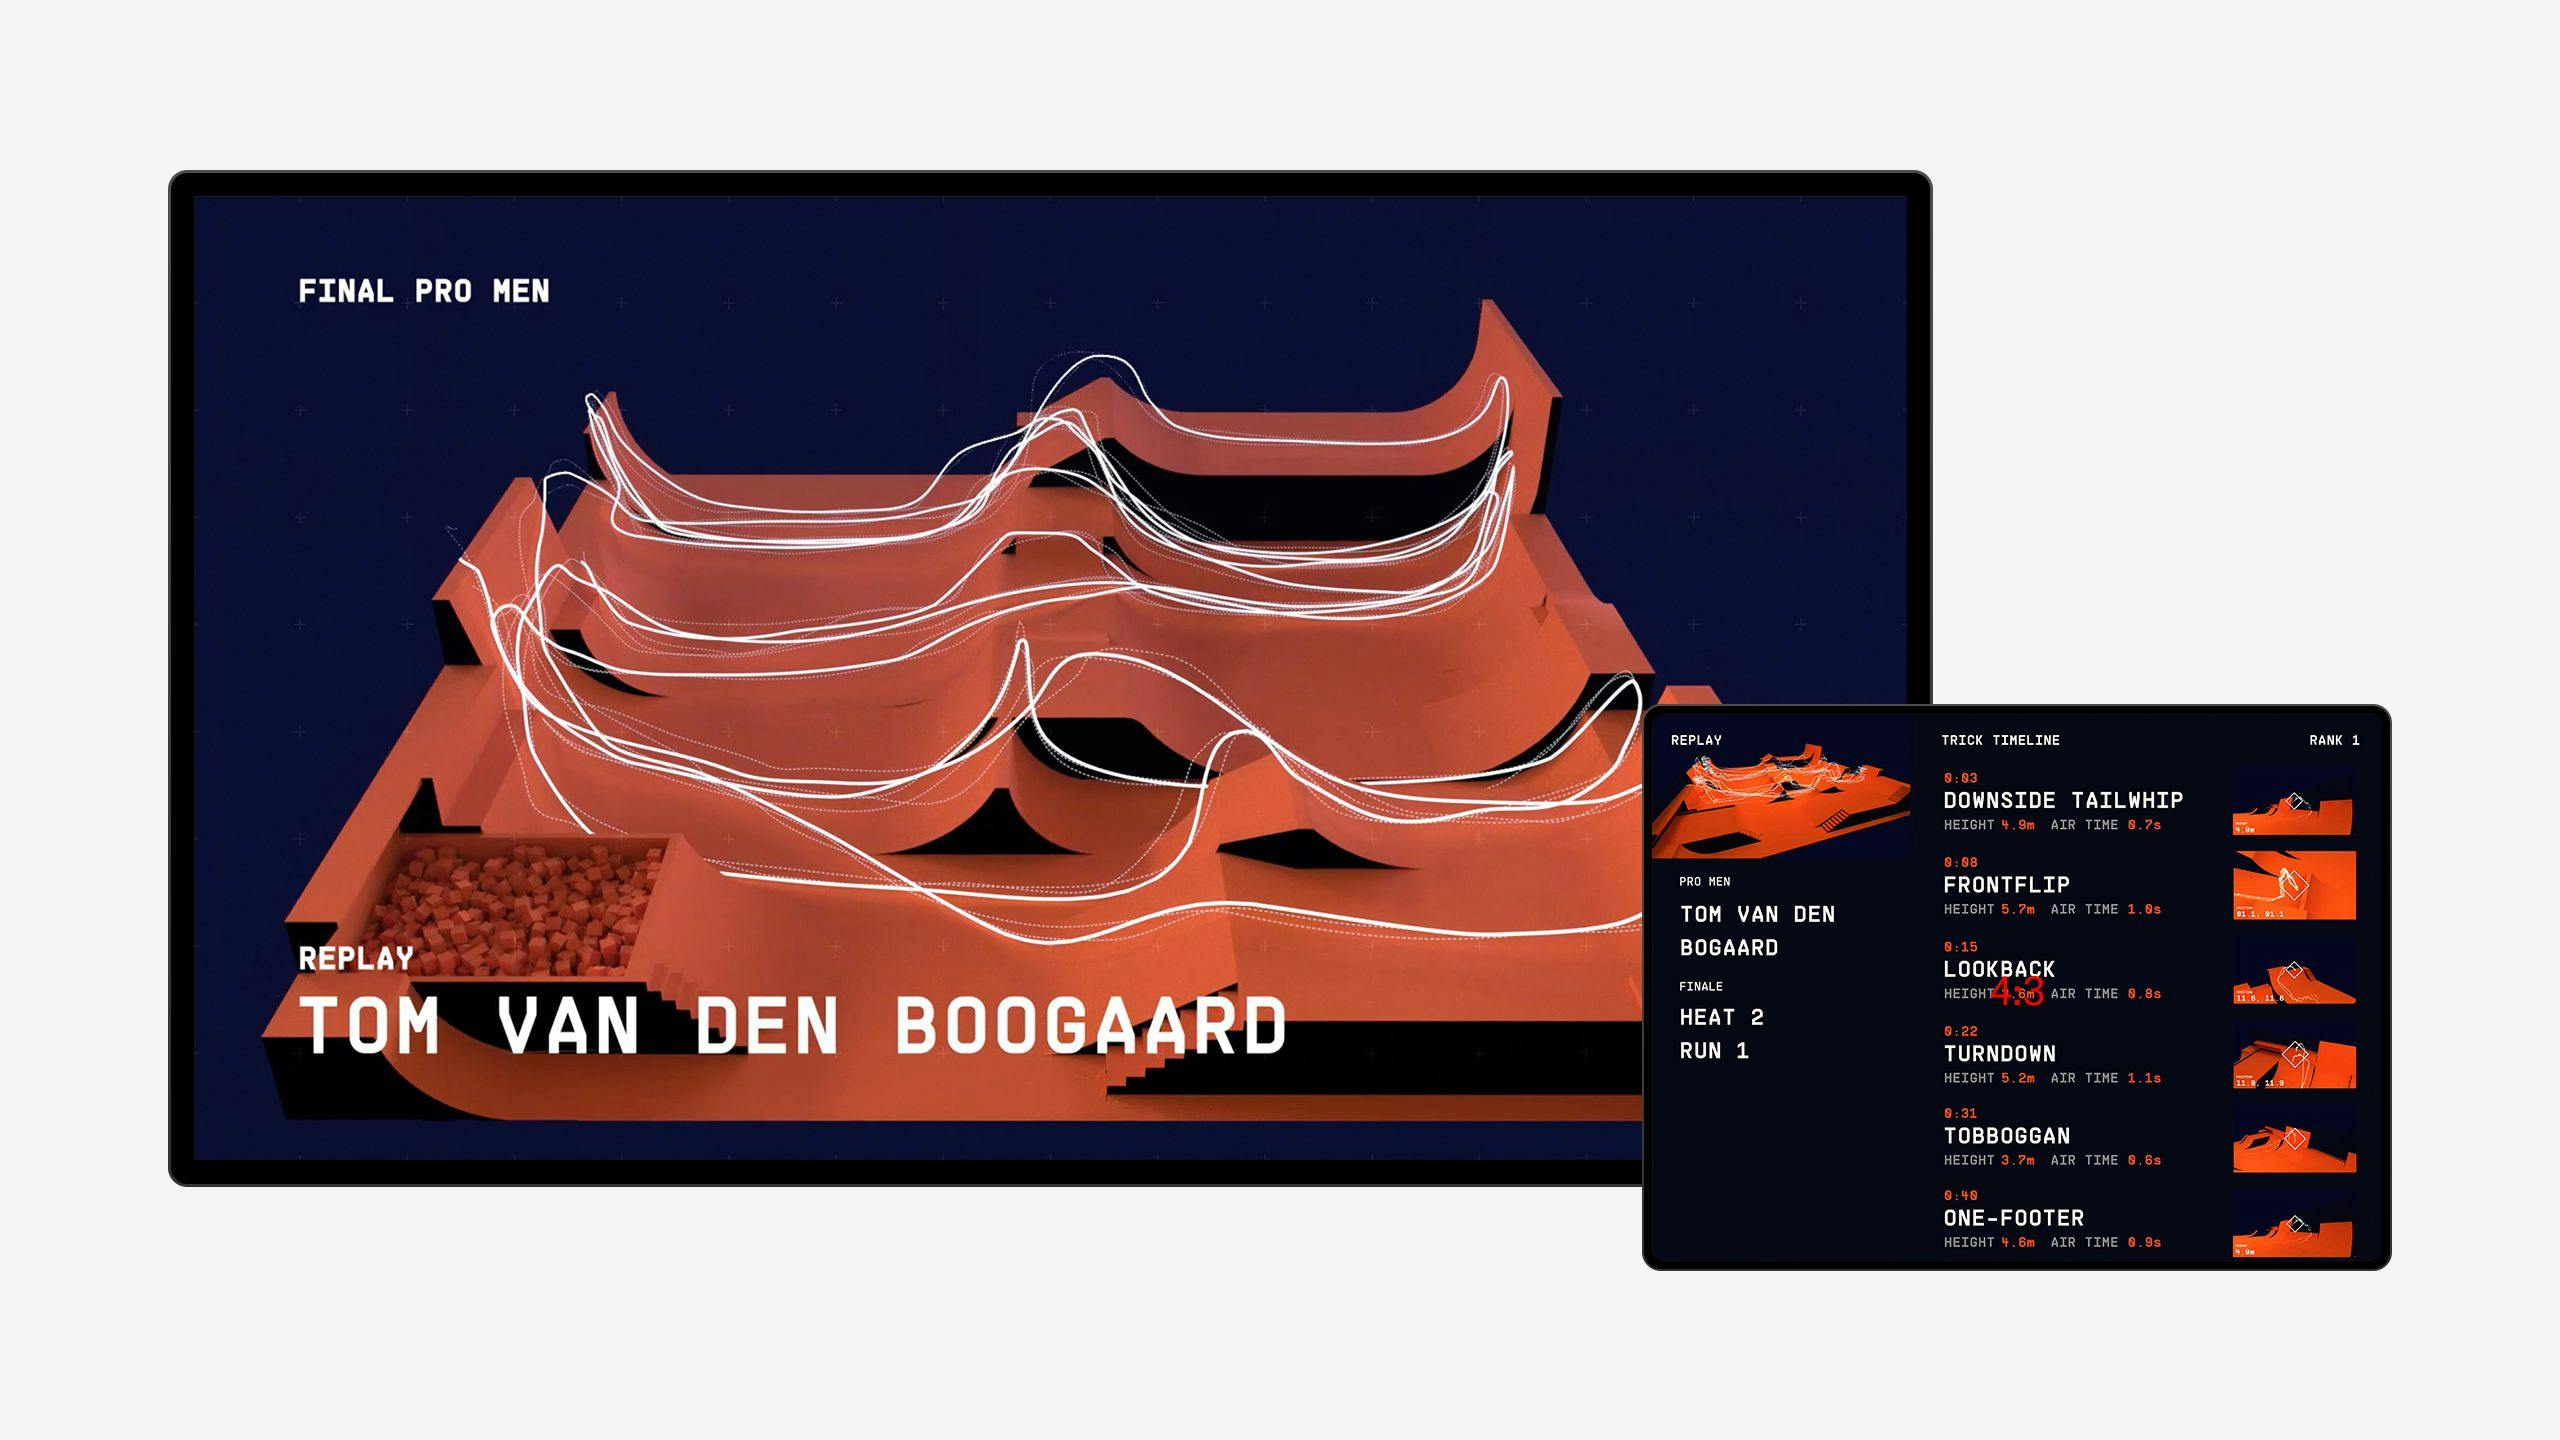
To help the jury judge the riders, we created a dashboard that shows an overview of the rider’s performance. The dashboard showcases several metrics about the rider including how high the rider jumped and how well they used the entire park. It also features replay functionality which could be further complemented with actual ride footage. We envision the same data being used by the athletes to enhance training sessions with more accurate comparison of attempts on a certain trick.
Results
CLEVER°FRANKE helped us to think about how we can further develop the BMX Freestyle sport. The final result is a next level experience for spectators, riders and judges that helps us to put BMX Freestyle on the map as a professional and engaging sport.
Pim Postel
Team Innovation KNWU